● Buffett’s 6-Year Japanese Trading House Bet-10 Surge Signals Market Shift Commodities, Defense, ETFs for H2 US Stocks
Buffett’s Six-Year Accumulation of ‘Japanese General Trading Companies’ — Why Breaking 10% is a Market Signal, and a One-Stop Summary on How to Respond in the US Stock Market in the Second Half with Commodities, Defense, and ETFs
Buffett’s Six-Year Cumulative Acquisition Timeline and Significance,Regulatory and Strategic Signals from Exceeding 10%,The Possibility of a Weak Dollar and Commodity Supercycle,A New Phase of US Government Intervention in Critical Minerals and Defense,Concrete Response Strategies (including ETFs) in the US Stock Market in the Second Half and Risk Management
1) Key Facts in Chronological Order: Buffett’s Acquisition of Japanese Trading Companies (2019→2025)
In the summer of 2019, Buffett (Berkshire) began establishing positions in Japan’s top five general trading companies.In August 2020, official disclosures revealed the acquisition of approximately 5% stakes in each company.Subsequently, through consistent additional purchases from 2021 to 2023, stakes were expanded to an average of around 7%.From 2024 to 2025, stakes have continuously risen, exceeding 9% to 10% in some stocks.As of 2025, some companies have begun to be listed as ‘major shareholders’ with stakes exceeding 10%.This process is not a one-off investment but a pattern of deliberate and sustained ‘conviction buying’ over several years.
2) The Most Important Observation, Not Widely Discussed — The Meaning Beyond Exceeding 10%
Exceeding a 10% stake is more than just a number.In many countries, 10% is a threshold for regulation, reporting, and trading restrictions.Exceeding 10% triggers enhanced disclosure obligations, stricter internal trading regulations, and increased responsibility for major shareholders.Buffett’s willingness to bear these burdens by exceeding 10% signals a ‘strategic conviction’ rather than a mere investment.In other words, Buffett’s positioning in Japanese general trading companies can be interpreted as a bet on the “long-term inflation and commodity cycle,” not just speculative stock price appreciation.Furthermore, the fact that Japanese trading companies have entered the top ranks of Berkshire’s portfolio signifies a significant shift in internal capital allocation.
3) Macroeconomic Linkages: Why This is a ‘Commodity and Inflation’ Signal
General trading companies’ core businesses involve trading and transactions of physical goods such as commodities, energy, food, and metals.Their performance is directly linked to rising commodity prices.Buffett’s purchases can be interpreted as a bet on a scenario of a weak dollar, expanded liquidity, and accelerating inflation.Concurrently, the US government’s strategic investments and increased intervention in critical minerals (rare earths, lithium, cobalt, etc.), defense, and national security industries simultaneously stimulate both private and public demand.Ultimately, this presents a complex signal heightening the possibility of long-term trends in commodity, defense, and national security-related sectors in the market.
4) Recent Changes from a Government and Policy Perspective (Very Important)
The US Departments of State, Commerce, and Defense have officially mentioned the possibility of direct government investment and stake acquisitions in critical minerals and defense.This signals a shift beyond simple subsidies or policy support, indicating that ‘the government intends to become a pillar of the market.’The fact that the Departments of Defense and Energy are already increasing their financial investments in critical minerals marks the beginning of a change in supply chain policy.When policies simultaneously target the stabilization of demand and supply, it can exert upward pressure on the prices of specific commodities and minerals in the long term.
5) Market Reaction and Data (Summary of the Last Year’s Trend)
Japanese trading company stock prices have consecutively reached new highs and record highs since Buffett’s disclosures.Commodity ETFs, particularly those related to gold, silver, lithium, and rare earths, have shown relative strength.Berkshire Hathaway’s stock price has also outperformed the market due to the effects of its subsidiaries and holdings.Estimated average annual returns (during the period of Buffett’s acquisitions): generally around 20% per year (with variations depending on the stock and timing).(Note: Past performance does not guarantee future returns; it is for directional and momentum reference only.)
6) Response to the US Stock Market in the Second Half (2025 H2) — Checkpoints by Timeline
Around September: Pay attention to the Fed’s stance on interest rates, unemployment rates, and consumer spending indicators.As a weak dollar takes hold, commodities and international markets will react first.Year-end: Volatility in the defense and critical minerals sectors will likely increase based on government budget and national defense/industrial policy announcements.Outlook for 2026-27: The need for portfolio flexibility to prepare for the possibility of accelerating inflation (depending on the scenario) is crucial.
7) Sector Analysis — Opportunities and Risks
-
Japanese General Trading Companies (Mitsubishi, Itochu, Mitsui, Marubeni, Sumitomo, etc.)Opportunities: Benefiting from global trading networks and rising commodity/energy prices.Risks: Exchange rates (Yen), trade policies, increased regulations, risk of buying at the peak.
-
Commodities and Minerals (Gold, Silver, Lithium, Uranium, Rare Earths)Opportunities: Weak dollar, policy-driven demand, expanding demand from electric vehicles and renewable energy.Risks: High cyclicality and the risk of being caught at the peak.
-
Defense (Lockheed Martin, Raytheon, etc.)Opportunities: Medium to long-term benefits from geopolitical tensions and increased government spending.Risks: Volatility due to political risks and budget cycles.
-
Financials and Conglomerates (Berkshire Hathaway, etc.)Opportunities: Changes in Buffett’s portfolio impact the trend of large-cap value stocks.Risks: Uncertainty regarding leadership transition, concerns about stock overvaluation.
8) Top 15 Individual Stocks to Watch in the Second Half (Investment Ideas, for Educational Purposes, Not Investment Advice)
Berkshire Hathaway (BRK.B) — A way to buy Buffett’s portfolio itself.Mitsubishi Corporation (Osaka Code 8058) — Representative of Japanese general trading companies.Itochu (8001) — Holds retail, resources, and agriculture portfolios.Mitsui & Co. (8031) — Strong in trading and resources.Marubeni Corporation (8002) — Exposure to commodities and energy.Sumitomo Corporation (8053) — Exposure to minerals, chemicals, and energy.Lockheed Martin (LMT) — Leading US defense contractor.Northrop Grumman (NOC) — Exposure to high-tech defense.BHP (BHP) — Major mining company (iron ore, copper, etc.).Rio Tinto (RIO) — Base metals such as copper and aluminum.Freeport-McMoRan (FCX) — Large copper/gold mining company.Newmont (NEM) — Gold mining company (inflation hedge).Albemarle (ALB) — Lithium (battery raw material).Cameco/Cameco (CCA or CCJ etc., Uranium stocks) — Uranium (nuclear power demand).Glencore (GLEN or representative industry companies) — Diversified mining trading.
Each stock has different industry exposure, policy sensitivity, and cyclical characteristics. It is recommended to check individual risks and invest in small amounts incrementally.
9) 5 Recommended ETFs for the Second Half (For Sector and Risk Diversification)
Choosing ETFs is a practical way to reduce individual stock risk.1) Broad Commodity ETFs (e.g., DBC/GSG family) — Broad exposure to commodities.2) Gold/Silver ETFs (GLD, SLV, etc.) — Inflation and safe-haven hedge.3) Rare Minerals/Rare Earths ETFs (REMX, etc.) — Exposure to strategic minerals.4) Uranium ETFs (URA, etc.) — Betting on nuclear power demand growth.5) Defense/Aerospace ETFs (ITA, XAR, etc.) — Diversified exposure to the defense industry.
ETFs reduce stock-specific risk, but losses can occur if the sector’s cyclical direction is misjudged. Therefore, establish position sizing and stop-loss rules in advance.
10) Practical Response Strategies — Buy/Sell Criteria and Positioning
Position Sizing: Recommended to limit to within 5-15% of the total portfolio, depending on risk tolerance.Dollar-Cost Averaging: Recommended for systematic investing and dollar-cost averaging due to high cyclical volatility.Trigger (Buy): Indicators of sustained dollar weakness + rising commodity futures index (act when both indicators align).Trigger (Sell): Adjustment when policy changes (subsidy discontinuation), demand destruction (sharp economic downturn), or overheating (short-term RSI, volume surge) occurs.Risk Management: Minimize leverage usage, consider hedging with options (put options).Taxes, Dividends, Exchange Rates: For overseas stocks, always consider currency hedging costs, dividend taxes, and transaction fees.
11) Economic Indicators and Time Series to Monitor (Second Half Priorities)
- Dollar Index (DXY): A shift to dollar weakness is key.
- Commodity Futures Index (GSCI, CRB): Confirm trend reversal signals.
- US CPI/PCE Price Indices: To determine if inflation is re-accelerating.
- Inventory and Transportation Indicators: To confirm physical demand and supply bottlenecks.
- Policy Announcements (US Government’s budget for critical minerals/defense): To identify beneficiary sectors.
12) Practical Checklist for Investors (Beginner, Intermediate, Advanced)
Beginners: Approach commodities and defense with small amounts and focus on ETFs.Intermediate: Combine individual stocks (Japanese trading companies, mining companies) and ETFs, establish rules for incremental buying.Advanced: Hedge risks with derivatives (options), possibility of event trading around policy announcements.Common: Avoid excessive leverage. Strictly adhere to position sizing rules.
13) Buffett Tracking Strategy vs. Direct Berkshire Acquisition — Which is Better?
Two strategies to consider instead of blindly following Buffett:1) Directly acquire Buffett’s investment targets (Japanese trading companies, etc.) — Potential for higher returns, but individual risks exist.2) Directly hold Berkshire (BRK.B) — Benefit from the comprehensive capital allocation by the Buffett team, more diversified exposure.In conclusion, the choice depends on interest, time, and risk tolerance, but for those who find it difficult to concentrate their investments, Berkshire or ETFs are practical alternatives.
14) The Biggest Risks and ‘Who Could Be Wrong’?
Commodities and defense are highly cyclical, posing a significant risk of ‘getting caught at the peak.’Possibility of demand contraction due to policy changes or technological substitution (e.g., emergence of new materials).While Buffett’s acquisitions are strong signals, there is no guarantee that individual investors will achieve the same results.Always remember stop-loss rules and diversification.
15) Five ‘Practical Signals’ to Quickly Check (Recommend Setting Up Alerts)
Dollar Index turning downward within 3 months (signal of a weak dollar).Commodity futures index crossing above its 50-day and 200-day moving averages.US government budget or USD exchange rate policy changes announced.Additional disclosures regarding Japanese trading companies exceeding 10% (Buffett’s further purchases).Rapid escalation of geopolitical risks (increase in resolution or war probability).
< Summary >Buffett’s six-year cumulative acquisitions and exceeding 10% in some stocks signal ‘strategic conviction’ beyond simple purchases.Given the business structure of general trading companies, direct benefits are expected from rising commodity and inflation prices.The US government’s increased intervention in critical minerals and defense, along with the possibility of a weak dollar, act as long-term demand drivers for commodity and defense sectors.Responding to the US stock market in the second half hinges on incremental buying, diversification centered on ETFs, and establishing clear buy/sell triggers.Risks include cyclicality, policy changes, exchange rates, and being caught at the peak, making conservative positioning and risk management essential.
(Disclaimer: This article is for informational purposes only and does not constitute investment advice. We recommend making your own judgment and consulting with a professional before investing.)
[Related Articles…]Summary of Buffett’s Japanese Bets AnalysisSummary of Commodity Supercycle Outlook
*Source: [ 소수몽키 ]
– 버핏이 6년째 쓸어담고 있는 주식들, 장기 고물가 베팅 적중할까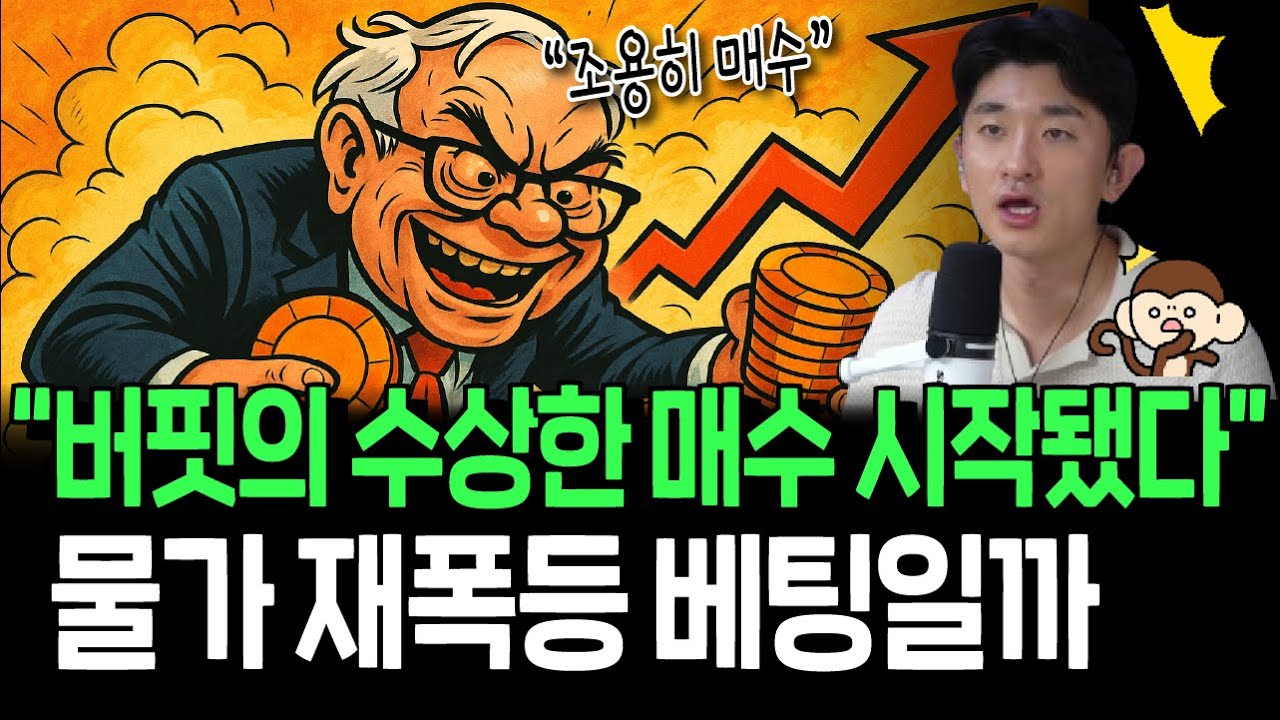
● Xi Jinping’s Victory Day-North Korea-Russia Alliance-AI Militarization-China Economy-Korea’s Choice
Victory Day 2025 — The True Meaning of the Grand Event Featuring North Korea, China, and Russia: Xi Jinping’s Militarization of AI, China’s Economic Response Scenarios, and South Korea’s Choices
Here are the most important points discussed in this article:
- The core message Xi Jinping will deliver at Victory Day and the political-economic repercussions of North Korea-China-Russia solidarity.
- The strategic significance of ‘AI-based unmanned weaponry’ and the civilian AI chip supply chain, likely to be revealed at Victory Day — this is a key analysis often overlooked by the news.
- The short-term impact of Victory Day on the Chinese economy, second-half growth scenarios, and government countermeasures.
- South Korea’s practical options (balancing the US alliance, economic ties with the US, and economic ties with China) and investment ideas (semiconductors, AI chips, defense, cloud, etc.) — actionable plans that can actually be utilized.
- Eight key indicators for monitoring markets and policies, along with short-term risk management strategies.
1. The Political Significance of Victory Day and Xi Jinping’s Grand Vision, Viewed Chronologically
Past (2015): The predecessor to Victory Day was a large-scale parade held every ten years, centered around National Day.It’s important to remember that the 2015 Victory Day served as a harbinger of ‘political display + military modernization’ under the Xi Jinping regime.
Present (Victory Day 2025): The gathering of the leaders of North Korea, China, and Russia is not merely ceremonial but a public declaration of strategic solidarity.
- Core Message 1 (External): An implicit warning against the international order centered on the US and the West, signaling ‘bloc formation.’
- Core Message 2 (Internal): An intention to reaffirm the national priority of combining technology and security within China.
2. The Most Crucial Analysis Not Widely Discussed Elsewhere — ‘AI Autonomy’ is Key
While news outlets primarily focus on the number of tanks and fighter jets, the true protagonists of this Victory Day are ‘AI-equipped unmanned platforms.’Xi Jinping is highly likely to use the military parade to visually showcase ‘decisive technological prowess.’This has two implications:
- First: The application of AI is not a simple performance upgrade but an ‘automation sweep’ that fundamentally transforms the structure of combat operations.
- Second: The fact that civilian companies (e.g., Alibaba) have begun producing their own AI chips and hardware signifies an acceleration of strategies for sanctions evasion and self-sufficiency.
In conclusion, the Victory Day event serves as a stage for ‘offensive technological signaling’ and a demonstration of the existence of a ‘civilian-state linked supply chain.’
3. Implications of Military and Technological Displays for the Market — Where Will the Money Flow?
Short-term: Investment sentiment is likely to surge in areas such as AI chips, edge computing, sensors, motors, and robots (related to unmanned platforms).Mid-term: The declaration of in-house AI chip production by civilian companies will trigger a demand shift towards foundries, equipment, and materials.Opportunities for South Korean Companies: Strategic demand may increase in areas such as semiconductor equipment and materials, semiconductor design collaboration, and the supply of military components and subsystems.Market Focus: ‘Hardware plays’ (chips, sensors, production equipment) are more likely to see greater benefits than ‘software plays.’
4. The Current State of the Chinese Economy (China Economy) and Possible Policy Responses After Victory Day
Current Situation: The first-half GDP surprise (5.2-5.4%) was largely due to the front-loading of exports.However, structural issues persist, including rising youth unemployment (from 14% to approximately 17%), a real estate downturn, and delayed consumption recovery.Short-term Outlook: The second-half growth rate is likely to slow to 4.7-4.8%.Policy Response 1 (Fiscal Expansion – Supplementary Budget): Measures to boost domestic demand, such as consumption vouchers, real estate stabilization policies, and local infrastructure investment.Policy Response 2 (Strategic Industry Support): Subsidies and bold R&D funding for AI, semiconductors, defense, and advanced manufacturing.What’s particularly important is the ‘strategic mobilization of private capital.’The AI chip production by major private companies like Alibaba demonstrates a new model where the government leverages private cash flow to supplement core sectors.
5. Geopolitical Repercussions: North Korea-China-Russia Solidarity and the Next Steps for the Korean Peninsula and the US
The gathering of North Korea, China, and Russia serves as a diplomatic message to the US.Foreign Media Perspective: North Korea-China consultations are interpreted as a signal of ‘prior coordination’ to trigger the resumption of North Korea-US dialogue.Practical Implications: From the perspective of the Trump administration, if China maintains and strengthens its relationship with North Korea, negotiation cards could become more complex.Regional Options: South Korea must further concretize its practical, balanced strategy of ‘balancing US alliance, economic ties with the US, and economic ties with China.’
6. Concrete Action Plans for South Korea (Investors, Policymakers)
Policy Level: Securing ‘flexibility’ in diplomacy, trade, and security is key.Diplomatic Proposal: Maintain comprehensive and pragmatic consultation channels with both China and the US, while strengthening risk diversification measures in strategic sectors (e.g., semiconductors).Economic/Corporate Level: Supply chain diversification and a re-evaluation of defense and AI export management systems are necessary.Investor Level: Review your portfolios with a focus on the following themes:
- AI chips, fab equipment, and materials (companies involved in supplementing domestic supply chains).
- Cloud, data centers, and edge computing (increasing cross-demand for military and civilian use).
- Industrial robots and unmanned platform subsystems (motors, sensors, control devices).
- Domestic production segments related to defense (establishing domestic supply sources considering security risks).
7. Eight Key Indicators for Monitoring Markets and Policies
- Whether the Chinese government announces a supplementary budget and its scale.
- ‘Technical details’ of equipment revealed at Victory Day (level of autonomy, AI chip markings, etc.).
- Announcements of AI chip and foundry investments by private companies like Alibaba and Baidu.
- The reversal phenomenon of ‘export front-loading’ in China’s import/export data (monthly figures).
- Quarterly changes in youth unemployment rates and consumer confidence indices.
- Specific agreements on economic and security cooperation between North Korea, China, and Russia (items on funding, infrastructure, military cooperation).
- Whether the US announces additional sanctions or export control policies against China.
- Notifications from the US regarding changes to exemptions or licenses for South Korean companies’ operations in China.
8. Risks and Worst-Case Scenarios
- Risk 1: Accelerated global supply chain restructuring due to increased geopolitical tensions following Victory Day.
- Risk 2: A slight increase in the probability of US-China conflict due to China’s display of military and technological prowess.
- Risk 3: The risk of China’s internal economic slowdown deepening more than expected, leading to a global growth slowdown.
9. ‘Practical Checklist’ from an Investment Perspective
- Check 1: Verify companies’ dependence on the Chinese market (revenue share).
- Check 2: Confirm whether alternative markets/customers exist and if plans for supply chain diversification are in place.
- Check 3: Thoroughly assess regulatory and export control risks in defense and advanced technology sectors.
- Check 4: For portfolios focused on AI hardware (chips/equipment), focus on medium to long-term structural demand.
10. Conclusion — Xi Jinping’s Grand Vision and the Attitude We Should Adopt
Xi Jinping’s Victory Day is more than just a parade; it’s an occasion to showcase both ‘political solidarity’ and ‘technological self-reliance.’China’s direction can be summarized by two axes: strategic alliance (North Korea-China-Russia) and technological self-sufficiency (civilian-state combined AI chip strategy).South Korea and investors should seize opportunities through ‘policy flexibility’ and ‘supply chain diversification,’ while carefully managing regulatory risks in defense and technology sectors.
< Summary >
Victory Day is a public display of North Korea-China-Russia solidarity and a stage revealing Xi Jinping’s ‘militarization of AI’ and his civilian-state linked technology self-sufficiency strategy.The Chinese economy shows performance that appears to be a bubble from the first-half export front-loading, along with the risk of a second-half slowdown (4.7-4.8%).The Chinese government is likely to defend against downside risks through measures boosting domestic demand, stabilizing real estate, and subsidizing advanced technologies.South Korea needs to maintain a practical balance of ‘US alliance, economic ties with the US, and economic ties with China’ while implementing strategic responses (diversification, strengthening domestic supply chains) in the semiconductor, AI chip, and defense sectors.
[Related Articles…]Victory Day and China’s Strategic Shift: The Economic Implications of North Korea-China-Russia SolidarityThe Impact of Xi Jinping’s AI Investment Strategy on the South Korean Economy
*Source: [ 경제 읽어주는 남자(김광석TV) ]
– ‘전승절’, 중국 10년만의 ‘대형 이벤트’. 북중러가 한자리에 모인다. 시진핑의 큰그림은? | 경읽남과 토론합시다 | 박수현 팀장 1편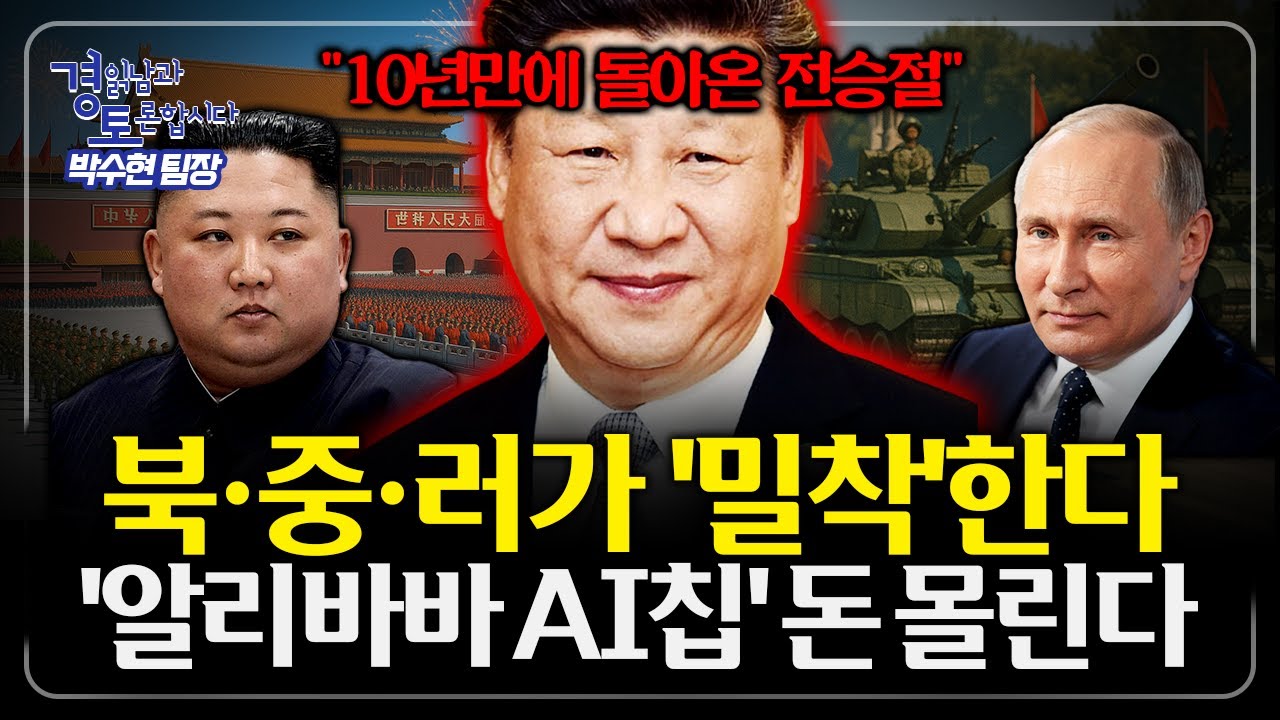
● Potential September Sell-off- Hidden Risks- 5050 Strategy- Exit Checklist
Here’s the translation of the provided text into English, maintaining the original formatting and adhering to your specific instructions:
A potential downturn that everyone anticipates may be coming — The core of this article: Real risk factors in the September market, the investment implications of historical seasonality, hidden risks that no one is talking about (psychological effects of tariffs, European welfare debt, US commercial real estate maturity wall), the mathematical and psychological basis of the practical 5-to-5 (cash:stock) strategy, and a checklist and triggers to collect without fail when the market turns down.
Recent (August-September) Market Situation Summary — Why ‘Sideways Movement During an Uptrend’ is Dangerous
In August, despite various positive factors, the stock market failed to rise further and moved sideways.Since September, a downtrend has become apparent, with accumulated weakness primarily in technology stocks.Markets tend to accumulate “fear” when they rise rapidly after breaking through all-time highs.A rapid rate of ascent has a high probability of triggering a short-term correction.The core mechanism is that many individual investors feel the urge to sell due to anxiety about whether the market has “risen too much.”
Market Mechanism — The Core (Combination of Psychology and Mathematics) That No One Easily Discusses
During an uptrend, negative factors are hard to see, while during a downtrend, negative factors reveal themselves in succession.Public sentiment rapidly shifts from “greed” to “fear,” at which point panic selling occurs.New buyers, often referred to as “suckers,” are more likely to enter at the peak and do not turn to buying when the trend reverses downwards.Mathematically, dollar-cost averaging and cash holding are advantageous for recovery, but psychologically, sentiment is a greater variable in practice.Therefore, what determines success in practice is positioning management that builds “psychological resilience.”
Seasonality (Yearly Flow) — Practical Clues from Historical Data
Statistically, since 1950, February, August, and September have been observed as relatively unfavorable months for the stock market.February, May, and November are linked to corporate earnings reports, and deteriorating earnings can easily lead to selling pressure.There is a psychological cycle where aggressive positioning is more favorable in the first half of the year, and defensive positioning is preferred in the second half.It is important that the seasonal psychology from the agricultural era still partially influences modern investor sentiment.
The Most Important Hidden Risks (Areas Not Sufficiently Covered by Many Media Outlets)
Tariffs (e.g., an effective tariff rate of 15%), while having a small macroeconomic inflationary effect, can trigger actual inflation by stimulating public expectations.”Psychological inflation” affects price and wage decisions of consumers and businesses, regardless of monetary policy or interest rates.Europe’s (especially France’s) welfare and debt issues are not merely fiscal risks but also sources of political instability.Welfare cuts can provoke social backlash and negatively impact long-term economic and financial stability.The concentration of maturities in US commercial real estate (offices) (over the next two years) could spill over into credit crunches during a downturn.These risks can create an “emotional cascade,” impacting the stock market, banking sector, the dollar, and interest rates simultaneously.
Practical Strategy (Chronological Order): How to Approach Right Now
Step 1 (Now): Prioritize securing cash reserves.Step 2 (Observation): Monitor various indicators to determine if the decline is a temporary adjustment or a trend reversal.Step 3 (Action): Once trend reversal signals are confirmed, enter with dollar-cost averaging during a “panic sell” phase.Step 4 (Management): During the recovery phase, take some profits and maintain exposure to long-term growth stocks.
The Mathematical and Psychological Design of the 5-to-5 Strategy — Why It Works in Reality
The 5-to-5 (50% cash, 50% stocks) structure enhances the execution of buying at lows during a downturn.Example figures: An initial portfolio of 1 million won has 500,000 won in stocks and 500,000 won in cash. If stocks halve (from 500,000 to 250,000 won), buying an additional 500,000 won worth with cash would bring the total stock value to 750,000 won.If the market recovers to its previous level, the portfolio will record a 50% profit at 1.5 million won.Psychologically, having cash creates the “desire to buy,” increasing the willingness to purchase at the lows and thus improving the possibility of recovering losses.A 100% stock position with no cash is highly likely to lead to panic selling as it cannot withstand a significant decline.
Practical Response Methods by Risk (Clearly Itemized)
Tariff/Inflation Concerns: Short-term, avoid companies with high exposure to consumer goods or reliance on imports.European Political/Welfare Risks: Carefully observe guidance warnings from companies with significant European revenue.US Commercial Real Estate: Monitor the results of stress tests for financial institutions and regional banks with high exposure to bank loans.Interest Rate Risk: Adjust positions based on the communication and hawkish/dovish signals from central banks (US/Europe).
Market Monitoring Indicators (Triggers and Warning Signals)
Price Triggers: Check the status of major indices (US, KOSPI, NASDAQ) breaking below their 50-day and 200-day moving averages.Liquidity Triggers: A sharp rise in money market rates, or an expansion of repo and Treasury spreads, are warnings.Credit Triggers: A sharp increase in bank CDS spreads or corporate bond spreads is a precursor to a credit crunch.Sentiment Triggers: Rapid changes in trading volume and margin balances (individual and institutional) are early signs of panic.
Strategy-Specific Positioning Examples — Aggressive, Neutral, Defensive
Aggressive: 20% cash, 80% stocks (upon confirmation of macro and interest rate stability), increased exposure to growth and tech (US-centric).Neutral: 50/50 (as explained above), maintain exposure to dividend and quality stocks, with a small holding of defensive sectors.Defensive: 70% cash, 30% stocks, increased exposure to safe-haven assets like consumer staples, healthcare, and precious metals (gold).
Portfolio Checklist — 7 Actions to Take Immediately When the Market Turns Down
1) Check your cash liquidity ratio.2) Immediately reduce exposure to leverage (loans, derivatives).3) Re-examine sector-specific revenue exposure (Europe, US, emerging markets).4) Reduce holdings in companies that have lowered earnings guidance in advance.5) Limit exposure to financial stocks with high exposure to banks, insurance, and commercial real estate.6) When inflation expectations are spreading, slightly increase exposure to real assets (like gold).7) Pre-document your phased buy/sell plan (price and volume triggers).
Additional Tips for Investors (Checkpoints to Use Immediately in Practice)
Have the patience to wait for the right price rather than buying a good company immediately on the day you “discover” it.Even if a downturn occurs, do not invest your entire assets; always keep some portion of easily “bought and sold” assets.Have many pieces of information but act selectively — that is, make major decisions only when signals are confirmed.Maintain the long-term assumption that the dominance of US-centric finance and tech will not easily disappear, but rigorously manage short-term risks.
< Summary >
The August sideways movement and September weakness are typical signs of psychological overheating cooling down.The accumulation of fear at the upper end of an uptrend is highly likely to lead to a rapid correction.The hidden risks to watch most closely are the “psychological inflation” of tariffs, Europe’s welfare and debt issues, and the maturity wall of US commercial real estate.In practice, the 5-to-5 (cash:stocks) strategy is mathematically and psychologically valid.Define specific triggers (price, liquidity, credit, sentiment) and execute them in phases.
[Related Articles…]
Summary of the Impact of Dollar Strength and Interest Rate Outlook on the Stock Market
*Source: [ Jun’s economy lab ]
– 모두가 예상하는 하락장이 올 수도 있습니다