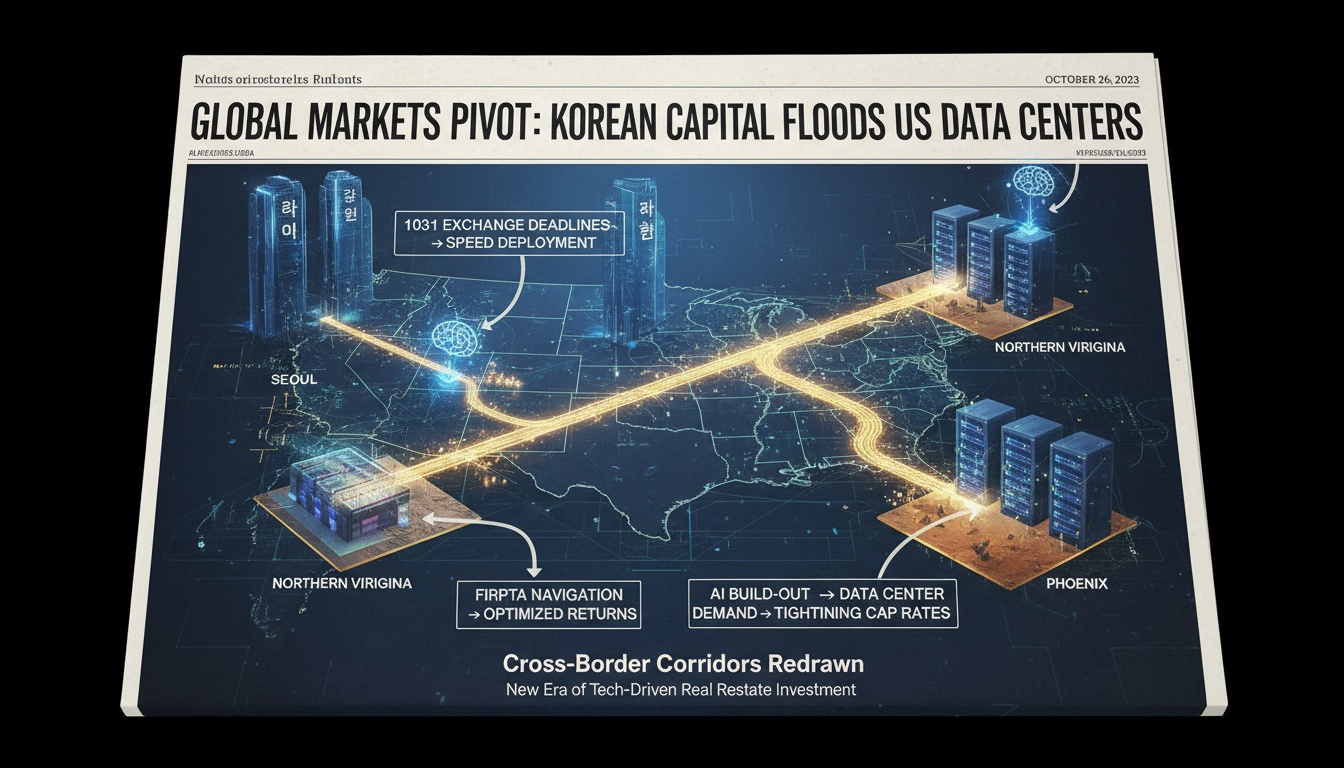
● Korean Money Rushes into US Housing – Tax Havens, AI Goldrush
Why Are Korean Asset Owners Moving to US Real Estate Now: A 2025-2026 Strategy Covering Taxes, Regulations, Interest Rates, AI, and Manufacturing Reshoring
We get straight to the point from the start.
This article covers the turning point of the interest rate cycle in 2026, the US housing demand map created by AI and manufacturing reshoring, a state-by-state checklist for tax saving/regulations (1031, FIRPTA, property tax), portfolio recipes for different types of investors, and practical golden points rarely covered by other YouTube channels or news—such as the rental demand around data centers, defense, and eco-friendly manufacturing clusters.
It combines economic forecasts with global asset trends, allowing you to understand both the Korean and US real estate markets at a glance.
If you’re contemplating how to allocate your dollar assets, you’ll want to read until the end.
When the interest rate cut comes, consider “when,” “where,” and “what” to buy; the briefing begins.
News at a Glance: What’s Happening Now
- Korea: With increased burdens from regulations and holding/transfer taxes, multi-home strategies are virtually blocked, and the absolute prices of Seoul apartments remain high, raising the barriers for new entrants.
- United States: With stable tax and system regulations, diverse options, and a preference for rental income (in dollars), the migration of asset owners and high-earning professionals is accelerating.
- Macro: With expectations for an interest rate cut around 2026 and a forecast of large-scale FDI (factory construction) in the US, regional housing demand is being stimulated.
- Market Conclusion: While the overall US average growth rate shows a gradual trend of 1-3%, there are stark contrasts by state and city. Some areas in Texas and the Sun Belt are in a recovery phase after a correction, California, Boston, and Manhattan maintain characteristics of low yields with high capital gains, and Hawaii offers strong cycle resilience.
- Investment Practice: Entry is possible from around KRW 300 million (depending on region and type). The barriers have been lowered through systematic approaches such as management, tax, loans, corporate (LLC), and 1031 exchanges.
Why Do Korean Asset Owners Choose US Real Estate?
- Taxes/Systems
- 1031 Exchange: Selling Asset A and buying Asset B defers capital gains taxes (subject to certain conditions and deadlines).
- Absence of Acquisition Tax (in the US, the acquisition tax aspect is minimal). However, closing costs occur.
- Multi-home favoring structure (possibilities for tax use through depreciation, interest, and expense deductions).
- Diverse Options
- From single-family residences (SFR) in the $300,000 range to prime condos, there is a wide range of choices by region and income model.
- Options include rental income-focused (cap rate), capital gains-focused, and hybrid models.
- Stability
- Predictability of lease, loan, and tax systems (varies by state).
- Securing monthly cash flow in dollars through rental income also offers a natural hedge against currency fluctuations.
2025-2026 Macro Points: How Interest Rates, FDI, and AI Are Shaping the Demand Map
- Expectation of an Interest Rate Cut
- Possibility of changes in the Federal Reserve’s leadership and policy stance around 2026.
- When mortgage rates decline, latent demand and transaction recovery could lead to simultaneous improvements in prices and rentals.
- Supply Lock-In (Supply Constraints)
- Homeowners with fixed-rate low-interest loans from the pandemic are less likely to switch, causing a shortage in existing home listings.
- New construction remains constrained by rising financial costs, material costs, permitting, and insurance expenses.
- Reshoring/FDI
- There is increased “live-work proximity” rental demand in regions where factories for semiconductors, batteries, EVs, defense, and cleantech are being constructed.
- Potential candidates: Georgia (Hyundai, battery), Texas (semiconductor, data center), Arizona (semiconductor), Ohio (semiconductor), Tennessee/Alabama (EV), Oklahoma/Carolina (manufacturing/logistics).
- AI Trend
- Massive demand for data centers (power, fiber cable, land) brings along residential demand and employment in nearby life services.
- “AI co-leaders” to watch include Phoenix, Dallas-Fort Worth, Columbus, Atlanta, Northern Virginia, and Salt Lake.
Regional Strategy Map: Recommendations by Income Model
- California (Orange County, Silicon Valley, LA Westside)
- Characteristics: Low rental yield, solid capital gains, and premium education/lifestyle.
- Suitable for: Investors who prefer capital gains over cash flow and can hold long-term.
- Texas (Austin, Dallas, Houston, Tyler)
- Characteristics: Overheated → Correction → Selective recovery. Driven by demand from data centers, semiconductors, and energy.
- Suitable for: Hybrid investors aiming for beta at the early stage of recovery.
- Georgia (Atlanta/Suburban belts)
- Characteristics: A hub for manufacturing investment and logistics, with favorable rental yields (driven by middle-class rental demand).
- Suitable for: Those who prioritize dollar rental cash flow, aiming for a 5-7 year holding strategy.
- New York (Manhattan, Brooklyn)
- Characteristics: Long-term stable capital value with essential checks on rental regulations and cost structure.
- Suitable for: Inclusion in global prime assets, combined with education and career-focused demand.
- Chicago (Illinois)
- Characteristics: Relatively high rental yield, with attention needed for tax and policy risks.
- Suitable for: Investors preferring stable cap rates and capable of systematic management.
- Boston/New Jersey
- Characteristics: Educational districts and hubs for biotech/education provide steady medium-to-long-term demand.
- Suitable for: Those pursuing a hybrid of education and capital gains.
- Hawaii
- Characteristics: Cycle resilience, gradual rise, and diversified demand through rental and tourism.
- Suitable for: Investors aiming to reduce volatility and defend their dollar assets.
Portfolio Recipe by Investor Type
- Retirement/Cash Flow Focused
- Objective: To secure reliable monthly cash flow in dollars.
- Properties: Mid-priced SFRs, 2-4 unit multi-family properties in areas with low HOA fees and excellent access to schools, hospitals, and shopping.
- Investors in Their 30s and 40s/Growth Focused
- Objective: A hybrid of capital gains and reasonable rental yields.
- Properties: New SFRs or townhomes in the recovery zones of the Sun Belt and near data centers/FDI belts.
- Education-Oriented
- Objective: Combining residence and education, balancing costs.
- Properties: Condos or co-ops within 20-30 minutes of campuses (with checks on regulations and rental policies), with room rentals supplementing some cash flow.
- Note: In-state public universities have diverse requirements by state regarding residency, tax filing, and visa status. Owning the property alone is insufficient in many states; verification is essential beforehand.
- Tax Optimization Focused
- Objective: Managing taxable income through depreciation, 1031 exchanges, and expense deductions.
- Properties: Assets with a high building-to-land ratio in markets suitable for long-term holding.
Tax, System, and Loan Checklist (Key Points)
- 1031 Exchange: Must exchange between like-kind properties and adhere to deadlines and procedures.
- FIRPTA Withholding: When a foreigner sells a property, a portion of the sales proceeds is withheld and later reconciled through tax filings.
- Property Tax: Varies by state from around 0.3% (Hawaii) to over 2% (Texas, etc.).
- Closing Costs: Include title, escrow, inspection, and loan fees, typically 1-3% or more.
- Loans
- LTV, interest rates, and DSCR criteria for foreigners vary; obtaining a pre-approval is essential.
- There are many cases using cash flow loans (DSCR), ITIN, and LLC structures.
- Rental Management
- Typically, communication between tenants and landlords is handled through management or brokers rather than directly.
- Services are segmented (tenant screening, repairs, key management, insurance, tenant portals).
Risks and Mitigation Strategies
- Exchange Rate: Use staggered purchases and hedging (with natural hedges through monthly dollar cash flows); avoid expecting excessive currency gains.
- Policy: With tightening Airbnb regulations spreading, pre-check the short-term rental rules in the relevant city.
- Insurance/Climate: Check for issues in high-risk coastal/disaster areas, such as surging insurance premiums and coverage limitations.
- Rental Laws: Areas with rent controls or backlog in eviction lawsuits may have risks of vacancies and recovery issues.
- Taxes: The complex structure of state, city, and county taxes necessitates coordination with a CPA.
- Vacancy: Minimize vacancy risk by choosing areas with concentrated employment, transportation hubs, and strong school districts.
When to Buy: Timing Guide
- With a holding period of 5-7 years or more, gradually enter the market with properties that have “good locations + reasonable prices.”
- In a buyer’s market in a corrected Sun Belt area, negotiate favorable terms (price, credits, repairs).
- As rates decline and transactions recover, consider a strategy of buying first and refinancing later.
Local Operation: How to Manage
- Team Composition: Buyer agent, lender, title/escrow officer, local attorney (by state), tax advisor, and property manager.
- Management: Monthly reports, annual 1099/tax packages, and reserve fund management.
- Costs: Management fees (a certain percentage of the monthly rental), budgeting for repairs, insurance, HOA fees, and taxes.
Practical Steps (Roadmap Starting from Around KRW 300 Million)
- Define your objectives/budget → Conduct initial regional screening (assessing employment, population, vacancy, insurance) → Set up your team.
- Establish LLC/ITIN/accounts → Obtain pre-approval for a loan → Select properties (checking rental and regulatory factors).
- Make an offer/inspection/renegotiate terms on price/credits/repairs → Proceed with escrow and closing.
- Screen tenants/move-in → Collect monthly rent/report → Plan for taxes/1031 exchange.
A ‘Most Important’ Point Not Covered by Other YouTube Channels/News
- Proximity rentals adjacent to AI, data centers, defense, and cleantech clusters will be the key beta of the next cycle. Due to restrictions on power, fiber routes, and land regulations, data centers are limited in relocation, and job growth directly translates into stable rental demand for surrounding mid-market housing (built-to-rent, townhomes, 2-4 unit properties).
- The hidden bottleneck in new supply is “insurance/infrastructure capacity.” Road, substation, water/sewer, and fire coverage requirements serve as stronger speed controls than building permits. This constraint will support existing home premiums in the medium to long term.
- A rental demand corridor is forming between community college/technician school belts and FDI factories. Semester-based demand and shift work rentals combine to lower vacancy rates.
- Instead of focusing solely on SFRs, mix in 20-30% managed micromultifamily properties (duplexes, triplexes, popplexes) to spread out vacancy and repair risks while optimizing depreciation.
- Check these five data points: county vacancy rates, rental growth rates, trends in insurance premiums, eviction lawsuit processing times, and power grid expansion plans. These indicators will determine the sustainability of a “healthy cap rate.”
Frequently Asked Questions (Brief)
- Does the visa issue affect investments?
- The acquisition of real estate is not related to visas. Residency/employment is a separate matter. However, regulations can change, so keep checking.
- Is it possible with KRW 300 million?
- It is entirely possible depending on the region and loan conditions. Design your strategy based on your preferred local areas.
- Is an LLC absolutely necessary?
- While LLCs are common for limiting liability, succession, and tax planning, it is recommended to consult with a tax advisor on a case-by-case basis.
- For education-oriented purchases, what about in-state tuition?
- Each state has strict requirements regarding residency, tax filing, and visa status; owning a property alone is not recognized in many states. Verification beforehand is essential.
Conclusion: If You Add US Properties to Your Portfolio, Do It This Way
- First, set your objectives and holding period, then narrow down the regions based on demand centers for AI, manufacturing, and logistics.
- For a 5-7 year holding period, a hybrid model (rental yield of 4-6% + capital gains of 3-6%) is the fundamental base.
- Around the time of the interest rate cut, consider a buy-first-refinance-later strategy and compound gains with a 1031 exchange.
- Manage risks through insurance, policies, exchange rates, and rental laws, and systematize management, tax, and loans with a dedicated team.
- The key is “location and demand quality.” Build your dollar cash flow by focusing on areas where AI, FDI, education, healthcare, and logistics converge.
< Summary >
- Korean regulatory and tax burdens versus the stability, options, and favorable taxation of the US are accelerating asset migration.
- With interest rate cuts, reshoring, and AI data centers expected around 2026, US housing demand is strengthening.
- Income models vary by region: capital gains in California, a hybrid approach in the Sun Belt, and defensive strategies in Hawaii.
- Success hinges on checking state-by-state systems such as 1031, FIRPTA, property tax, insurance, and rental laws.
- Entry is possible from around KRW 300 million; increase your chances of success with a 5-7 year holding strategy, team operations, and diligent data checks.
[Related Articles…]
- Diversifying Dollar Assets and the 2026 Interest Rate Cycle: A Guide to Resetting Your Overseas Portfolio
- How the AI Data Center Boom Is Changing the US Housing Demand Map
*Source: [ 경제 읽어주는 남자(김광석TV) ]
– [풀버전] 부동산 투자자들이 한국을 떠난다. 미국으로 갈아타는 자산가들, 한국은 규제, 미국은 절세 | 경읽남과 토론합시다 | @komiyountv 고미연 대표
● Foreign Frenzy, AI Chip Mania, Power Crunch
KOSPI At Peak: Why Foreigners Went All-in on “AI Semiconductors” and the Practical Entry and Risk Checkpoints We Must Secure Now
This article contains everything from the true flow of net purchases by foreigners, the key variables of the AI semiconductor cycle, practical approaches to ETFs and individual stock investments, to the risks and opportunities that are rarely covered in the news.
It summarizes in one go the impact on the KOSPI from the direction of the global economy, interest rates, inflation, and positioning strategies.
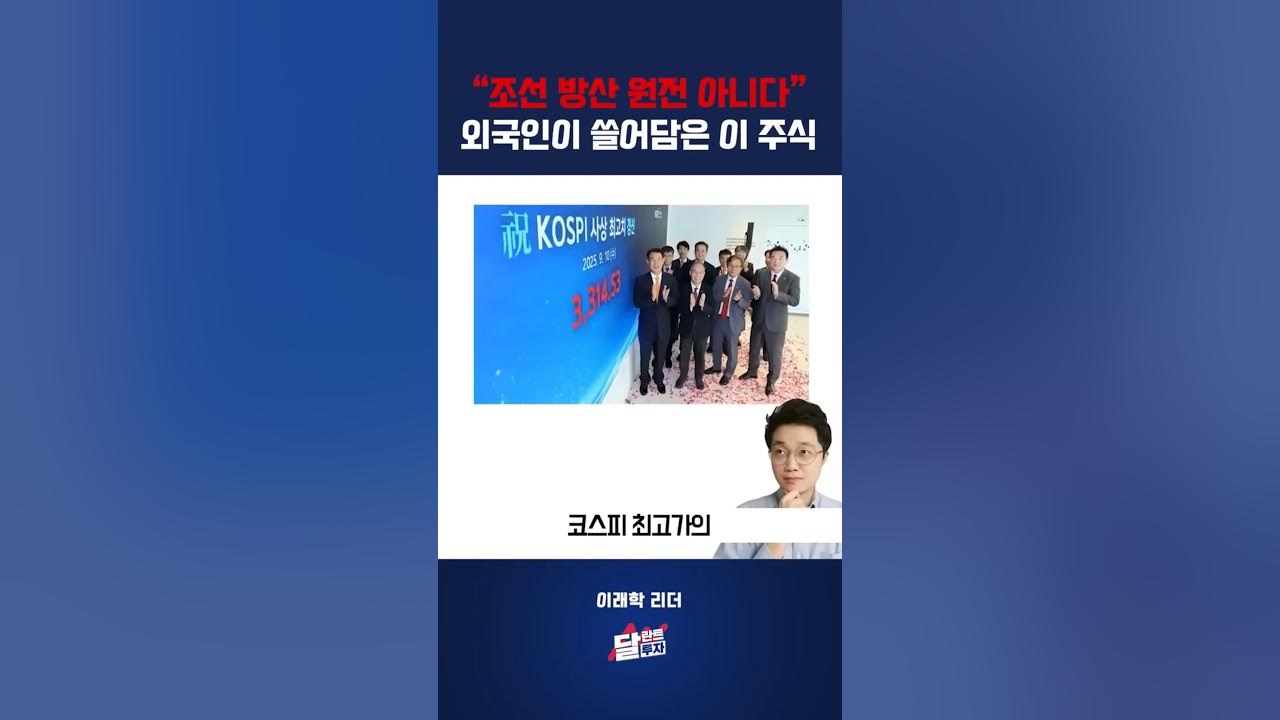
Headline Briefing: Foreigners Poured Up to 70% into “Semiconductors” at KOSPI’s High Levels
Recently, the focus of foreigners’ net buying shifted from shipbuilding, defense, and nuclear power to semiconductors.
About 70% of foreigners’ net purchases in the KOSPI were concentrated in semiconductors, playing a key role in pushing the index to its highest levels.
If selecting individual stocks is challenging, a basket approach using domestically listed AI semiconductor ETFs emerges as an alternative.
The leading ETFs hold around 50% of their top assets in Samsung Electronics and SK Hynix, with the remainder comprising materials, parts, equipment, and other AI semiconductor-related small components.
The key factors are the AI server investment cycle, memory prices, and the trends in exchange rates and interest rates.
Why “AI Semiconductors” Now: Structural Changes in the Cycle and Demand
AI infrastructure investments are expanding across servers, GPUs, memory (HBM and DDR5), and packaging, serving as a driving force for the semiconductor industry’s performance.
Memory is demanded in both AI learning and inference for bandwidth and capacity, leading to a rapid increase in HBM adoption.
HBM features high prices and margins, and its yield and packaging capabilities act as barriers to entry, resulting in profits being concentrated among top companies.
Server DRAM is expected to witness a recovery in bit growth along with the transition to DDR5, suggesting a potential improvement phase in the cycle.
Packaging, substrates, and advanced process equipment may continue to command premiums until any bottlenecks are resolved.
Practical Strategy for ETF Approaches: Diversifying Volatility and Monitoring Rebalancing
Domestic AI semiconductor ETFs are composed of the two major memory stocks and leaders in small components, offering both thematic exposure and diversification benefits.
Verifying staggered buying and regular rebalancing schedules is essential.
Regularly monitor changes in constituent weights, newly added or removed stocks, tracking errors, fees, and liquidity (trading volume).
During intensified phases of AI semiconductors, the proportion of materials, parts, and equipment could gradually increase, making it important to pay attention to changes in ETF composition.
Given the high sensitivity to exchange rates, additional buying during periods of a strong won and staggered entry during periods of a weak won may be effective.
Individual Stock Approach Points: What Key Figures to Monitor
The trends in the average selling prices (ASP) of HBM and DDR5, server shipment forecasts, and customer CAPEX guidance are the top indicators to track.
HBM yield, the pace of next-generation process transitions, and the operational rates of advanced packaging (such as CoWoS) are key elements of profit leverage.
For materials, parts, and equipment, track expansion lead times, bottlenecks in deposition, etching, and photolithography, as well as plans for ABF substrate capacity expansion.
Exchange rates, pricing spreads, and improvements in product mix will determine sensitivity to performance.
Qualitative changes in the AI server CAPEX of end customers (hyperscalers and cloud providers) directly impact stock selection.
Risk Checklist: How to Avoid Major Losses When Timing is Off
A rebound in interest rates or a resurgence of inflation puts pressure on growth stock multiples.
A strong dollar combined with a weak won can alter the pace of foreign capital inflows and outflows.
A slowdown in AI demand, bottlenecks in data center power and space, and delays in equipment lead times could lead to performance lag.
Changes in technology regulations and export controls can disrupt the regional demand mix, so it is important to check on revenue diversification.
Intensified competition in HBM or over-expansion in capacity may undermine the cycle beyond 2026, so CAPEX signals must be closely monitored.
Gathering the “Real” Variables That Are Rarely Discussed Elsewhere
Power and cooling are the bottlenecks.
If data center power capacity and cooling efficiency do not keep pace, the ramp-up of AI servers will be delayed, directly affecting the operational rates of HBM and packaging.
The supply of advanced packaging substrates and process engineers remains tight.
The pace of substrate capacity expansion and the training of skilled personnel could determine the ceiling for performance leverage over the next 12 to 24 months.
Improvements in AI inference efficiency are a variable.
Software optimizations such as pruning, quantization, and KV caching, along with innovations in NPU and memory architecture, could reduce HBM demand per model.
Diversion of demand from the Chinese region and gray markets can amplify quarterly demand volatility.
Note the lag effect where actual shipments reflect demand only belatedly as demand becomes visible more conservatively.
If power rates and ESG costs increase server total cost of ownership, the CAPEX mix of hyperscalers could change, necessitating attention to budget competition with networking and power equipment.
Macro Connections: Signals to the Global Economy, Interest Rates, Inflation, and the KOSPI
Concerns over global economic slowdown and the path of interest rates shake both valuations and exchange rates simultaneously.
If inflation stabilizes, the discount on growth stocks will narrow, and the increased share of semiconductors in the KOSPI will be favorable.
Conversely, a rebound in prices and rising long-term interest rates can constrain valuation re-rating.
A strong won helps sustain the trend of foreign buying, while a weak won increases pressure for profit-taking.
Ultimately, alpha increases when the fundamentals of AI semiconductors and macro timing align.
Execution Plan in 30 Seconds: Immediate Actions
Prioritize checking staggered buying, rebalancing schedules, tracking errors, fees, and ensuring sufficient trading volume for ETFs.
Follow up on individual stocks by tracking the numbers for HBM ASP and yield, server CAPEX, packaging operational rates, and exchange rate sensitivity.
For risk management, document stop-loss and rebalancing criteria in advance, and reduce position sizes before and after major events.
Setting calendar alerts for exchange rate notifications, memory price indicators, and key client earnings and CAPEX schedules can facilitate a systematic response.
Timeline Perspective: Mid-Term Roadmap and Scenarios
In the short term, earnings seasons and server CAPEX guidance will determine the direction.
In the mid-term, HBM capacity expansion, the resolution of packaging bottlenecks, and the cycle of new GPU launches will balance supply and demand.
Over the long term, the popularization of AI inference, the expansion of on-premises solutions, and the pace of regional power infrastructure enhancements will serve as the carriers for industry performance.
An upward scenario involves a re-acceleration of AI server demand and a strong won, while a downward scenario includes reaffirmation of rising interest rates and exacerbated bottlenecks in power and equipment.
Data-Driven Checkpoints
Pay close attention to the memory price index and contract price trends, server shipment volumes, and the QoQ changes in hyperscaler CAPEX guidance.
The exchange rate (USD/KRW), weekly net purchases by foreigners, and ETF capital inflows/outflows provide hints for technical trading.
News on lead times for materials, parts, and equipment and packaging operational rates serve as leading signals for profit volatility.
< Summary >
Foreigners’ net purchases were almost 70% concentrated in semiconductors in the upper ranges of the KOSPI.
AI semiconductors are underpinned by fundamentals such as HBM and packaging bottlenecks, as well as server CAPEX.
ETFs should be approached using a basket of large memory stocks and small component leaders, with staggered buying and rebalancing checks being key.
Simplify your metrics to tracking HBM ASP and yield, customer CAPEX, and exchange rate sensitivity.
The real variables are the ripple effects of power and cooling bottlenecks, the supply of packaging substrates and manpower, and improvements in AI inference efficiency.
From a macro perspective, the global economy, interest rates, inflation, and exchange rates dictate valuations and capital flows.
[Related Articles…]
5 Reasons Why Foreigners Focused Their Buying on “AI Semiconductors” at the KOSPI’s Peak
Tracking HBM & Foundry Supply: The Key Variable in the 2025 Memory Cycle
*Source: [ 달란트투자 ]
– “조선, 방산, 원전 아니다” 코스피 최고가에 외국인이 쓸어담은 ‘이 주식’ #주식 #코스피