● AI Supercycle Rages On, Power Crunch Sparks Tech Gold Rush
AI Supercycle, It’s Not the End|A Practical Guide to Riding the Wave with ACE US AI Tech Core Industries Active ETF
This article details exactly where the AI cycle currently stands, the grounds for refuting bubble controversies with performance and data, where the next profit point is shifting, and how to automatically adjust allocations from infrastructure to software with one active ETF.
It also separately summarizes key variables that other channels rarely cover, such as power infrastructure bottlenecks, the price elasticity resulting from falling inference costs, and the turning point in networking upgrades.
It is neatly organized in a news format that allows you to understand the global economic context, US stock market trends, and interest rate outlook all at once.
[News Summary] Why AI Investment Is Still “Ongoing”
OpenAI and NVIDIA have the largest number of cooperation and investment deals at the ecosystem’s core, with Oracle, CoreWeave, Broadcom, and other cloud, semiconductor, and networking companies joining in succession.
The essence of AI investment is the competition to preempt AGI, and because of the scaling laws and a winner-takes-all structure, the risk of not investing is even greater.
The current cycle is in the multi-modal “inference phase” among the three stages of learning, inference, and service, progressing from images to video, while on-device AI and agents are just in the early stages of commercialization.
Unlike the dot-com bubble, core stocks like NVIDIA are experiencing simultaneous rises in both stock prices and EPS, and AI CAPEX is increasing the contribution to US real GDP, with more than half of US market gains driven by performance.
The sectors have rotated from semiconductors to power infrastructure to AI software and hardware, and adjusting weights according to the phase is critical to success.
The ACE US AI Tech Core Industries Active ETF is based on 40% infrastructure and 60% utilization, automatically reflecting sector changes through active rebalancing.
Reasons for AI Investment|Preempting AGI, Scaling, Winner-Takes-All
Those who achieve AGI first will set the ecosystem standard while strengthening data, developer, and customer lock-in.
Due to scaling laws, performance improves exponentially as computing investment increases, ensuring that CAPEX in GPUs, memory, networking, and power remains relentless.
AI follows a winner-takes-all or winner-takes-most structure, so one to three key platforms are likely to capture most of the profits.
As noted by executives from Google and Meta, the risk of underinvestment outweighs that of overinvestment.
Cycle Positioning|We Are in the Mid-to-Late Stage of ‘Multi-modal Inference’
The transition from text-centric approaches to multi-modal inference involving images, voice, and video is now in full swing.
While short-form video creation has become widespread, production on the scale of feature films and dramas, as well as large-scale commercial adoption, is still in its early stages.
On-device AI and AI agents are currently in the prototype phase with some pilot projects underway, making it reasonable to expect full revenue commercialization in the next phase.
Compared to the internet (about 5 years) and mobile (about 7–8 years) revolutions, AI, which began in late 2022, is in its third year; infrastructure and inference may peak around 2027–2028, with hardware and service expansion taking even longer.
As a pillar of the fourth industrial revolution, AI is likely to have a longer lifespan than past cycles due to its broad impact across industries.
Bubble or Performance|Differences from the Dot-Com Era
During the dot-com era, Cisco’s stock soared while its EPS lagged behind, but now core stocks like NVIDIA are experiencing synchronous growth in both EPS and stock prices.
AI CAPEX is enhancing the growth contribution to US real GDP and establishing a performance-based foundation for the strength of the US stock market.
Across the global economy, AI investment has become central to discussions on capital expenditure and productivity, with the US market benefiting more from profit contributions than from value expansion.
Although bubbles have appeared repeatedly, trends in performance and CAPEX data are pointing to a ‘healthy ascent.’
Next Profit Points|Dual Tracks of Infrastructure and Utilization
Computing Infrastructure: Demand for advanced packaging such as GPUs, HBM, CoWoS, 800G/1.6T Ethernet, InfiniBand, and optical modules is set to expand structurally.
Energy Infrastructure: With a surge in power demand for data centers, there will be a significant restructuring in power transmission, distribution, transformers, switchgear, cooling systems, and the mix of gas, nuclear, and renewable energy.
AI Software: Direct billing for vertical AIs in sectors like enterprise LLM, security, copilot, and RAG, as well as productivity share models, will spread in fields such as healthcare, legal, and manufacturing.
AI Hardware: Humanoids, mobility solutions, and AI devices will require both technological validation and unit cost reductions before revenue growth follows.
As inference costs decrease, usage tends to grow inelastically, so improvements in software ARR and infrastructure utilization will occur simultaneously.
Structural Framework|Viewing Infrastructure vs. Utilization Through a 2×2 Lens
Infrastructure (40%): 20% in computing infrastructure (semiconductors, cloud, networking), and 20% in energy infrastructure (power grids, nuclear, cooling, power devices).
Utilization (60%): 45% in AI software (enterprise AI, vertical AI), and 15% in AI hardware (robots, autonomous driving, UAM, AI devices).
The ACE US AI Tech Core Industries Active ETF actively adjusts the weights of these four pillars, rebalancing to reflect sector rotations and news flows.
Scheduled to list on 10/28, its initial target weights are based on the aforementioned composition, though actual operational weights will vary according to market momentum.
For those who find trading individual sectors challenging, this one-basket approach that captures the core chain of AI investment is an effective strategy.
[Key Points Rarely Revealed Elsewhere]
Power and location bottlenecks are truly critical variables.
Large-scale data centers may experience years of delays in interconnection permits, impacting the lead times for transmission, transformers, and cooling systems, which in turn guide performance forecasts.
PPA (Power Purchase Agreements), small modular reactors (SMR), and a hybrid strategy that combines renewable energy with gas are emerging as key investment points.
A networking turning point is imminent.
As AI clusters scale up, the adoption of 800G Ethernet, 1.6T upgrades, and active optical cables will accelerate.
Benefits could extend not only to semiconductors but also vertically to optics, switching, and cables.
The economics of inference will hinge on the cost per 1,000 tokens.
As inference becomes cheaper and faster, user and API calls will skyrocket, allowing software revenues to offset reduced per-unit costs through exponential usage increases.
For enterprises, data and workflows serve as the ‘moat’ more so than the models themselves.
RAG combined with in-house data governance, integrated security and compliance, and the adoption of service-based pricing and productivity sharing will solidify revenue models.
The key to on-device AI lies more in memory bandwidth and power budgets than in NPU performance.
The proliferation of lightweight models, compression techniques, and on-device-RAG hybrids will accelerate their adoption.
Risks and Checklist
Supply constraints on essential components such as HBM and CoWoS can amplify cycle volatility.
Export controls and regulatory changes are potential risk factors for sales in specific regions.
If the interest rate outlook shifts, there may be increased pressure on valuation multiples, making it vital to focus on components with high performance visibility.
Rising power costs, water usage, and carbon regulations could impact data center OPEX, giving an edge to companies with high-efficiency cooling and effective energy mix strategies.
As model standardization accelerates, domain specialization, as well as deployment and integration capabilities in software, become crucial.
ETF Utilization Tips|Two Operational Scenarios
Core Position: Use the ACE US AI Tech Core Industries Active ETF to broadly capture the value chain from infrastructure to utilization, with active rebalancing as the fundamental mechanism.
Satellite Position: When a high-conviction sector emerges, overlay with individual sector ETFs or stocks to pursue additional alpha.
Mitigate cycle volatility through staggered purchases and regular contributions, and fine-tune allocations based on rebalancing results immediately after quarterly earnings seasons.
It is recommended to prioritize routines that check performance, CAPEX, expansion, and power permit data over “bubble news.”
Why It Remains Valid|A Timeline Perspective
Although AI is in its third year, there is still much to be done regarding enhanced inference, broader service adoption, and hardware deployment.
Compared to past internet and mobile revolutions, the scope of influence and infrastructure demands in AI are far greater, suggesting a potentially longer lifespan.
In the current phase, where the US stock market is driven by performance, the simultaneous growth of infrastructure and software remains very much an ongoing story.
Approaching AI investment strategies through diversification and rebalancing while linking them to the global economy and interest rate outlook is a rational approach.
Product Highlights|ACE US AI Tech Core Industries Active
Listing Date: Scheduled for 10/28.
Strategy: Based on a fundamental framework of 40% infrastructure (20% computing and 20% energy) and 60% utilization (45% AI software and 15% AI hardware), with active rebalancing.
Significance: It reduces the inefficiency of “department store-style diversification” by agilely reflecting sector rotations, capturing the core chain in a single basket approach.
Note: The actual composition and weights may vary with market momentum, so please check the latest configuration on the operator’s page.
This article does not constitute a recommendation to buy or sell any specific stocks, and investment decisions and responsibilities remain solely with the investor.
Keyword Memo
Global economy, US stock market, interest rate outlook, AI investment, Fourth Industrial Revolution.
< Summary >
AI is in the mid-stage of multi-modal inference, with performance-driven expansion clearly outweighing any bubble concerns.
The next profit points lie in the simultaneous growth of computing and power infrastructures alongside enterprise and vertical software.
The ACE US AI Tech Core Industries Active ETF follows a 40% infrastructure and 60% utilization framework, automatically reflecting sector rotations.
Key turning points include power and networking bottlenecks, the decline in inference costs, and enterprise data moats.
Consider both interest rate outlook and performance visibility while approaching with diversified and rebalancing strategies.
[Related Posts…]
US Data Center Power Crisis Creates a Turning Point for AI Investment
HBM Supply Chain Opens the Winner’s Landscape of the Next Semiconductor Cycle
*Source: [ 소수몽키 ]
– AI투자 고점 두려워할 때가 아니다? AI슈퍼사이클 한방에 올라타는 법
● Stablecoin Dollar Pipeline, Bonds Melt, Bitcoin and Ethereum Surge
“The liquidity party is coming to an end, and the value of money is melting away” – The next scenario transitioning from dollar supremacy to coins
This article precisely covers three points.
- The closed loop of stablecoins–US Treasury bills–liquidity, that is, the actual operating mechanism of the global dollar pipeline.
- Why cash and long-term Treasury bonds become “depreciating assets,” and the structural reasons for the movement of funds into Bitcoin, Ethereum, and gold.
- The timing of the liquidity market created by the rate pivot and fiscal expansion during the 2025–2026 period, and key risk management points.
One-Glance News: 10 Key Points Summary
- Stablecoins are expanding as digital dollars and global payment chips, and their issuers invest a large portion of reserves in US Treasury bills (T-bills).
- This structure reinforces the demand for US Treasuries to help fiscal expansion, which in turn creates a pipeline that expands global liquidity.
- As the supply of stablecoins increases, the buying power entering Bitcoin and altcoins increases, enhancing price elasticity.
- Ethereum directly benefits from the gas demand of stablecoin transactions and remittances, so its degree of advantage may be “more direct” than Bitcoin.
- The period from 2025 to 2026 is likely to be favorable for the liquidity environment due to the combination of a rate pivot and expanded election-related fiscal policies.
- In this phase, “cash and long-term US Treasuries” are likely to become depreciating assets vulnerable to inflation and debasement.
- Assets that “cannot be easily produced” (Bitcoin, gold, quality digital assets, prime real estate) are comparatively advantageous.
- Over a 10-year period, a Bitcoin CAGR of around 25% could make a “10-bagger” scenario viable, but a significant correction in 2026 should be anticipated.
- While there is debate over “new liquidity vs. the reallocation of existing funds” with the increase in stablecoins, the effect on risk assets is largely positive through increased demand for Treasuries, on-chain credit creation, and reduced trading friction.
- Investment checklist: stablecoin supply YoY, TGA and RRP balances, Tether T-bill ratio, DXY, 2y/10y yields, BTC Dominance, on-chain gas demand.
Stablecoin-Treasury-Liquidity Mechanism: The Core of the Dollar Pipeline
Stablecoins are digital tokens pegged to the dollar and serve as the core on/off ramp of global payments.
Major issuers (e.g., USDT, USDC) keep customer deposits as reserves, investing a significant portion in US Treasuries and cash-equivalent assets.
At this time, the purchase of T-bills with these reserves creates a natural buyer for US Treasuries.
Even when traditional buyers from China, Japan, etc., are weak, the growth of the stablecoin sector strengthens the demand for Treasuries.
As a result, a “closed loop” is formed that goes from fiscal expansion → Treasury issuance → purchase of Treasuries with stablecoin reserves → global expansion of digital dollars.
This loop supports global economic liquidity (dollar liquidity) and is favorable for risk asset multiples.
In terms of market scale, stablecoins have already recovered and expanded to hundreds of billions of dollars, with scenarios of reaching the trillion-dollar scale within 10 years being discussed.
Especially in emerging markets with low financial accessibility, the high demand for remittances, transactions, and asset storage—and the advantages of low fees, fast settlements, and 24/7 availability—overwhelm traditional finance.
“True Liquidity or Fund Reallocation?” – Organizing the Debate
The counterarguments are twofold.
- One argues that existing dollars are merely being “repackaged” into stablecoins, thus limiting CPI-type inflation.
- The other contends that since stablecoins do not create fundamental credit like banks, the increase in overall liquidity is overstated.
However, there are three reasons why the net effect on risk assets is significant. - Structural reinforcement of Treasury demand: When issuance and absorption work smoothly, fiscal and liquidity policies become easier to implement, bringing gradual easing effects to the real and asset markets.
- On-chain credit and leverage: Secondary credit creation occurs through DeFi collateralized lending, derivatives, and rehypothecation, enhancing trading responsiveness.
- Significant reduction in trading friction: With lower barriers in borders, time, and fees, the “buy execution potential” increases dramatically.
Bitcoin vs. Ethereum: Who Benefits More Directly?
Bitcoin: Stablecoins are like chips in a casino; as the number of chips increases, the casino’s stakes grow.
The increase in stablecoin supply indirectly boosts demand for Bitcoin, and when combined with the narrative of long-term scarcity (the 21 million cap), it enhances price elasticity.
Ethereum: A significant portion of stablecoin trading and remittances occur on Ethereum and Layer 2 networks, generating gas fees.
In other words, increased stablecoin activity directly boosts fee burning (EIP-1559) and network revenue, strengthening the economic accumulation of ETH.
In conclusion, remember the difference in the benefit path: “Bitcoin benefits indirectly, while Ethereum benefits directly.”
Timing of the 2025–2026 Liquidity Market: Pivot and Fiscal Policies
- Interest Rates: After passing the high-rate peak, a pivot toward the “neutral rate” will occur, improving global liquidity and risk appetite.
- Fiscal Policy: In an election scenario, the incentive for expanded fiscal measures increases, leading to expanded Treasury issuance → purchase of Treasuries with stablecoin reserves → activation of the liquidity pipeline.
- Risk: Given Bitcoin’s 4-year halving cycle and past patterns, a correction of 30–50% in 2026 cannot be ruled out.
That is, the period until mid-2026 is favorable, but preparations should be made for potential volatility beyond that.
What to Hold and What to Avoid: Portfolio Guide
What to avoid (potentially depreciating assets): Cash, long-term US Treasuries (due to duration risks and deteriorating real yields).
What to favor (scarce, tangible, digital hard assets):
- Bitcoin: A 10-year structural long. DCA and rebalancing are recommended.
- Ethereum and key Layer 2 assets: Direct beneficiaries of stablecoin activity, with enhanced fee burning and network profitability.
- Gold (and some silver): A hedge against currency debasement and a buffer for portfolio volatility.
- Tokenized short-term bonds and money markets (cash alternatives): Use idle funds to capitalize on on-chain T-bill yields, while ensuring diversification of issuers and custody risk.
Execution tips: - Regular purchasing (DCA), sectional profit-taking and rebalancing, and diversification of cash holdings (across various stablecoins, exchanges, and wallets).
- In anticipation of a volatile phase in 2026, pre-design hedge scenarios (temporarily increasing cash positions, using options and stable pools).
The “Key Nuance” Others Often Miss
- Stablecoins are Eurodollar 2.0: They are redesigning the cross-border dollar payment system on the blockchain, and the US has an incentive to promote a T-bill-heavy reserve through regulation (hidden seigniorage + stabilized Treasury demand).
- Consider these three leading indicators: ① Year-over-year stablecoin supply (a YoY acceleration of over 20% increases the probability of a risk asset rally), ② Changes in the T-bill ratio of Tether and USDC (indicating the strength of the Treasury-crypto pipeline), ③ The balances of the Treasury General Account (TGA) and Reverse Repurchase Agreement (RRP) (gauging net liquidity inflows/outflows).
- Intersection with the AI trend: If AI agents and machine payments adopt stablecoins as the fundamental rail, “24/7 micropayments by machines” will create underlying demand.
As the tokenization of AI data, models, and GPU time progresses, digital dollars and ETH gas demand will structurally increase.
Indicators and Checklist
- Global Economy/Liquidity: DXY, M2 YoY, 2-year/10-year US Treasury yields, trends in RRP and TGA balances.
- Crypto Liquidity: Total stablecoin supply and net increase, exchange holdings, futures funding rate, BTC Dominance.
- Ethereum Activity: Gas usage, fee burning, Layer 2 TPS/TVL, stablecoin transfer volumes (chain-specific shares: ETH, TRON, etc.).
- Risks: Regulations (US stablecoin bills, EU MiCA), custody/depegging issues, geopolitical variables.
Q&A: If 10 Million KRW Is Invested in Bitcoin, What Will It Be Worth in 10 Years?
- Base Case: With an annual compounded rate of around 25%, it could reach approximately 100 million KRW (10 times) after 10 years.
- Conservative Case: At a 15% CAGR, it would be about 4 times, and the aggressive case: at a 30% CAGR, about 14 times.
- Caution: Given the significant volatility (especially around 2026±), employing DCA, rebalancing, and a cash hedge rather than lump-sum buying is more sensible.
Conclusion: The New Version of Dollar Hegemony and Our Position
Stablecoins do not weaken dollar hegemony; rather, they are a digital extension that “changes form” and spreads it more widely.
In that process, Treasury demand is supported, and global liquidity repeatedly undergoes reallocation and expansion.
In a phase of debasement, the real value of cash and long-term Treasuries is prone to melting away.
Conversely, scarce assets like Bitcoin, Ethereum, and gold, as well as tokenized income assets, deserve to be the central pillars of a portfolio.
The liquidity environment in 2025–2026 brings both opportunities and volatility.
When the stakes are high, rewards go to those who understand the structure and have designed for the risks.
< Summary >
- The purchase of US Treasuries with stablecoin reserves creates a fiscal and liquidity pipeline, which increases the buying power in the coin market.
- Bitcoin benefits indirectly, while Ethereum benefits directly through gas demand.
- Amid the 2025–2026 liquidity market, cash and long-term Treasuries become depreciating assets, while Bitcoin, gold, and quality digital assets take precedence.
- To prepare for the 2026 correction risk, it is advisable to combine DCA, rebalancing, and hedging strategies.
- Points to watch: stablecoin supply YoY, T-bill ratio, DXY and interest rates, on-chain activity indicators.
SEO Keywords: Global economy, inflation, interest rates, liquidity, US Treasuries.
[Related Articles…]
- US Treasuries and Stablecoins: Anatomy of the Liquidity Pipeline
- AI Agent Payments and Tokenization: Digital Dollar Strategies for 2026
*Source: [ 경제 읽어주는 남자(김광석TV) ]
– “유동성 파티 끝난다” 돈의 가치가 녹고 있다.. 달러 패권의 시대에서 코인으로 이어지는 시나리오 | 경읽남과 토론합시다 | 강환국 작가 2편
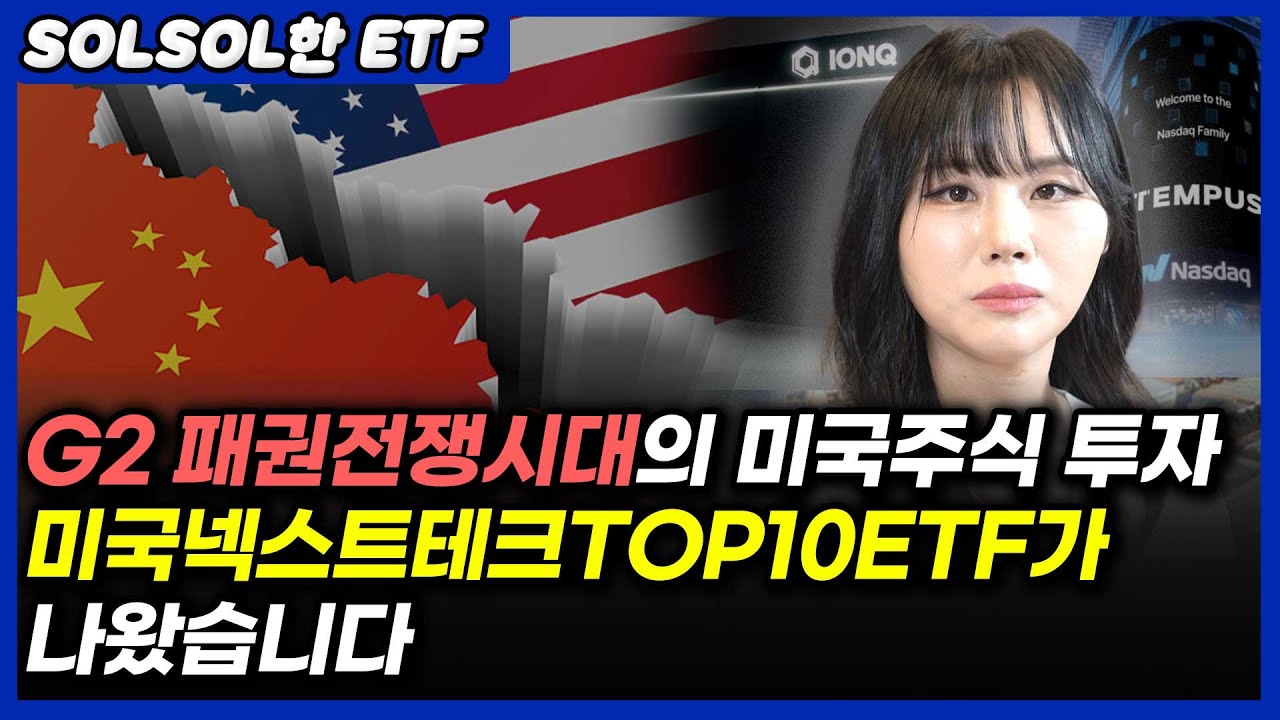
● G2 Tech War Sparks Quantum, SMR, AI Frenzy
The U.S. Stock Strategy Benefiting from the G2 Hegemonic War, SOL U.S. Next Tech TOP10 Active ETF Key Guide: Conditions for Interest Rate Cut Benefits, AI Trend Expansion, and Big Moves in Small/Mid-Cap Stocks
This article explains how an interest rate cut directly leads to a revaluation of small and mid-cap growth stocks, how the U.S.-China hegemonic war triggers government funding and regulatory relaxation to accelerate the commercialization of next-generation industries, and how the AI investment focus is shifting from big tech to the entire value chain.
In addition, it outlines the composition philosophy and risk management points of the SOL U.S. Next Tech TOP10 Active ETF, as well as the “S&P 500 Market Representativeness Rule” and the accelerated logic of the commercialization timeline for SMR and quantum computing, which are seldom discussed by other YouTube channels or news outlets.
This is structured like a news briefing to provide a comprehensive understanding of key topics such as U.S. stocks, ETFs, interest rate cuts, economic outlook, and AI trends all at once.
News Briefing: Key Points at a Glance
With growing expectations for an interest rate cut, the discount rate for small and mid-cap growth stocks is decreasing, while the effects of lower financing costs and increased liquidity are taking place simultaneously.
The intensification of the U.S.-China hegemonic war has led to increased support from the U.S. government in terms of capital, tax credits, and regulatory relaxation for next-generation strategic industries.
According to interviews, there is a clear trend of enhanced policy drive, with DARPA’s budget increasing by about 20%.
J.P. Morgan has announced its willingness to invest up to 10 billion dollars in defense, aerospace, energy technology, advanced manufacturing, AI, and quantum computing, which is expected to leverage private capital.
There are cases where milestones in licensing and technology for quantum computing and SMR have been accelerated, thereby improving commercialization expectations.
The focus of AI investment is shifting from a single bet on big tech to include mid- and small-cap players in areas such as optical communications, server optimization, AI-specific data centers (neo-cloud), and AI healthcare.
Shinhan Asset Management’s SOL U.S. Next Tech TOP10 Active ETF is designed to actively manage risk and seek alpha by selectively including future potential tech top 10 candidates.
Three-Step Logic of the Interest Rate Cut Cycle and the Revaluation of Small/Mid-Cap Growth Stocks
A decline in the DCF discount rate increases the present value of cash flows for companies with more distant future earnings.
The decline in interest rates lowers financing costs, thereby promoting the business expansion of companies in the early and growth stages.
In a phase of increased liquidity, the individual investor proportion grows, and historically, there has been an enhanced correlation between credit balances and growth stock indices.
Policy and Capital Directions Shaped by the G2 Hegemonic War
There are two branches in strategic industries.
The U.S. already leads in generative AI and AI semiconductors.
There remain areas that have not yet been led but must be nurtured, such as SMR, quantum computing, drones, aerospace, and advanced manufacturing.
Government spending (budget increases and tax credits) and shortened regulatory processes work simultaneously to accelerate the commercialization timeline.
The participation of major private financial institutions further accelerates the government drive by acting as a lever for capital.
Commercialization Timeline: Signals of Advancement
Quantum computing leader IonQ has been highlighted for achieving roadmap milestones ahead of schedule.
In the SMR sector, X-energy has presented an NRC licensing review schedule of approximately 18 months, which raises expectations for a shortening from the conventional 30–36 months.
Major companies like TerraPower are also positioned to benefit from the efficiency gains in the licensing process.
When government policy, capital, and talent converge, the classic pattern of a rapidly rising S-curve in mega trends is reproduced.
Shift in the AI Investment Focus: From Single-Themed Big Tech to Diversified Value Chain
The beneficiaries are expanding to include areas such as optical communications (optical modules and interconnects), server optimization software, power-intensive AI-specific data centers (neo-cloud), and AI healthcare (Tempus AI).
It is significant that many of the leading companies in these areas are small and mid-cap growth stocks rather than large-cap stocks.
Therefore, a portfolio should be exposed not only to big tech but also to small and mid-cap AI players in order to adapt to leadership rotations.
Why Select “Next Tech TOP10” Instead of Russell 2000
The Russell 2000 has a high proportion of zombie companies, traditional manufacturers, and regional banks, which reduces the efficiency of following next-generation themes.
In contrast, the “Next Tech TOP10” approach focuses on key candidates with the potential for growth into big tech, thereby reducing dilution and enhancing thematic purity.
S&P 500 inclusion is based not solely on market capitalization but on “market representativeness.”
In other words, when mega trends such as AI, power infrastructure, and cryptocurrencies expand, there is a structural upside due to the increased likelihood of related stocks being included.
SOL U.S. Next Tech TOP10 Active ETF: What It Contains and How It Is Managed
The core themes are AI; industries that benefit from the U.S.-China hegemonic conflict; and next-generation growth sectors such as power, aerospace, and quantum computing.
Representative inclusion candidates such as IonQ (quantum), AeroVironment and Rocket Lab (drones and aerospace), Tempus AI (AI healthcare), and Oklo (SMR) are presented.
The active strategy aims to create overlay alpha and respond to volatility.
It maintains the flexibility to swiftly include promising stocks outside of the benchmark when discovered.
Two Reasons Why Active Management Is Necessary
Small and mid-cap stocks exhibit greater volatility compared to large-cap stocks.
Active management is needed to respond to downside events (such as policy delays, financing variables, and clinical/test failures).
There are significant information asymmetries due to gaps in coverage.
They represent the asset class best positioned to generate alpha through research-based selection.
Investment Risks and Checklist
Policy and licensing risks.
Changes in budget or regulatory schedules can trigger a revaluation of valuations.
Financing and dilution risks.
Small and mid-cap growth stocks may experience dilution due to capital increases or convertible bonds.
Execution risks.
There is a high frequency of operational risks such as delays in achieving technical milestones, order misses, or partnership changes.
Liquidity and volatility risks.
Gap moves can be significant in segments with low trading volumes.
The checklist is as follows:
1) Government/regulatory calendar and budget execution timeline.
2) Cash burn rate (cash and cash equivalents/quarterly burn) and survival for 4–6 quarters.
3) Quantitative KPIs of the commercialization roadmap and quarterly updates.
4) Contract structures and termination clauses for major partners and key customers.
5) Industry representativeness and publicly available shares conditions that increase the possibility of S&P 500 inclusion.
The Most Important Aspect Often Overlooked by Other Media
The “market representativeness” rule for S&P 500 inclusion accelerates the multiple re-rating of promising small and mid-cap stocks during periods of amplified mega trends.
It is driven by qualitative factors such as filling industrial gaps, rather than mere market capitalization.
The surge in power demand from AI-specific data centers and the shortened SMR licensing process are interconnected.
When the power CAPEX cycle opens structurally, simultaneous order wins across the SMR, transmission, and cooling ecosystems become possible.
In segments where the correlation between individual credit balances and growth stock surges is high, event-driven news flows can exaggerate prices.
This is why the aggressive expansion and contraction strategy of active ETFs is essential.
Practical Application to Portfolio Construction
The proposed allocation is a layering method with 60–70% in core (large-cap AI and semiconductors) and 30–40% in active themes (Next Tech).
In a market downturn, it involves scaling in gradually and balancing event-driven rebalancing around the policy calendar.
The approach favors logical stop-losses rather than cuts based solely on losses.
If there is a failure to meet milestones, a downgrade in guidance, or a deterioration in financing conditions, the allocation is reduced, whereas acceleration in policies or milestones warrants an increase in allocation.
< Summary >
Expectations for an interest rate cut promote a revaluation of small and mid-cap growth stocks in terms of discount rates, financing costs, and liquidity.
The U.S.-China hegemonic war accelerates the commercialization of SMR, quantum, drones, aerospace, and AI healthcare through government budgets, regulatory relaxation, and the influx of private capital.
The benefits of AI are spreading from a single big tech focus to the entire value chain, with many leading prospects found among small and mid-cap stocks.
A strategy that emphasizes the selection of “Next Tech TOP10” over the Russell 2000 and active management is rational for achieving thematic purity, alpha generation, and risk management.
The S&P 500 “market representativeness” rule and the power and data center CAPEX cycle provide a structural upside to promising small and mid-cap next-generation stocks.
[Related Articles…]
How the U.S.-China Hegemonic War is Reshaping the Next-Generation Industrial Map
The Interest Rate Cut Cycle and the Conditions for a Small/Mid-Cap Stock Rally
*Source: [ Jun’s economy lab ]
– G2 패권 전쟁 시대의 미국 주식 투자, 미국넥스트테크TOP10 ETF가 나왔습니다(ft.SOL미국넥스트테크TOP10 ETF)