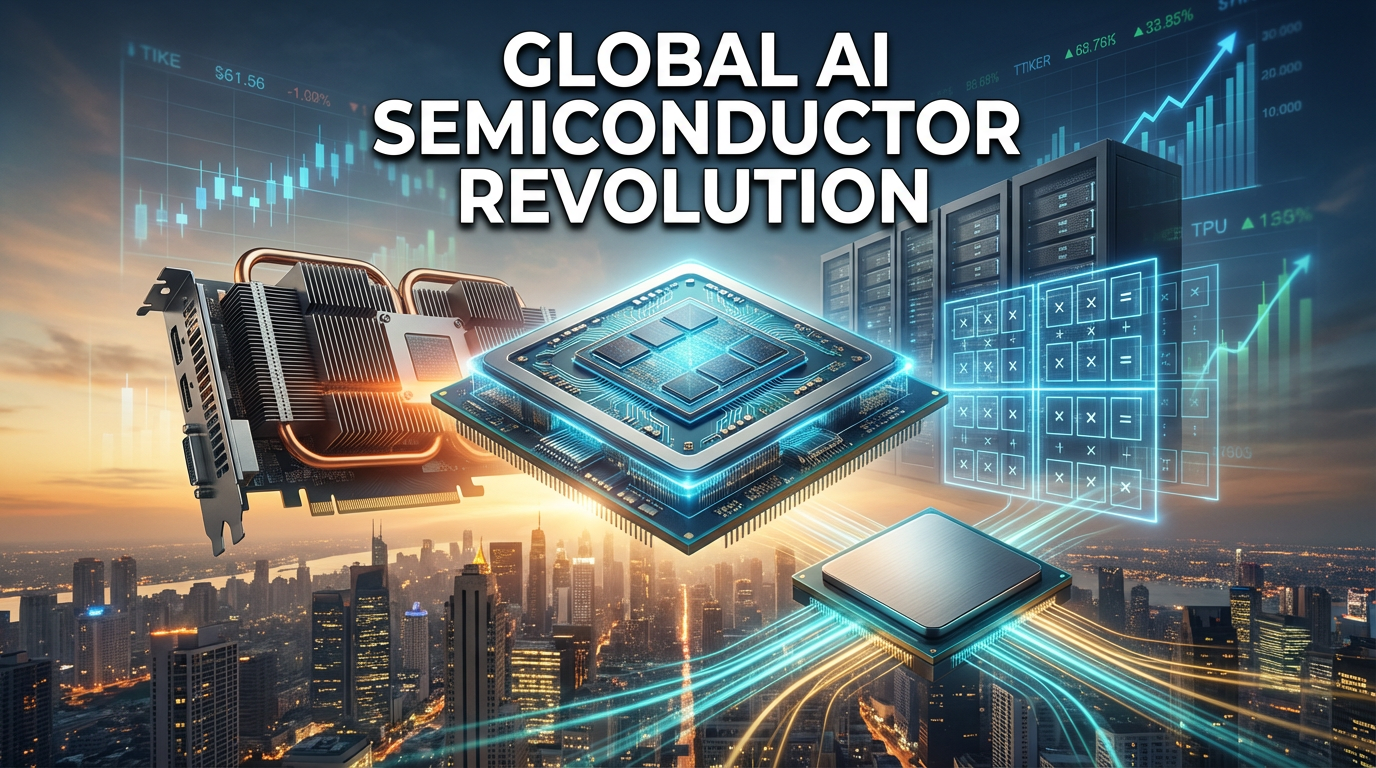
● Burry’s Bubble Bet
Michael Burry, the Truth Behind the Controversy of Holding Puts on Palantir & NVIDIA and the 2025 AI-Rotation Scenario
This article contains 1) an accurate interpretation of Burry’s 13F options positions, 2) clarification of the misconception of a “₩1.3 trillion short,” 3) rotation signals between AI leading stocks and traditional sectors, 4) economic outlook for 2025 along with interest rate and inflation variables, and 5) a practical checklist for individual investors.
Understanding what is not being revealed is more important than the size of the short bet, freeing you from the noise of the news.
News at a Glance: What Was Disclosed and Why the Market Was Stirred
According to the recently disclosed 13F, Michael Burry’s firm (Scion) held puts on Palantir (PLTR) and NVIDIA (NVDA) as of quarter-end.
At the same time, calls on Pfizer (PFE) and Halliburton (HAL) were also recorded, which can be interpreted as an upward signal for the traditional sector.
Burry submitted his 13F earlier than the quarter-end date, which attracted significant attention, and his tone on social media of “refusing to participate in the bubble” sparked various interpretations.
Some media outlets reported that based on the value indicated in the 13F, Burry held positions worth up to ₩1.3 trillion short, but this may be an exaggeration arising from the accounting methods of options.
Fact Check: What the 13F Reveals vs. What It Does Not (Most Important)
The 13F discloses the holding of puts/calls and the “reported value” as of quarter-end, but it does not provide details on the actual premium paid, expiration, strike price, or whether it is a spread.
The reported value is close to the notional value of the underlying asset, and the actual capital invested by Burry could be much lower.
Holding puts could indicate a bearish bet, but it could also be a hedging structure for the long positions held.
There is a significant possibility that the positions have changed after the quarter-end, and since the 13F is subject to delayed disclosure, it does not guarantee the current position.
Therefore, the expression “Burry shorted NVDA/PLTR for ₩1.3 trillion” is not accurate, and it is more correct to say “Burry held downside option exposure as of that time.”
Interpretation Points: Why Puts on PLTR & NVDA, Why Calls on PFE & HAL
It is possible that this was a strategy to prepare for increased short-term volatility amidst the intense focus on AI leading stocks and debates over high valuations.
NVIDIA faces volatility factors such as the data center cycle, supply constraints, acceleration by competitors, and risks related to customer-specific chip transitions by hyperscalers.
Palantir is faced with variables such as government contract dependency, the pace of expansion in the commercial sector, stock compensation costs (SBC), and changes in its margin profile.
In contrast, Pfizer and Halliburton combine cyclical and defensive traits, and their valuation discounts and stable cash flow make them attractive on a relative value basis.
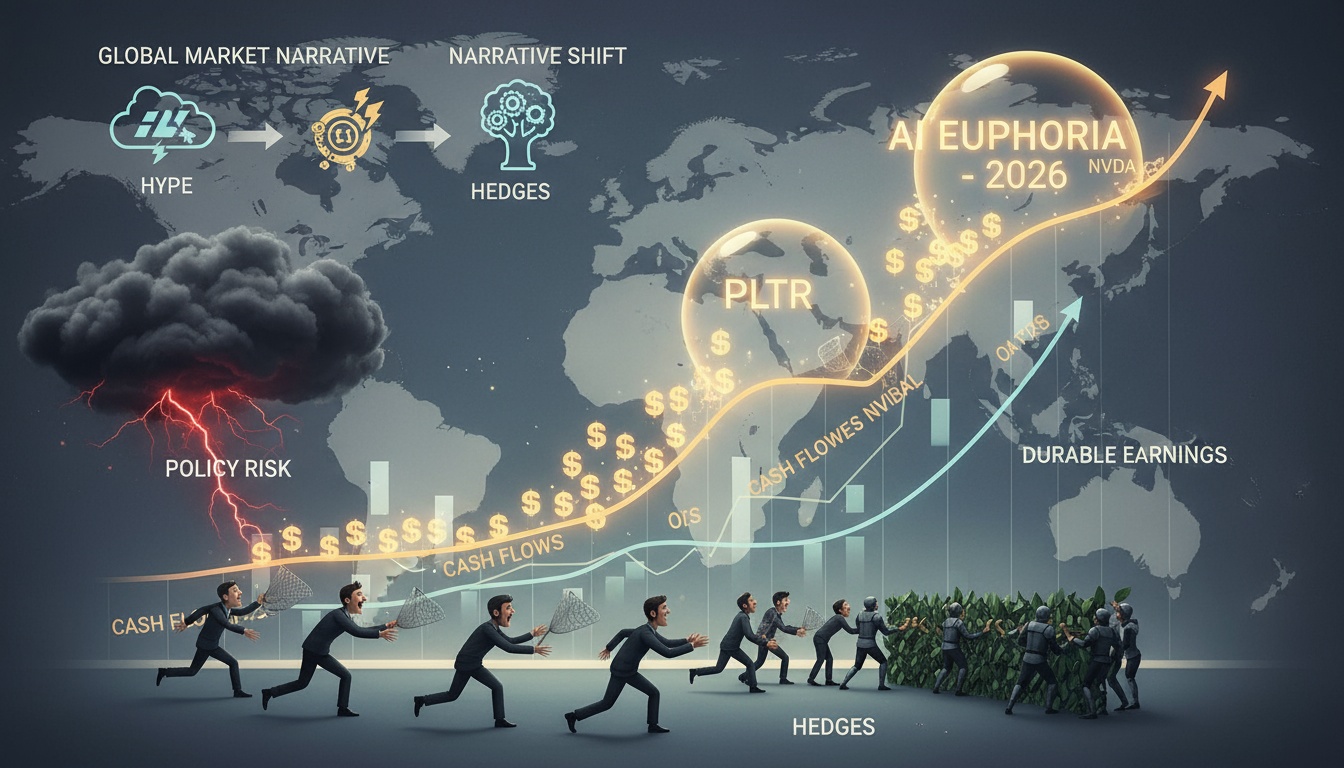
In conclusion, this likely represents a pair trade of “preparing for an AI overheat + a long position on undervalued traditional sectors.”
Update on Macro Variables: 2025 Economic Outlook, Interest Rates, Inflation, and the Stock Market
Once the peak in interest rates is passed and inflation begins to ease, tech sectors that are sensitive to multiples may benefit, but growth stocks in overheated conditions might experience increased volatility when earnings estimates fail to keep pace with stock prices.
Although the risk of recession has eased, if fiscal deficits, government bond supplies, and energy prices trigger re-inflation pressures, the pace of the Fed’s easing could slow down.
AI capital expenditure is structural, but if client companies enter a phase of scrutinizing investment efficiency, a normalization of growth rate deceleration might occur.
The stock market is intersecting between a reduction in concentration on the Magnificent 7 and sector rotation, making a selective approach based on quality and cash flow increasingly important.
In summary, the key variables for 2025 are the balance between interest rates and inflation and the verification of AI investment efficiency.
Three Scenarios: The Relative Dynamics of AI and Traditional Sectors
Scenario A (Soft Landing/Gradual Interest Rate Cuts): AI revenue realization continues, and traditional sectors might simultaneously rise based on attractive cash flow.
Scenario B (Growth Slowdown/Rotation): As the burden of overheating in AI leading stocks is relieved, capital flow might strengthen towards energy, pharmaceuticals, and industrials.
Scenario C (Reemergence of a Recession): Defensive earnings and dividends would favor pharmaceuticals, while strong cash-generating energy majors may show relative strength.
The Trap of Numbers: A Caution on Interpreting “Portfolio 66%/14%”
Options are reported by nominal amounts, which can cause their weight in a 13F to be exaggerated.
The actual risk is determined by the premium and the Greeks such as delta and gamma, meaning that even with the same reported value, the risk profile could be completely different.
Thus, interpreting the portfolio as being “mostly short on NVDA/PLTR” is an overstatement.
Checklist for Individual Investors: Before Taking Action
Remember that the 13F is merely a source of ideas and not a real-time signal.
First, assess your investment horizon, permissible volatility, and portfolio correlations.
If your AI exposure is excessive, partial hedging (e.g., index puts, shorting calls on specific stocks, call spreads) can help manage volatility.
For traditional sectors, evaluate the pre-cash flow, dividend sustainability, and potential for narrowing valuation discounts.
Include event risks (earnings, regulations, export controls, power and supply chain issues) in your calendar and adjust position sizes accordingly.
Other Points Rarely Addressed (The Real Key Points)
Burry’s holding of puts may be more about cost efficiency than outright directional bets.
The volatility of major AI stocks is highly sensitive to option pricing, where short-term changes in the put-call skew can significantly impact gains or losses.
Thus, it is likely that Burry aimed for an asymmetry in risk/return that was favorable when prices dropped, rather than expecting a precise decline.
If it is a hedging strategy, it could allow him to maintain a long-term bullish view on AI while managing short-term overheating with options.
Sector Research Insights: The Intersection of AI Trends and Traditional Industries
The focus of AI is shifting from training to inference, with power infrastructure, cooling, and foundry capacity emerging as bottlenecks.
The acceleration of hyperscalers producing their own chips and the rapid progress of competitors could alter the margin structure of the GPU ecosystem.
The energy sector may benefit from structural demand stories due to increased power consumption and data center load, while the pharmaceutical sector could see improved R&D efficiency with the adoption of productivity AI.
This intersection could create a combination of “long-term bullishness on AI + significant re-rating potential in traditional sectors.”
Q&A Summary
Q: Is it true that Burry shorted with ₩1.3 trillion?
A: The 13F reporting is close to the notional value and may be exaggerated; the actual capital invested is at the level of the option premium.
Q: Does he still hold these positions?
A: The 13F is subject to delayed disclosure, so the current position cannot be determined.
Q: Is it a directional bet or a hedge?
A: It is impossible to conclude solely based on the document.
Also consider the possibility of it being a spread/hedging structure.
Q: How should our portfolio be managed?
A: If there is excessive exposure to AI, consider partial hedging; for the traditional sectors, a selective approach based on cash flow and potential valuation improvement is rational.
Investment Idea Memo (For Reference)
Retain the core AI holdings for the long term, while managing volatility around earnings with an options strategy that is close to delta-neutral.
Approach traditional sectors with a division strategy focusing on large-cap stocks with clear economies of scale, dividends, and share buybacks.
Adjust the proportions of interest rate and cyclical sensitive stocks in accordance with seasonal factors and earnings momentum in response to changes in the macroeconomic environment.
Continuously measure the portfolio correlations to avoid a one-sided bet.
Editor’s Note: Caution for Content Reliability
This article is an interpretation based on public information and is not investment advice.
Options are highly risky with diverse structures, making it difficult to draw conclusions based solely on surface information.
Since macro variables such as economic outlook, interest rates, inflation, the stock market, and recession risks are updated frequently, verify your hypotheses with the latest data.
< Summary >
Burry’s holding of puts on PLTR and NVDA is factual, but the 13F reported value should not be mistaken for the actual capital invested.
The intent may lean more towards “asymmetric risk management” rather than a directional bet, and his simultaneous holding of calls on traditional sectors can be seen as a card for rotation.
The key variables for 2025 will be the balance between interest rates and inflation, as well as the verification of AI investment efficiency, suggesting that partial hedging and a selective approach focused on cash flow could be effective.
[Related Articles…]
AI CapEx Cycle, Key Rotation Checkpoints in the Stock Market After the Interest Rate Peak
NVIDIA Dependency and the Recession Scenario: The Next Phase of the Semiconductor Cycle
*Source: [ 내일은 투자왕 – 김단테 ]
– 마이클버리가 팔란티어, 엔비디아를 1.3조원 숏쳤다고? 그 진실은?
● AI Debt Timebomb
Real Reasons Behind the Sharp Decline of Meta and Oracle, the AI Investment Cycle Sustainment Until 2026, and a Comprehensive Summary of Benefits to Power Infrastructure
In this article, two points are clearly addressed.
First, a key framework is provided to distinguish whether the sharp declines of Meta and Oracle are merely “temporary adjustments” or “overheating signals.”
Second, it explains the risk/opportunity points from the perspectives of credit, power, and cash flow in a structural manner rather than with numbers—a perspective largely missed by most news outlets.
It also connects how global economic variables such as interest rates and inflation are interwoven with the stock market and the AI investment cycle.
News Summary at a Glance
- Although Meta delivered solid earnings, its statement on “expanding AI investments until 2026” and the repercussions of large-scale bond issuance led to approximately a 19% correction from its peak.
- Oracle, on the other hand, expanded its investments by deploying large-scale debt and data center collateral loans (so-called ‘DaDaDa’), while credit risk was highlighted by rising CDS premiums.
- The earnings of big tech companies remain generally robust.
Alphabet (through YouTube, search, and cloud), Amazon (with a re-accelerating AWS growth rate), Microsoft (maintaining a steady upward trend), and Apple (with resilient iPhone demand) support investor sentiment. - There is still a bottleneck in AI power infrastructure.
Short-term delivery solutions such as fuel cells, ESS, gas turbines, and the demand for emergency power generators in data centers are spreading across companies like Caterpillar and Bloom Energy. - From a cycle perspective, the scenario in which an OpenAI IPO around the second half of 2026 could be the emblematic peak signal remains valid.
Common Denominator for the Sharp Declines of Meta and Oracle: “The Source of Funds and the Recovery Route”
The key point is that both companies have significantly increased their debt to invest in AI infrastructure.
- It is a signal that they have used the top tier of the financing ladder.
The order goes: bond issuance → bank borrowing → asset-backed lending, with costs increasing along the way.
Oracle resorting to data center collateral loans implies that it has used even the lowest tier of financing. - The visibility of the investment recovery route is lower for Meta.
MS, Amazon, and Alphabet can recoup their data center investments through cloud sales.
In contrast, Meta’s core business is advertising and it does not charge directly for IaaS/PaaS.
This difference translates the same AI investments into a valuation discount.
Oracle: CDS as a Credit Signal, Debt and Cash Flow Checkpoints
- The rise in CDS premiums does not mean “the probability of default within five years has increased” but rather that “the insurance premium against that risk has risen.”
Widening credit spreads are synonymous with increasing funding costs in a high interest rate environment. - When a debt maturity cluster emerges around 2028, the refinancing rate becomes crucial.
While the stock market may seem secure during good times, if the global economic paths of interest rates and inflation change, the resilience of cash flow will be put to the test. - The investment focal point is the speed from “order acquisition → revenue recognition → cash conversion.”
Even if the TCV of a large AI contract is significant, revenue and FCF will only follow once the data center is completed and customer usage increases.
Meta: Past Metaverse Trauma vs. Present AI Investment Controversy
- The overinvestment in the metaverse in 2022 combined with tightening monetary conditions remains a nightmare in investors’ memories.
Once again, the framing of “isn’t the founder’s drive too excessive?” comes into play. - However, a clear difference exists.
The strength of its advertising core and the ongoing diversification into revenue sources such as Reels, Shopping, and WhatsApp Business Messaging are evident.
It is just that, without a cloud billing route, directly demonstrating the ROI of its data centers is comparatively more challenging. - There are two checkpoints.
1) How much AI can boost advertising pricing and conversion rates to effectively improve ARPU.
2) Whether platform strategies such as on-device AI and open model deployment structurally extend user dwell time in a cost-effective manner.
Big Tech Earnings Check: “Concerns are Individual, Fundamentals Remain Solid”
- Alphabet: Recovery in YouTube and search along with improvements in cloud profitability are occurring simultaneously.
The expansion of generative AI product offerings is strengthening ecosystem lock-in. - Amazon: Accelerating growth of AWS and plans to double capacity by 2027 support capital market confidence.
Guidance for increased efficiency and margin recovery is also positive. - Microsoft: Although not a major surprise, it maintains a steady upward trajectory.
The expansion of its AI copilots and gradual mix improvements in Azure are key factors. - Apple: iPhone demand remains robust, and signals that the low point in China momentum has been passed are emerging.
The service revenue mix acts as a buffer for valuation defense.
AI Investment Cycle Bottleneck: Power Infrastructure and Delivery Lead Times
- The primary bottleneck in data center expansion is power.
Large-scale power grid expansion and nuclear power plants involve significant delays. - Short-term delivery solutions are attracting investments.
Fuel cells, ESS, gas turbines, and emergency generators can be installed within months, hastening demand. - Case examples.
Bloom Energy has built trust through early deliveries, while Caterpillar is being re-evaluated as its sales ratio for power generation and gas turbines for data centers increases. - In the stock market, this trend is spreading to baskets such as power infrastructure, renewable energy, power equipment, and industrial automation (robotics).
Is This Correction a “Warning” or a “Breather”?
- Points that can be interpreted as warning signals:
1) The use of high-cost bottom-tier financing (collateral loans).
2) Rising CDS leading to widening credit spreads.
3) An increasing lag between Capex and revenue realization. - Points that can be seen as a breather:
1) The robust performance and guidance of many big tech companies.
2) The stock market’s continued preference for risk assets in anticipation of the interest rate peak-out.
3) The AI investment pipeline is still expanding.
My Perspective: The OpenAI IPO Around the Second Half of 2026 Could Be the Cycle’s Peak Signal
- IPOs typically coincide with periods when the highest valuations can be achieved.
For an OpenAI IPO to materialize, the stock market’s enthusiasm and sustained AI investment sentiment are required. - Therefore, the period around 2026 is highly likely to function as the “hot section endpoint” of the cycle.
Until then, the global economic narrative, combined with the themes of AI investment and power infrastructure, is likely to drive the stock market.
The Most Important Point Rarely Addressed by Other YouTube Channels or News Outlets
- The risk of a reversal in the WACC vs. ROI dynamic.
If the high interest rate regime persists, the ROI of AI data centers must exceed the cost of capital (WACC).
If ROI fails to meet expectations, valuation discounts will be larger for leveraged companies. - The use of the bottom rung of the financing ladder is a signal for a stress test of resilience.
As financing moves down to collateral loans, flexibility decreases and the defensive capability during economic fluctuations weakens. - The “inversion risk” where the lead time for power procurement becomes longer than the GPU supply.
Even if chips arrive, without power the racks remain idle, and depreciation directly impacts costs. - Meta’s asymmetrical revenue recovery structure.
While improvements in advertising ARPU are structurally feasible, the leverage of usage-based billing like in cloud services is limited.
This asymmetry creates a multiple disparity even for the same Capex. - An observation of an accelerating maturity wall before 2028.
If the refinancing environment from 2026 to 2028 deteriorates, CDS may once again emerge as a valuation variable.
Checklist and Action Plan
- Monitor credit and cash flow.
1) Trends in CDS and corporate bond spreads.
2) Net debt/EBITDA, interest coverage ratio, FCF/Capex coverage. - Check earnings details.
1) The gap between cloud order TCV and usage growth.
2) The rate of securing data center power PPAs and delivery schedules.
3) Whether AI-related revenues are separately disclosed in detail. - Positioning strategy.
1) Diversify across an AI core (semiconductors and cloud) and AI infrastructure (power, heat management, and automation) basket.
2) Approach in subdivisions during periods of event volatility and manage proportions during weeks when interest rate and inflation indicators are announced.
Portfolio Strategy Guide
- For the long-term core, keep it simple with index or mega-cap ETFs.
Secure AI investment beta with baskets such as the Nasdaq-100 and the Magnificent 7. - For satellite positions, layer with baskets of power infrastructure, renewables, data center REITs, and industrial automation.
- Prioritize cash flow stocks.
When Capex leads the timeline, increase the proportion of assets with clear FCF conversion points to defend against volatility. - Be mindful of macro variables.
Global economic interest rate trajectories, persistent service inflation, and real interest rate levels may cap multiples at their upper limits.
Conclusion: The Correction Is Not a Warning, It’s a “Stamina Test”
The declines in Meta and Oracle should be viewed not as warnings of excessive leverage, but as the market scrutinizing the capital procurement and recovery structures in a high interest rate regime.
The fundamentals of big tech continue to support the stock market, and AI investments are generating secondary and tertiary benefits through power infrastructure.
In the cycle, the peak debate is expected to intensify around 2026, and until then, strategies focusing on selectivity and concentration, diversification, and cash flow are valid.
< Summary >The core of Meta and Oracle’s sharp declines is “the financing for AI investments through debt” and “the clarity of the recovery route.”
Oracle faces rising credit costs due to increasing CDS premiums, while Meta suffers a discount factor due to the absence of a cloud billing route.
Big tech’s earnings remain robust, and the bottleneck in AI power infrastructure creates short-term beneficiaries.
From a cycle perspective, the period around 2026 is a strong candidate for the peak, and until then, a strategy combining a core of indices/mega-caps with a satellite basket of power and automation is reasonable.
[Related Articles…]
- AI Data Center Power Crisis: 2026 as the Turning Point
- The Impact of an OpenAI IPO on Global Markets
*Source: [ 소수몽키 ]
– 메타, 오라클의 수상한 급락? 무리한 AI투자의 경고 신호일까
● Liquidity Bubble Implodes, Inflation Reignites Market Panic
How Long Will the Liquidity Market Continue? The 2025~2026 Inflection Point Scenarios, the Paradox of Rate Cuts, the U.S.-China Trade War, and the AI/ Semiconductor Checklist
The four key points that can be checked immediately in this article are:
1) The ‘signals’ that indicate the liquidity market is turning and the conditions for the inflection point in 2025~2026.
2) The mechanism by which rate cuts can actually hasten the end of the rally.
3) The tariff, labor, and inflation strategy of the Trump administration and the key drivers affecting stock prices in the U.S.-China trade war.
4) The actual supply chain variables that need to be checked in AI/semiconductors (Physical AI, HBM, GPU).
This article organizes the economic outlook, global stock markets, inflation, rate cuts, and the U.S.-China trade war together with today’s positioning.
News Briefing: Key Discussion Summary
The liquidity market ends when the ‘withdrawal of liquidity’ begins.
The turning point in market interpretation is not a rate cut but the reemergence of expectations for ‘re-hikes’ due to a re-ignition of inflation.
The period from 2025 to 2026 is seen as an inflection point created by the interaction of inflation, interest rates, and U.S.-China trade conflicts.
The Trump administration could prepare a framework to curb inflation by deliberately cooling the labor market through tariffs, immigration, and government efficiency measures.
An agreement between the U.S. and China can contribute to downside inflation by stabilizing prices of daily necessities and intermediates and mitigating supply chain risks.
However, if inflation re-ignites to the 5–6% range, there is a high possibility that the market will interpret the ‘rate cut → re-hike’ scenario as bringing an end to the liquidity market.
Even if the rate hike cycle begins, there is a historical pattern in which the stock market continues to rise for a while in the early phase.
2025~2026 Inflection Point Roadmap: Scenario Framing
Scenario A) Re-inflation occurs.
Rapid liquidity supply from a rate cut leads to a re-escalation of inflation as energy, wages, and tariffs combine.
In the period of rising market rates, credit stress and hidden leverage exposure emerge.
Scenario B) Managed disinflation.
A cooling labor market, a U.S.-China agreement, and energy management help curb prices, resulting in a ‘gradual rate cut → extended rally’.
Scenario C) Sudden employment cooling.
If employment cools sharply due to policy miscalibration and the delayed effects of tariffs, the resulting slowdown in demand leads to falling prices and a slowdown in the profit cycle.
Interest Rates and Inflation: How Can ‘Rate Cuts’ Hasten the End?
While rate cuts are favorable to liquidity, the problem lies in cutting rates when inflation has not sufficiently subsided.
Rate cut → rally in risk assets → asset effect → demand re-ignition → inflation re-escalation → re-hike expectations → valuation discounting.
If cash flows in highly leveraged areas cannot withstand this process, it can trigger systemic risk.
The four major indicators to check are:
– Supercore PCE (excluding services and housing) and break-even inflation.
– The re-pricing of the Fed path reflected in the OIS.
– Expansion of credit spreads (IG/HY) and a shortage in new issuances.
– The deepening of ‘bear steepening’ in the normalization process of long- and short-term rates.
U.S.-China Trade War: Tariffs Are a Means, Not the End
The goal is the reshoring of manufacturing and the recovery of strategic advantages, with tariffs serving as a negotiating lever.
Imports from China that consist largely of daily necessities and intermediates have a direct impact on U.S. prices.
A U.S.-China agreement works downward on inflation, while tariff conflicts work upward on inflation.
China’s leverage in rare earths, battery materials, and the refining of electronic materials related to HBM remains effective.
An extreme confrontation is costly for both sides and is likely to be avoided, although volatility in rhetoric can increase around election events.
Signals Indicating the End of Liquidity: Practical Checklist
– Threshold for Re-hike: Policy rates (or market rates) start to rise again along with a spike in private credit rates.
– Credit Warning: A rapid expansion in high-yield spreads, failing new issuances, and increased collateral requirements.
– Reignition of Inflation: Acceleration in supercore inflation, wages, and housing costs, with the 5-year 5-year BEI adjusting upwards and becoming entrenched.
– Policy Pivot Repricing: The OIS path shifts to ‘higher rates for a longer period’.
– Real Shocks: Sharp increases in energy and food prices, and supply chain disruptions (bottlenecks in rare earths, HBM materials, and CoWoS/advanced packaging).
– Leverage Exposure: Signs of rollover failures in private equity, real estate, and credit funding.
AI/Semiconductor Checkpoints: When the Quality of the Rally Changes
GPU capital expenditures continue, but ‘power, cooling, and packaging’ become a bottleneck that defines the ceiling of the cycle.
For HBM, the speed of supply increase and yield determine prices and margins.
The timeline for expanding capacity in advanced packaging such as CoWoS must be closely monitored.
The transition to Physical AI (on-device/edge inference) creates a segment where benefits spread to the memory, power semiconductor, and chiplet ecosystems.
Domestically, the key variables are SK Hynix’s HBM competitiveness, Samsung Electronics’ turnaround, and the speed of the packaging transition.
If NPU adoption spreads to mobile, PC, and server edge, it will be accompanied by re-acceleration in memory bit growth and improvements in product mix.
Positioning Guide for Korean Investors
While global stocks continue the liquidity rally, it is reasonable to increase the proportion of core assets in AI and semiconductors.
However, if signals of re-inflation and rate hikes appear, the duration risk of high-value growth increases.
At that time, within semiconductors, shift the focus to plays in HBM, packaging, and power infrastructure where supply constraints remain strong.
If won volatility increases, balance export-oriented companies with high earnings visibility and dollar assets.
Five Key Points That Are Rarely Addressed Elsewhere
1) Stablecoin-Treasury Loop.
When stablecoin reserves flow into short-term Treasuries and repos, the liquidity of the crypto rally and the short-term rate market can synchronize.
This loop serves as the ‘invisible driving force’ behind the rally in risk assets and can also act as an amplifier of price shocks during a reversal.
2) TGA (U.S. Treasury General Account) and Liquidity Waves.
Changes in the TGA shake up bank reserves and money market liquidity, creating short-term stock market risk on/off scenarios.
3) Watching Out for Bear Steepening.
Steepening driven by rising long-term rates directly pressures valuations and is unlikely to coincide with a reduction in credit margins.
4) Power Capacity as the Ceiling of the AI Cycle.
If the pace of expanding data center power and transmission infrastructure is slow, the gap between GPU orders and actual revenue conversion widens.
5) Bottlenecks in the Refining of Rare Earths and Advanced Materials.
Policy risks at the refining stage inherently carry an ‘all-stop’ risk for the automotive and electronics sectors.
Asset Strategies by Scenario
Soft Landing / Maintaining Disinflation.
– Equities: Increase exposure to core AI, HBM, and packaging, and select manufacturing stocks benefiting from diversification.
– Bonds: Gradually extend mid-to-long term duration, focusing on investment-grade credit.
Re-inflation / Rate Hikes.
– Equities: Realize some gains in high-value growth, and shift toward sectors such as infrastructure, power, energy, and those with stable cash flows.
– Bonds: Shorten duration and include inflation-linked assets.
Sharp Employment Cooling / Economic Slowdown.
– Equities: Increase allocations to defensive stocks, high dividend yield, and cash positions.
– Bonds: Extend duration, focus on high-quality credit, and prioritize liquidity management.
Checkpoint Calendar
– FOMC: Dot plot and pace of rate cuts.
– Wage and Service Inflation: Supercore PCE, employment reports.
– Tariff/Agreement Newsflow: U.S.-China talks, item-specific exemptions/reimpositions.
– Semiconductor Supply Chain: HBM capacity/yield, CoWoS lead times, data center power expansion plans.
One-Line Investment Comment
For now, assume a liquidity market, but if both the ‘re-inflation signal + rate hike’ checklist light up simultaneously, shift to a defensive stance.
AI and semiconductors remain core, but the decisive factor is also to monitor physical bottlenecks such as power, packaging, and HBM.
Restating the Key Insights from the Discussion
Liquidity does not end when it is fully deployed, but when it is withdrawn.
Rate cuts act as an accelerator for the rally, and in some cases, they can also trigger re-inflation.
The U.S.-China tariff situation is an immediate variable once it changes the direction of inflation.
Policymakers may cool employment to create an environment conducive to rate cuts.
Historically, even at the beginning of a rate hike cycle, stocks have continued to rise for a time.
Risk Management Memo
Reduce exposure to excessive leverage and reliance on rollovers.
Increase the proportion of assets with clear cash flows.
Calendar the transition moments of the ‘policy-inflation-interest rate’ loop to respond effectively.
Sources and References
The perspectives and figures presented in the discussion are based on the dialogue content, and investment decisions should be made at your own risk.
< Summary >
The inflection point in 2025~2026 arises from the interaction of inflation, interest rates, and U.S.-China conflicts.
Rate cuts do not guarantee safety.
If re-inflation signals appear, the market may bring forward the end of the liquidity market.
AI and semiconductors remain core, but physical bottlenecks such as power, HBM, and packaging must also be monitored.
The checklist includes inflation indicators, the OIS path, credit spreads, long-term rate steepening, and supply chain news.
[Related Articles…]
HBM Supply Chain and the Physical AI Power Bottleneck: The New Ceiling of the Semiconductor Cycle
*Source: [ 경제 읽어주는 남자(김광석TV) ]
– “유동성 장세, 언제까지 갈까?” 25년 하반기 ‘변곡점’ 시나리오. 미국의 금리 인하가 랠리의 끝을 부추기나 | 경읽남과 토론합시다 | 이선엽 대표 2편