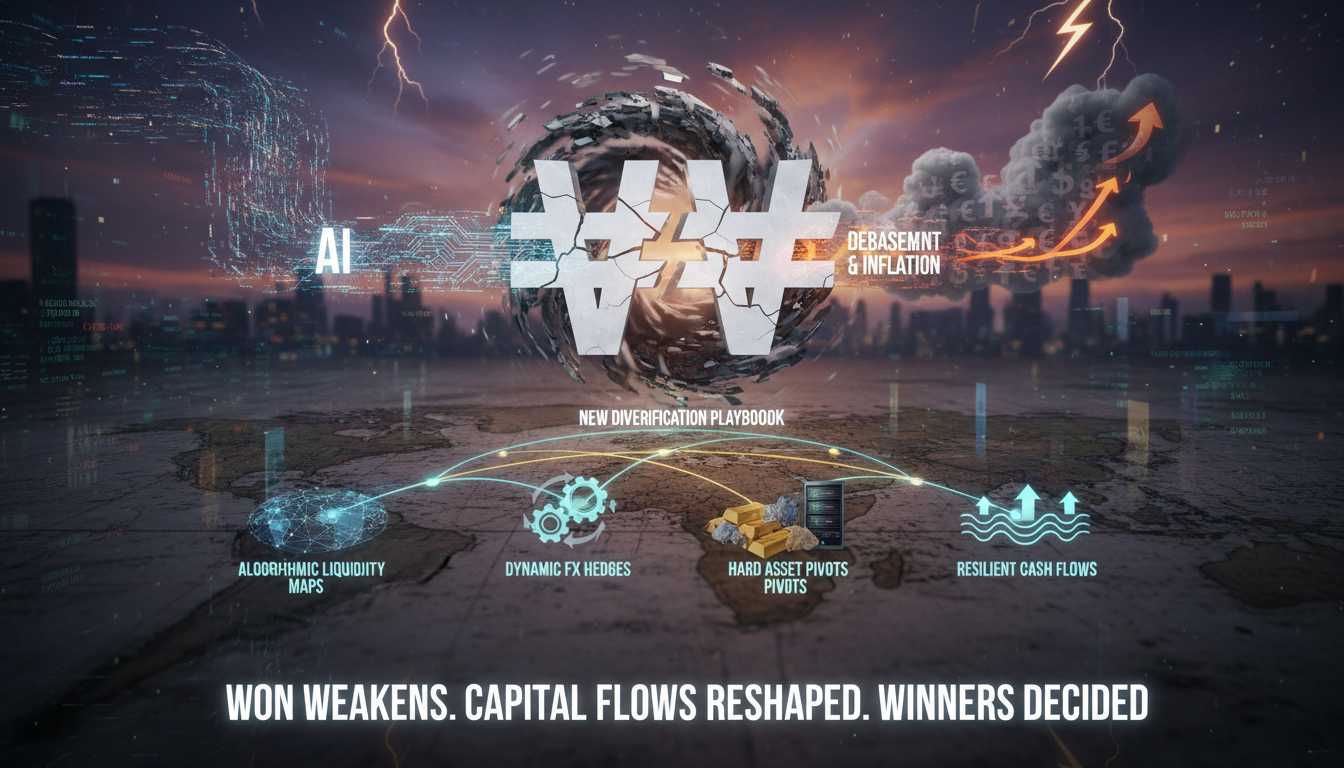
● Debasement Panic Sparks Retail Stock Stampede, Won Collapse, AI-Driven Inflation Surge
The True Reason Behind the ‘All-Time High’ Stock Investment Ratio Among Low-Income Households, and an Investment Strategy Covering Debasement Trade, Defending Against a Weakening Won, and the AI Trend All at Once
Even middle- and low-income groups have been pouring into the stock market, explained through inflation, interest rates, exchange rates, and the flow of dollars.
This text covers why an “unprecedented market” emerged this year where both gold and stocks rose simultaneously.
It also explains how individuals can practically defend against a weakening won, covering portfolio construction and tax-saving structures.
Moreover, it discusses how the AI trend is delivering secondary shocks to inflation, economic activity, and asset prices—all in one piece.
One-Line Briefing
The entry of low-income groups into the stock market is less about speculation and more about a survival investment strategy to “defend against the decline in currency value.”
Policy-driven liquidity, chronic fiscal deficits, and abundant dollar liquidity have made debasement trade the standard strategy.
As the won’s weakness becomes structured, managing exchange rate risk has become an essential part of retirement asset planning.
The AI trend is acting as a directional guide for the investment cycle by altering the structure of inflation and the demand for power and capital goods.
What Is Happening: Data and Phenomena
The stock ownership ratio among middle- and low-income households has risen to an all-time high.
In the past, households that “earned each month and spent it that month” had low participation in the stock market, but recently, participation for retirement preparation and protection of real income has surged.
The primary cause is a combination of complex inflation and declining purchasing power from stagnant wages.
Major countries such as the United States, Europe, and Japan have repeatedly cycled through “money printing → side effects → easing,” making it difficult to quickly reduce fiscal spending and liquidity.
This trend has increased dollar liquidity, resulting in a peculiar market where both risk assets and real assets are simultaneously favored.
Consequently, environments in which safe assets such as gold and silver and the stock market strengthen simultaneously are increasingly observed in a setting where “only cash is losing.”
Why Now: The Rise of Debasement Trade
Debasement trade refers to a strategy of diversifying into real assets and alternative investments to guard against a decline in currency value.
When government fiscal expansion and loose monetary policy persist over the long term, the timeframe during which the real value of cash erodes is extended.
Instead of “holding” cash, investors are building their defense by converting cash into gold, silver, blue-chip stocks, real estate, infrastructure, and some digital assets.
The simultaneous rise of gold and stocks this year was a signal that the default strategy has tilted toward “reducing cash.”
A Point of Pain for Korean Investors: Won Weakness and Exchange Rates
The won has been weak against major currencies like the dollar and euro for an extended period, making exchange rate risk a long-term variable.
While investors in overseas assets naturally benefit from currency exposure, those holding assets exclusively in won find it difficult to protect their real purchasing power.
For retirement asset planning, the exchange rate should be treated not as a ‘rate of return’ but as a means of ‘risk diversification.’
Practical Solution 1: Aligning Account Structures and Tax Savings
Tax credits and tax exemption play a key role in accelerating the power of compounding.
- Priority on pension savings and IRP: Boost real returns through tax credits using the same rate of return.
- Boundary for comprehensive financial income taxation: When the total of interest and dividends exceeds 20 million won annually, comprehensive taxation and increased health insurance premiums may occur.
- Structuring the timing of pension receipts: Manage tax brackets through the design of receipt amounts, durations, and account diversification.
- Utilizing pension insurance and whole life annuities: Secure options for tax exemption and tax burden reduction when meeting conditions such as maintaining the account for over 10 years.
- Dollar-denominated pension insurance and overseas ETFs: Aim to defend against a weakening won while achieving global diversification. Be sure to check each product’s hedging on currency, operating expenses, and investment options.
Practical Solution 2: A Roadmap for Portfolio Construction
The goal is to “defend against the decline in cash value” and cushion against exchange rate and inflation shocks.
- Core (around 60%): A blend of global blue-chip stock indices (such as the S&P 500, MSCI World, etc.) and high-quality investment-grade bonds.
- Satellite (around 30%): Enhance the portfolio’s defense against inflation through precious metals like gold and silver, energy/resources, global infrastructure, and dividend stocks.
- Cash/Stable Assets (around 10%): Use dollar-denominated short-term bonds, T-Bills, and MMFs to absorb volatility and serve as opportunity funds.
- Exchange Rate Management: Balance between ETF options with currency exposure and those with hedging strategies to maintain equilibrium between the won and the dollar.
- Execution Rules: Set up automated rules such as monthly regular investing (DCA), quarterly rebalancing or a 5% band on either side, and filling pension accounts during sharp declines.
Key Points Highlighted in a News Format
- Headline: With the joining of middle- and low-income households in the stock market, defending against the decline in currency value has emerged as the top investment motive.
- Trends by the Numbers: There is an enhanced positive correlation between gold and stocks, and a structured shift from cash to alternative assets is evident.
- Policy Message: Fiscal stances are unlikely to switch to tightening quickly, thereby increasing the “cash holding penalty.”
- A Korean Exception: Accumulated won weakness has heightened the importance of overseas diversification and defending against exchange rate risks.
- Action Plan: Prioritize tax-advantaged accounts, include assets with currency exposure, and boost the allocation to sectors that resist inflation.
Other Critically Important Points Rarely Mentioned Elsewhere
- Change in Structural Correlations: In a phase of fiscal supremacy, government bond yields and inflation expectations rise together, and simultaneous strength in gold and stocks occurs more frequently. The binary safe/risky dichotomy becomes less effective.
- Impact of Monthly Investment Cycles: As the proportion of low-income households making monthly regular contributions increases, funds entering at the beginning or end of the month can temporarily distort the prices of specific indices or ETFs. Consider setting up your automatic transfer calendar differently to distribute systematic buying timing.
- Health Insurance Premium Variable: After retirement, if financial income exceeds a certain threshold, costs outside of pension income can increase exponentially. The method of receiving funds and account diversification greatly influence actual living expenses.
- AI’s Pressure on “Power and Capital Goods”: The spread of generative AI boosts long-term demand for data centers, power infrastructure, and semiconductor equipment, potentially raising the floor for inflation. Focus on the “structure” of inflation rather than its “temporariness.”
- The Role of Foreign Currency Cash: In periods of high interest rates, short-term dollar bonds and T-Bills function as “alternative cash substitutes.” They allow you to secure both defense against a weakening won and interest income simultaneously.
The Impact of the AI Trend on Asset Markets
- Expansion of Excess Profits in Semiconductors: Beyond GPUs, profit pipelines are expanding into memory, networking, power semiconductors, HBM, advanced packaging, and thermal management.
- Cycles of Power and Raw Materials: Increased power demand from data centers bolsters the structural demand for capital goods and raw materials such as power plants, transmission and distribution facilities, transformers, and copper. This reinforces the structural characteristics of inflation.
- Software/Agents: In the financial sector, AI-driven advisory, rebalancing, and automated risk monitoring are becoming common, increasing pressure to perform relative to fees. The polarization between low-cost indexing and thematic investing is deepening.
- Tokenization (RWA): The on-chain tokenization of short-term government bonds and MMFs is expected to grow rapidly from 2024, emerging as a cash-like alternative that supports small-scale, real-time, 24/7 transactions. This broadens the definition of cash and accelerates liquidity.
- Investment Implications: AI stimulates both a growth premium and an inflation premium. It is reasonable to hold both growth stocks and real assets/infrastructure simultaneously.
ETF and Product Checklist
- Index Selection: Structure your portfolio by layering indices such as the S&P 500, Nasdaq-100, MSCI World/ACWI, global dividend, global infrastructure, investment-grade bonds, short-term bonds, and physical gold.
- Currency Hedging: Strike a balance between won-based returns and dollar exposure. Combining ETFs with currency exposure and those with hedging within the same index enhances cushioning capabilities.
- Cost Structure: Always verify total fees, tracking error, liquidity, and taxation frameworks.
- Priority on Pension Accounts: First fill up the tax credit limit with pension accounts, then expand to general accounts.
- Variable/Dollar Pension Insurance: Compare operating expenses, fund lineups, switching rules, and tax exemption conditions (e.g., maintaining the product for over 10 years) for each product.
Risk Matrix: Variables That Must Be Considered
- Reemergence of Dollar Strength: In a global economic slowdown, a reemergence of dollar strength may occur. Adjust the proportion of your portfolio’s currency hedging flexibly.
- “High-and-Long” Interest Rates: If expectations for declining interest rates are delayed, volatility in valuation-sensitive stocks may increase. Short-term bonds and cash-equivalents serve well as buffers.
- Geopolitical/Energy Issues: Shocks to energy supplies could trigger a second wave of inflation. Maintain strategic exposure to raw materials and infrastructure.
- Household Debt Leverage: Reduce exposure to leveraged assets that are sensitive to interest rate fluctuations and design repayment schedules conservatively.
- Policy/Tax Changes: Regularly monitor changes in pension and insurance taxation regulations. Diversify the mode of receipt to mitigate regulatory risks.
30-Minute Action Checklist
- Check your estimated national pension benefit to quantify any “shortfall.”
- Automate monthly deposits for your pension savings and IRP contributions.
- Build a core portfolio based on 3–4 ETFs covering overseas indices, gold, short-term bonds, and infrastructure.
- Start with approximately a 50/50 mix of currency-exposed and hedged assets, then adjust based on volatility.
- Finalize the timing and diversification of pension receipts through simulations that consider the 20 million won threshold for financial income.
- Maintain 5–10% in dollar cash-equivalents (short-term bonds/T-Bills) to secure opportunity funds.
Note: Sponsor Background and Tips for Utilizing Products
Global insurance companies offer long-term capital management expertise and a diversity of products that provide solutions based on pensions, protection, and overseas currencies.
Dollar-denominated whole life/annuity insurance products can be employed as tools for defending against a weakening won and optimizing tax burdens.
However, it is crucial to compare operating expenses, surrender charges, investment options, and currency hedging features, aligning them with your personal cash flow.
Final One-Liner
The current surge in stock market participation is not about “chasing opportunities” but a collective response to “defend purchasing power.”
It does not signal the end of the cash era, but rather that cash must be deployed more intelligently.
Realign your portfolio along the lines of inflation, interest rates, exchange rates, and the dollar, and ride the new cycle ushered in by the AI trend with balance.
< Summary >
- The influx of even low-income groups into the stock market is driven by the need to defend against the decline in currency value.
- Debasement trade follows the core principle of reducing cash and expanding into real and global assets.
- As the won’s decline becomes structured, the importance of currency-exposed assets and dollar cash equivalents has grown.
- Prioritize pension savings/IRP, watch out for the 20 million won threshold on financial income, and manage both tax burdens and exchange rates with pension insurance/dollar pensions.
- AI is boosting the demand for power and capital goods while reshaping the structure of inflation. Holding both growth stocks and real assets simultaneously is rational.
[Related Articles…]
- Debasement Trade Era: A Practical Portfolio to Defend Against a Weakening Won
- Soaring Demand for AI Power: What Will Rise After Semiconductors?
*Source: [ 소수몽키 ]
– 저소득층 주식투자 비율 역대 최대, 화폐가치 하락이 만든 기이한 현상
● Liquidity Timebomb, Tech Turmoil
The Real Cause of Tech Stocks Correction Is Not the “AI Bubble,” But “Dangerous Liquidity”
This article covers the structure behind the drastic rises and falls of tech stocks, the true issues behind the AI bubble theory, the lifespan of a liquidity-driven market, the facts and myths of data center overinvestment debates, and a checklist investors need to review immediately.
It particularly explains the “microstructure of liquidity” and the AI earnings pipeline that connects data centers, power, and semiconductors with numbers—something not well covered by other media.
News Summary Points
The bull market persists, but volatility has increased.
The AI bubble theory is not a trigger for the plunge but more of a narrative emerging in times of uncertainty.
The recent correction is primarily driven by political and macroeconomic uncertainties and liquidity fluctuations that provoke a risk asset flight.
AI remains a structurally growing trend based on earnings, and orders and revenues, transitioning from data centers to power, then GPUs, memory, and software, are becoming visible.
The investment solution is “rebalancing within a liquidity market” and “selecting based on cash flow.”
The Mechanics of a Liquidity-Driven Market: Why It Rises but is More Turbulent
Liquidity creates a bull market.
However, the same inflow of funds can amplify volatility depending on where it is concentrated.
The current global economy’s “dollar liquidity” continues to show a net increase, which underpins the upward trend in the stock market.
At the same time, elevated interest rates and persistent inflation, albeit not completely subdued, result in exaggerated moves in algorithmic and derivative positions triggered by news events.
In other words, both liquidity and volatility are increasing simultaneously.
This combination is what we call “dangerous liquidity.”
Checklist for the AI Bubble Theory: Distinguishing Claims from Facts
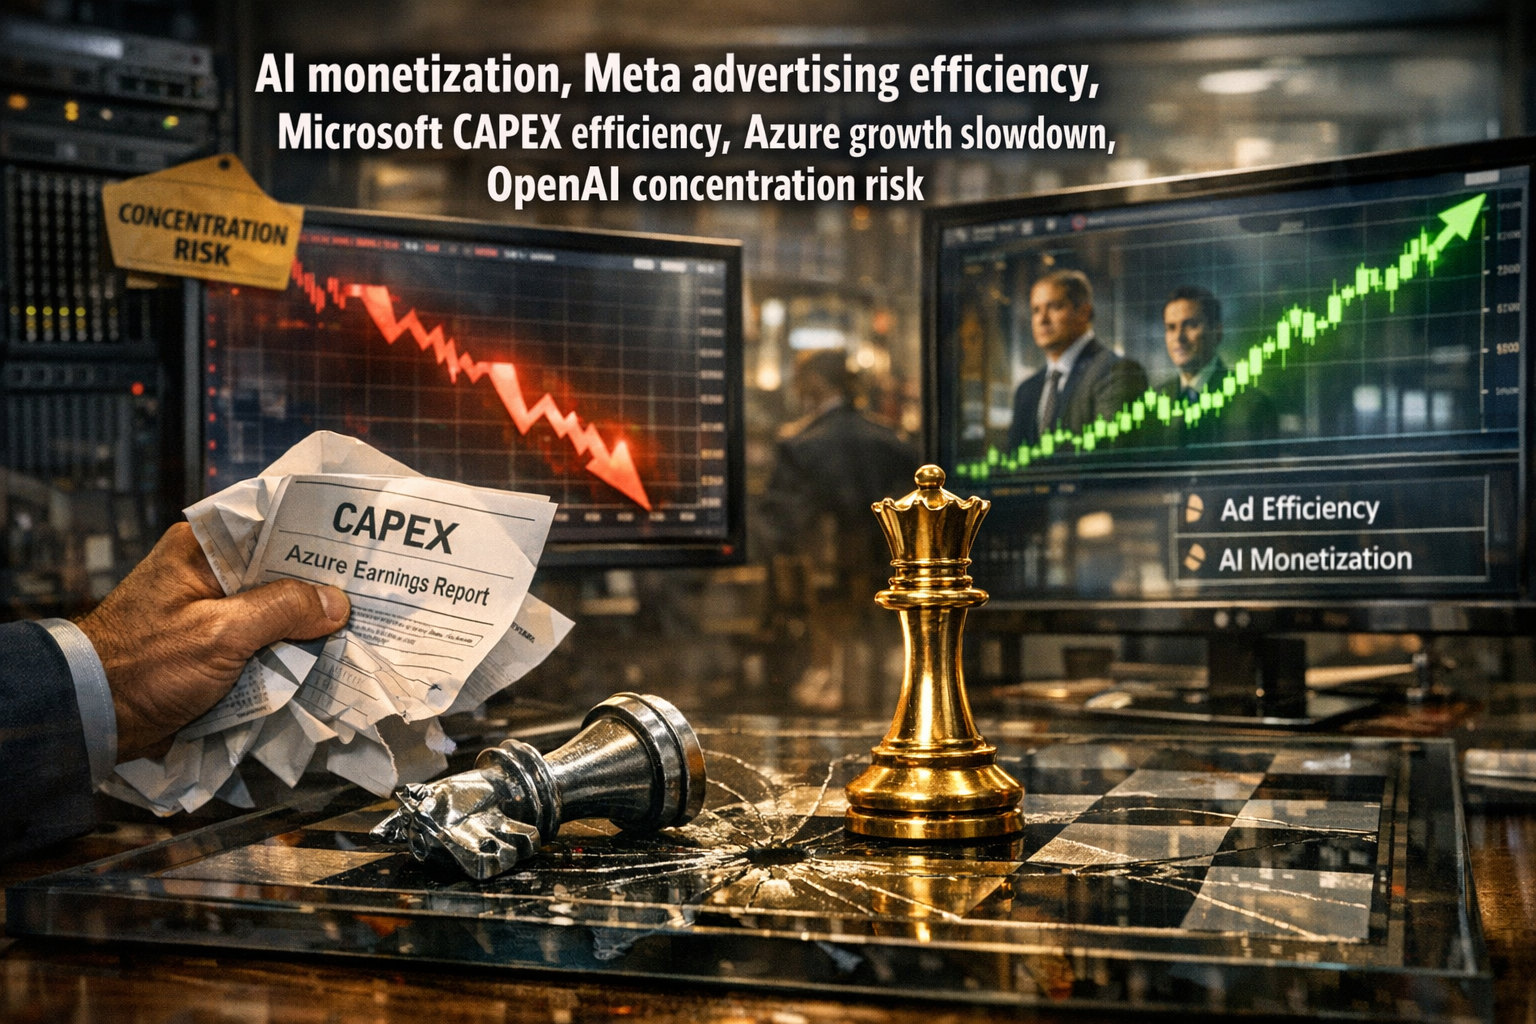
Claim 1) The concentration risk in big tech (a sharp rise in the M7 weight) proves the existence of a bubble.
Fact) When evaluating an increase in index weight, one must consider whether there is a corresponding rise in earnings weight.
Over the past two to three years, AI demand has been incorporated into earnings estimates through GPUs, HBM memory, power contracts, and cloud capex guidance.
Claim 2) Overinvestment in data centers is similar to the overinvestment in optical cables during the dot-com bubble.
Fact) At that time, there were limited applications and no supporting revenue model.
Now, the adoption of generative AI is connected broadly to search, advertising, cloud, enterprise software, and the semiconductor ecosystem.
Data center investments and actual revenue recovery occur concurrently, with GPU utilization and power PPA contracts remaining at high levels.
Claim 3) Circular investment structures distort reality.
Fact) Strategic cross-shareholding and customer–supplier relationships are common governance structures in big tech industries.
The key is whether the indicators such as orders, deliveries, and usage are actually generating revenue.
Cloud providers’ capex spending, GPU lead times, and usage for model training/inference have all steadily expanded.
Claim 4) The PER is too high.
Fact) In the early stages of high growth, the distortion of past earnings (the denominator) is significant.
The debate over overvaluation should compare “the pace of earnings growth” versus “the pace of stock price growth.”
If upward revisions in quarterly guidance and improved margin structures accompany it, high multiples can be normalized.
The True Trigger of the Correction: Political and Macro Uncertainties
The recent downturn was not due to issues in specific companies but was largely driven by the simultaneous exposure to uncertainties that triggered risk asset flight.
For example, major political event verdicts and policy variables, data gaps due to the risk of a U.S. government shutdown, and fears of increased Treasury supply leading to heightened interest rate volatility.
When interest rates and the dollar fluctuate, tech and AI-leading stocks with large positions are the first to be hit.
For the same reason, they are the first to rebound.
Thus, while the narrative of the “AI bubble” appears as the cause of the correction, in reality, it is the beta shock created by liquidity, interest rates, and the dollar.
The Reality of AI Promising Growth: A Structural Expansion Seen Through the Earnings Pipeline
Demand Line 1) Data Centers.
Hyperscalers are increasing their annual cloud capex guidance by raising the AI component.
Demand Line 2) Power.
The global expansion of large-scale PPAs and substation capacity extensions suggests that power constraints are not in surplus but rather a basis for continued expansion.
Demand Line 3) Semiconductors.
Tight supplies of GPUs and HBM, along with parallel capacity expansions in advanced packaging (such as cutting-edge CoWoS), are underway.
Demand Line 4) Software/Enterprise.
Products like Copilot that boost productivity, along with high value-added AI workloads in demand forecasting, security, and healthcare, are shifting toward subscription revenue and usage-based billing.
Conclusion) The revenue pipeline connecting data centers to power, then GPUs/memory, and finally platforms/apps is not linear but unfolding simultaneously on multiple fronts.
Key Points Overlooked By the Market (Aspects Other Media Rarely Discuss)
First, the microstructure of liquidity.
Changes in the Treasury General Account (TGA), reverse repurchase (RRP) balances, and the flows in central bank balance sheets determine the resilience of risk assets.
When these indicators improve, declines are limited even with bad news, and when they deteriorate, upward movements are dampened even with good news.
Second, the bond between power and semiconductors.
Power supply constraints are not merely a brake on short-term overheating but are a “hard cap” on continuous investment and the basis for pricing power.
The profitability outlook improves for companies securing power and those that have secured foundry/packaging capacity.
Third, the economics of inference.
As the workload mix shifts from training to inference, there is an improvement phase in GPU utilization and software margins.
This change is viewed as “sustainable cash flow.”
Investment Strategy: Rebalancing Guidelines in a Liquidity-Driven Market
Strategy 1) The baseline is “bull market maintenance with expanded volatility.”
The basic approach is to add gradually when declines deepen and adjust overweight positions when rebounds gain momentum.
Strategy 2) Select based on cash flow.
Within the AI theme, build a core portfolio centered on semiconductor materials/packaging, power/cooling, and high value-added software that are supported by strong cash flows.
Strategy 3) Barbell.
Combine a growth core (focused on AI infrastructure/platforms) with a defensive barbell (quality, essential consumption, and liquid holdings).
Strategy 4) Hedge.
Before and after policy events, consider partial hedges based on the dollar, duration, or options to buffer volatility.
Data Watchlist: The Truly Critical Indicators for This Cycle
Liquidity: TGA, RRP, global central bank liquidity (especially dollar liquidity).
Interest Rates/Credit: U.S. Treasury auction demand, long/short-term rate expectations, credit spreads.
Demand Check: Hyperscaler capex guidance, GPU lead times, cloud usage indicators.
Power: Trends in PPA contracts, approvals for substation expansion, regional electricity rates.
Earnings: S&P EPS revisions, margin guidance, industry-specific order–shipment–inventory data.
Positioning: Option gamma, CTA positions, breadth (proportion of advancing stocks).
Risks and Disconfirmation Scenarios
Risk 1) If policy uncertainties persist, leading to rapid surges in interest rates and the dollar.
Risk 2) If the relaxation of power and packaging bottlenecks is delayed, worsening supply disruptions.
Risk 3) If the pace of AI demand transition is slower than the guidance suggests.
Disconfirmation 1) If monthly/quarterly guidance revisions upward and pre-orders for power/facilities remain steady, the “bubble” narrative will weaken.
Disconfirmation 2) If global economic inflation subsides and interest rates stabilize, there will be renewed room for multiple expansion.
Conclusion: Shaping the Era, Manage Volatility
At present, volatility is increasing as an extension of the liquidity-driven market phase.
The AI bubble narrative is merely a convenient explanation; as long as earnings and demand chains remain intact, the structural growth axis remains valid.
Political and macro variables serve only as triggers, and investors should concentrate on rebalancing by verifying the “facts” through liquidity indicators and the earnings pipeline.
As long as the global economic environment does not undergo a complete transformation, this correction is likely to present strategic opportunities.
Always monitor key indicators: economic outlook, inflation, interest rates, liquidity, and the dollar.
< Summary >
The bull market persists, but volatility has expanded.
The essence of the correction is not the AI bubble, but “dangerous liquidity” and policy/macroeconomic uncertainties.
The AI earnings pipeline, spanning from data centers to power, semiconductors, and software, is being confirmed.
Monitor liquidity, interest rates, dollar indicators along with power and GPU demand indicators, and respond through rebalancing strategies.
[Related Articles…]
- The Truth of a Liquidity-Driven Market: 2026 Economic Outlook Key
- AI Infrastructure Investment Cycle: Data Centers vs. Demand
*Source: [ 경제 읽어주는 남자(김광석TV) ]
– 테크주 조정? AI 버블은 핑계일 뿐… AI 주도주의 급등락, 시장을 흔드는 진짜 원인은? | 클로즈업 – 칠판강의 1편