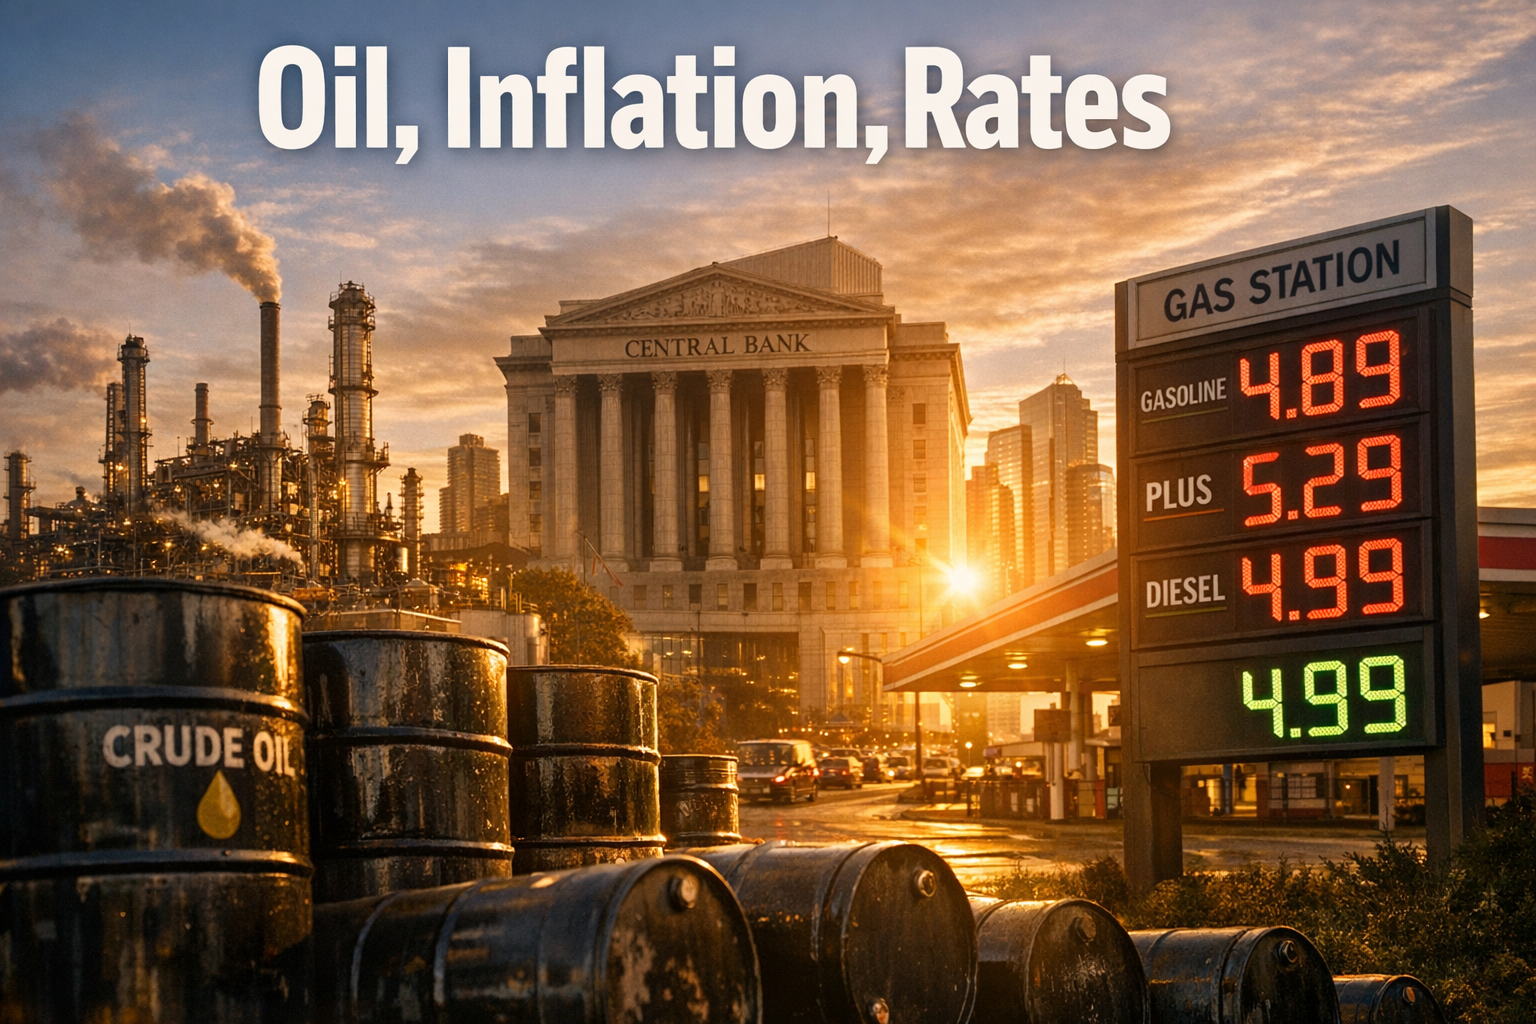
● Dollar Debasement, Liquidity Tsunami
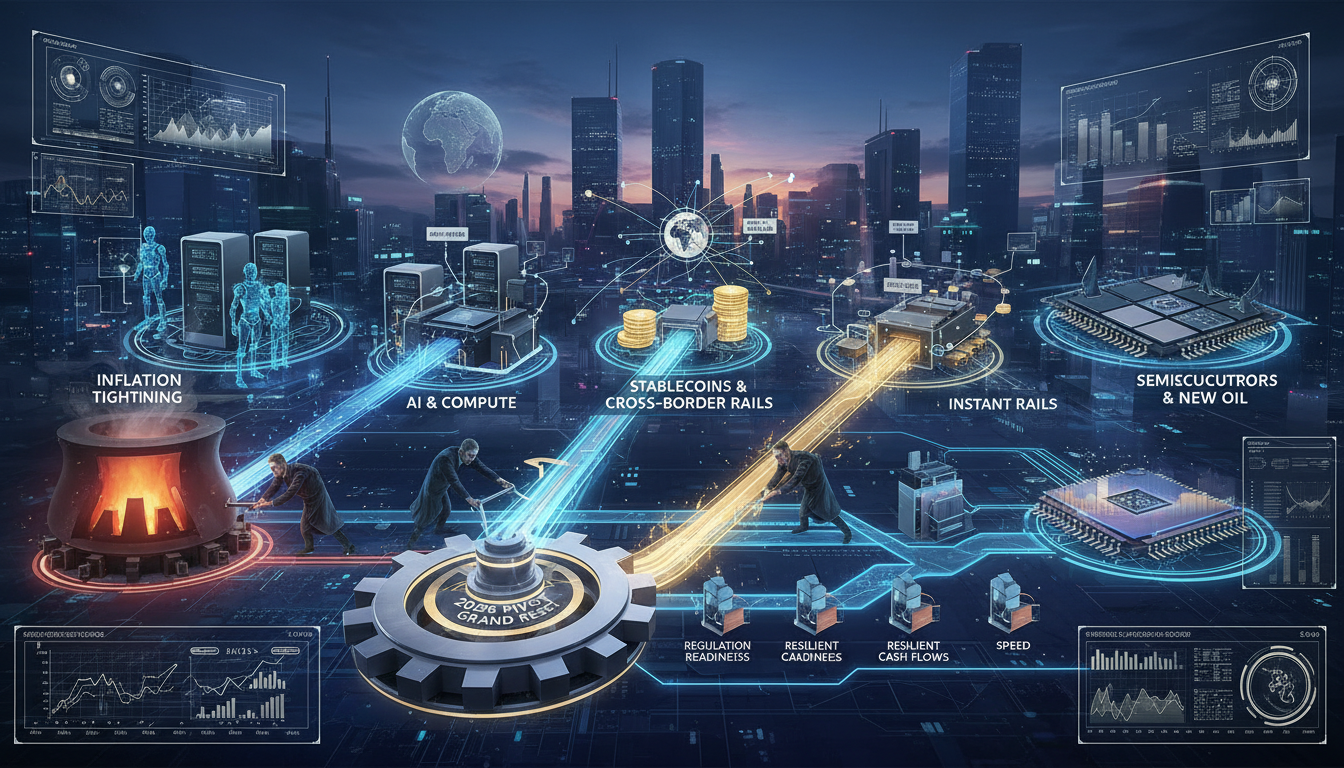
2026 Pivot Era, What Rises and Why: A Global Economic Outlook and Practical Checklist Viewed Through Interest Rate, Exchange Rate, and Trump Strategy
We Start by Highlighting the Core Points in Today’s Article
The period 2024-2026 is summarized in one chart as a pivot cycle where interest rate cuts and liquidity injections converge.
It structurally explains why the core economic tactic of Trump 2.0—the “dollar debasement” (downgrading the value of money)—triggers both rising asset markets and a weakening dollar.
It introduces the “Inflation 5% Rule” as an exact signal for the end of the liquidity boom and provides a checklist of the sequence in which the market actually reverses.
It plainly and realistically explains the mechanism by which the end of quantitative tightening and the supply of stablecoins practically operate as “shadow liquidity.”
It provides a practical portfolio map detailing which sectors remain resilient when AI trends combine with liquidity, and which factors become risks as prices heat up.
News Briefing: 2024-2026 Pivot Cycle, The Direction of Money Changes
According to the key points, 2020-2021 was an easing phase, 2022-2023 was a tightening phase, and 2024-2026 will be a pivot phase.
During the pivot phase, interest rate cuts are progressively implemented, and asset recovery precedes due to net liquidity increases.
Assets react to liquidity before the economy does, often propagating in the order of stocks → real estate → the real economy → prices.
The economic strategy of the Trump 2.0 scenario is summarized as a “debasement” package, including the gradual weakening of the dollar, accelerated policy rate cuts, and the expansion of stablecoins.
The end of the liquidity boom is highly likely signaled when inflation exceeds 5%, at which point the market reassesses that “further interest rate cuts are difficult.”
Trump 2.0’s Debasement Strategy: A Tri-Force of Interest Rates, Exchange Rates, and Liquidity
The core of the strategy is to increase liquidity to stimulate asset prices and enhance the perception of real wealth, thereby securing political support.
The policy tools are summarized in three components.
1) Accelerating interest rate cuts to ease financial conditions.
2) Increasing private-dollar supply capacity through the institutionalization and expansion of the stablecoin market.
3) Positioning that targets both export gains and asset effects through a weakening dollar.
This combination represents a classic liquidity phase in the global economic outlook, triggering a drop in risk asset premiums and a re-rating of multi-assets.
End of Quantitative Tightening and “Shadow Liquidity”: Why the Market is Sensitive
The end of quantitative tightening means that the central bank’s balance sheet contraction stops, which by itself implies less tightness in net supply.
When this is combined with money market funds, reverse repos, TGA, and stablecoin issuance, additional liquidity that is not captured by traditional monetary indicators flows into the asset market.
In conclusion, interest rate cuts + an end to QT + an increase in stablecoins produce an effect akin to “opening three taps simultaneously.”
Liquidity Boom Termination Signal: The Inflation 5% Rule and Auxiliary Indicators
The key criterion is whether headline or core inflation re-enters the 5% range.
Within this range, the justification for further rate cuts by the Fed is undermined, and the market preemptively reflects a “re-pivot (back to hawkishness)” in policy.
The auxiliary checklist is as follows.
• Whether the annualized three-month cumulative inflation rate is moving toward the 5% range.
• Whether expected inflation (long-term BEI) becomes anchored at 2.8% or higher.
• Whether wage indices (such as the Employment Cost Index) are heating up above 4.5%.
• Whether oil prices remain persistently in the high $90 to $100 range for 2-3 months.
• Whether service prices (housing, healthcare, insurance) show downward rigidity.
Asset-Specific Strategy Roadmap: Aligning with the Pivot Cycle
Stocks.
In an upward trend, a “buy on dips” approach is effective.
Core sectors include liquidity and earnings-driven segments such as AI infrastructure (semiconductors like HBM, ASIC, AI GPU, power, cooling, data center REITs), industrials (power grid, automation), and software (models, agents, security).
Bonds.
During interest rate cut phases, duration sensitivity increases, but keeping in mind the risk of price re-heating in 2026, risks are diversified through a mix of medium-term and high-quality credit baskets.
Dollar/Exchange Rates.
A weakening dollar trend can boost emerging market currencies and a stronger Korean won accompanied by capital inflows.
However, during periods of renewed inflation or security events, adjust the proportion of dollar risk hedges flexibly.
Commodities/Gold.
In a liquidity boom, tangible assets such as gold, silver, and copper become relatively attractive.
The strength of gold mirrors the “decline in the value of money.”
Real Estate.
When interest rate cuts are paired with a weakening dollar, prime location and cash-flow-oriented assets recover first.
However, regional supply and policy variables must be monitored separately.
Crypto/Stablecoins.
Expansion of stablecoins provides a rapid pipeline for dollar liquidity.
Since managing policy risks and volatility is crucial, emphasize cash conversion ease and on-chain liquidity indicators.
AI Trends x Liquidity: The Axis of Outperformance for 2025-2026
The AI supercycle expands the impact of real investment to data center CAPEX, power infrastructure, network equipment, and cooling solutions.
The liquidity boom allows for multiple expansion in valuations, helping to sustain premiums in AI-related stocks.
At the same time, increases in power costs, server prices, and labor shortages could push service prices, so a “modest structural inflation driven by AI” must be monitored.
There are three strategic points.
• Core hold on components directly driven by artificial intelligence demand (memory, HBM, advanced packaging).
• Increasing the pick-and-shovel weight in power grids, substation facilities, cables, and cooling equipment.
• Securing structural growth beta in AI security, data governance, and privacy solutions.
Policy Timeline and Risk Map
2025.
This is the phase to observe the pace of interest rate cuts and the impact of ending QT.
If the weakening of the dollar proceeds gradually, stocks and credit could both show strength.
First half of 2026.
The re-heating of inflation will serve as a turning point.
Approach preparedness for weakening cyclical buying in stocks and increased long-term bond volatility as the 5% rule nears.
Policy Risks.
Constantly monitor policy risks such as renewed tariff/trade tensions, Middle Eastern/shipping disruptions, energy/power bottlenecks, and regulatory factors affecting big tech/crypto.
Action Checklist: Conditions Where “Buy on Dips” Works
• Check that interest rate cuts are underway and that the Financial Conditions Index is moving in an easing direction.
• Verify that the Dollar Index is trending downward or sideways, and that a weakening dollar is stimulating emerging market flows.
• Maintain a risk-on stance if inflation remains stable in the 3-4% range.
• As the trend moves toward the 5% rule, gradually reduce stock exposure and buffer with cash/short-term bonds.
• Maintain as core holdings sectors where liquidity meets performance, such as AI, power, infrastructure, and metals.
A Collection of Points Not Often Covered in Other YouTube/News Sources
1) The “quality” and pathways of liquidity are important.
Besides the superficial liquidity provided by the Fed, it is necessary to track which markets (stocks/crypto/credit) money market funds, reverse repos, TGA, and stablecoins are actually flowing into.
These pathways determine the leading sectors.
2) The double-edged effect of AI excess CAPEX.
While it drives growth, it can also push service prices through power, equipment, and labor constraints.
Hence, risk management is needed under the notion that “strong AI = a slight accompanying upward risk in prices.”
3) Stablecoins have the nature of “private QE.”
Expansion in issuance under regulation accelerates payment and fund transfer speeds, sensitizing risk asset chains.
Focusing solely on traditional monetary indicators may cause you to miss the timing.
4) A weakening dollar is not linear.
Short-term surges frequently occur on single lines of inventory buildup, energy shocks, or a line of tariff news.
Design your currency hedges to be “always-flexible.”
Conclusion: Distinguishing the Era Clarifies the Prescription
In times of easing, increase asset exposure; in times of tightening, hold more cash; and in pivot phases, the strategy of “buy on dips” is effective.
A scenario in which the liquidity boom continues until 2026 is highly likely, but if the Inflation 5% Rule is approached, be prepared to hit the brakes.
Following the three pillars of liquidity, interest rate cuts, and a weakening dollar, it becomes clear why multiple asset classes can rise simultaneously.
< Summary >
2024-2026 is a pivot cycle during which interest rate cuts and liquidity drive asset re-rating.
Trump 2.0’s debasement strategy is summarized as a combination of a weakening dollar, expanded stablecoins, and policy rate cuts.
The termination signal of the liquidity boom is a re-entry of inflation above 5%, and until that point, “buy on dips” remains effective.
Since AI trends stimulate both growth and prices, core positions should be focused on AI infrastructure and power grids/security, while constantly monitoring the inflation re-heating risks.
[Related Articles…]
2026 Pivot Era Investment Strategy Checklist
Stablecoins and Dollar Debasement: A New Path for Liquidity
*Source: [ 경제 읽어주는 남자(김광석TV) ]
– [풀버전] 금리·환율·트럼프 전략으로 본 2026 경제 시나리오 “돈의 방향이 바뀐다” 모든 자산이 오르는 이유 | 클로즈업 – 교보문고 강연
● KOSPI Bubble Alert, AI-Fueled Mirage
KOSPI Bubble Check, A Complete Summary of the End of the Two-Stage/Three-Stage High Tones and the AI Cycle
The core logic behind the debate on the KOSPI 4,000, the two-stage/three-stage high tone pattern, Samsung Electronics’ relative strength signals, the meaning of the biotech rally, trader positions, the AI semiconductor cycle, interest rate and exchange rate variables, and even a checklist for practical risk management are all included.
In particular, it also covers early bubble warnings such as “participant saturation” and “regional economy-index divergence,” which are rarely mentioned elsewhere.
It naturally connects keywords of the global economic outlook, AI investment, inflation, interest rates, and exchange rates so you can check your position now.
Today’s Key Points in Market News Format
– The KOSPI has passed the two-stage high tone region, and for the three-stage high tone, actual performance and fundamentals are necessary.
– Historically, three consecutive periods of comparable increases are rare, and during those times there was the common factor of a “truly good” economic sentiment.
– At present, while the index is strong, local self-employed sentiment and consumer perception remain weak, clearly indicating a “liquidity-led” trend.
– The key to extending the two-stage high tone has been when Samsung Electronics and SK Hynix outperform the index, and indeed they have driven the index’s acceleration.
– When biotech emerges as the leading sector, many traders interpret it as a signal of late-stage rotation.
– Domestic retail investor inflows are already nearing saturation, so the momentum for additional inflows is limited.
– In practical trading, the most effective principle is to “buy on the first rebound after a sharp drop, reduce your position upon a box bottom break, and exit when support turns into resistance.”
– The AI semiconductor cycle is directly linked to the performance of domestic leading stocks, and interest rate, exchange rate, and dollar trends enhance valuation volatility.
KOSPI: Is It a Bubble or an Extended Rally?
Viewpoint 1: Liquidity vs. the Real Economy.
While the index has been led by liquidity, many argue that the virtuous cycle of real economic performance and the net profits of listed companies has not yet been sufficiently confirmed.
Viewpoint 2: The History of Two-Stage/Three-Stage High Tones.
Cases of three consecutive comparable rises are rare, and during those times, export-driven industries were leveling up to the global top tier, marking a period of palpable prosperity.
Viewpoint 3: Divergence Between Consumer Sentiment and the Index.
Weak local real estate, self-employment, and job conditions are interpreted as a typical signal of a liquidity market where “only the index is high.”
Viewpoint 4: Participant Saturation.
The recovery of participants who previously rushed in creates an “exit sentiment” rather than enthusiasm.
This is common sentiment in the later stages of a rally.
Scenarios.
– Extended Rally: Semiconductor earnings surprises and the AI investment cycle continue, accompanied by falling interest rates and stable exchange rates.
– Top-Heavy/Box: If the divergence between fundamentals and supply-demand is not resolved, the rally extends as a sector rotation.
– Fatigue Correction: If the box bottom breaks and leading stocks weaken, a period and price correction occurs.
Samsung Electronics and SK Hynix vs. the Index, Direction Based on ‘Relative Strength’
The rule is simple.
If Samsung Electronics outperforms the index, the likelihood of further index gains is high.
If Samsung Electronics underperforms the index, extending the trend becomes difficult.
Practical Checklist.
– The first rebound after an initial sharp drop is generally a buying advantage zone.
– When a box is formed, reducing your position when the box bottom breaks should be the top priority.
– A “support breakdown zone” quickly turns into a “resistance zone,” which then becomes the last exit opportunity.
– Even if it seems like the market might go higher, if your principles break down, sell.
– Limiting losses rather than obsessing over profits is key to long-term survival.
The Biotech Rally: Why It Is Considered a Late Signal
Biotech typically has low fundamental transparency, making it a sector where money tends to flow in at the very end.
After profit-taking in leading stocks, demand shifts toward “finding those that have not risen as much,” often interpreted as a late-stage rotation signal.
However, considering that the quality of the domestic biotech ecosystem has improved since Celltrion, distinguishing between strong and weak stocks within the sector is important.
Trader Generations and Positions, Prioritizing the Magnitude of Liquidity
– First Generation: From the pre-subprime period to the post-subprime era, an era of short-term trading.
They were optimized for low trading volumes.
– Second Generation: From after Lehman Brothers to just before COVID-19.
They were adept at rotation, ETFs, and disclosure patterns.
– Third Generation: The generation that went straight into the COVID-era liquidity market.
Their characteristics include strategies tailored for high trading volumes and extreme volatility.
Insight.
The larger the liquidity, the more it becomes a contest of “how well you time your entries within the strong stocks.”
If the market cools off, sustaining returns through the same methods becomes difficult, and having cash reserves along with risk management becomes the key to survival.
AI Trends and the Semiconductor Cycle, the Only Driving Force for an Extended KOSPI Rally
AI investment is an absolute variable for the performance of domestic leading sectors.
Server and data center expansions, increased demand for HBM and advanced packaging, as well as network and power infrastructure investments, all influence memory prices and shipment volumes.
If the AI cycle continues, semiconductor exports and operating profit leverage will support the index.
Conversely, if AI facility investments slow down or signs of oversupply emerge, the de-leveraging of valuations in leading stocks can occur rapidly.
Checkpoints.
– Global AI CapEx guidance and trends in memory prices.
– Inventory, yield, and packaging capacity of major customers.
– The timing gap between AI investments and performance.
The larger this gap, the greater the volatility.
This part is directly linked to the global economic outlook, and in the domestic asset market, the strength of AI investment translates to the direction of the stock market.
Interest Rates, Exchange Rates, and the Dollar: The Three Pillars of Valuation
If interest rates fall, valuations ease, but a resurgence of inflation slows the pace of rate cuts.
If the exchange rate trends toward a strong dollar, it burdens foreign investor inflows, and rising import prices can heighten the risk of a second wave of inflation.
Domestically, since semiconductor exports are highly sensitive, the interplay between the dollar and memory prices must always be considered together.
In summary, for the index to be seen as an extended rally rather than a bubble, falling interest rates, stable exchange rates, and expanding AI demand must occur simultaneously.
Practical Position Guide, A Checklist You Can Use Immediately
– Sector: Operate only around the “strongest stocks.”
Whether it’s a breakout or a pullback, the stocks remain the same; only the timing differs.
– Box Trading: For the top of the box, sell in portions; when the box bottom breaks, reduce your position by half as a rule.
– Support/Resistance: A support breakdown quickly becomes resistance.
If a rebound occurs, prioritize your exit.
– First Drop: The first rebound after an overheated sharp drop is generally the best risk-reward zone.
– Loss Management: Even the world’s best investors suffer losses.
“Limiting losses” rather than “avoiding losses” is the key.
– Asset Allocation: Set and adhere to a cap for specific assets, such as a 20% rule.
– Psychology: The mindset of simply breaking even is the most expensive mentality.
If you break your principles, you always end up incurring even greater costs.
Key Points Covered, Things Not Often Discussed Elsewhere
– Participant Saturation Theory: When the influx of enthusiasts ends, a lack of excitement becomes normal.
The mentality of just breaking even cools down the rally.
– Regional Economy-Index Divergence: The coexistence of a sinking local economy and a soaring index serves as a more accurate early warning of a bubble than other signals.
– The Simplicity of the Relative Strength Rule: Whether Samsung Electronics outperforms the index is a practical determinant of whether the two-stage rally will extend.
– Traffic Lights for Late-Stage Rotation: A shift led by biotech increases the probability of a late-stage signal.
However, some representative biotechs, due to structural changes, may be exceptions.
– Principle-Based Exit Technique: The transition from a support breakdown to resistance is the last opportunity to exit at a low cost.
Investor Q&A Style Quick Check
Q. Will the KOSPI go higher?
A. If semiconductor earnings, AI CapEx, and stability in interest rates and exchange rates are all met simultaneously, it’s an extended rally; otherwise, a box or correction scenario should be assumed as default.
Q. I am uneasy about the rising biotech sector.
A. There is a high probability of it being a late-stage rotation signal.
Be alert for any break below the box bottom.
Q. What about the Samsung Electronics chart?
A. Reducing your position when the box bottom breaks is the priority, and after a support breakdown and subsequent rebound, exiting is the primary strategy.
Q. What is the current trader positioning?
A. The basic strategy is rotating strong stocks and responding to the box; if large-cap stocks surge, adjust the entry timing more conservatively, expecting reduced liquidity in small/mid-caps.
My Position Action Plan
– For Holders: Set a warning for a break below the box bottom and mechanically reduce your position by 30–50% if it breaks.
– For Those Holding Cash: Enter in portions during the first drop rebound, and limit exposure in overheated biotech zones.
– Sector Rotation: Keep in mind the timing differences in rotation among semiconductors (performance), secondary batteries (news), AI components/equipment (order flow), and biotech (late stage).
– Macroeconomic Variables: If interest rate paths and exchange rate trends are unstable, maintain a shorter position duration.
< Summary >
– After the two-stage high tone, the KOSPI stands at a crossroads, and a three-stage high tone requires fundamentals, actual performance, and supply-demand to align.
– Samsung Electronics’ relative strength is the key signal for an extended rally.
– A biotech-led shift increases the probability of late-stage rotation.
– Participant saturation and regional economy-index divergence serve as early bubble warnings.
– In practice, reducing positions when the box bottom breaks, exiting as support turns into resistance, and capitalizing on the first drop rebound are the orthodox strategies.
– Only when AI investment is accompanied by falling interest rates and stable exchange rates can the rally be interpreted as an extended one rather than a bubble.
[Related Articles…]
KOSPI Bubble Checklist and Response to a Box Break
The AI Semiconductor Cycle and Its Link to Domestic Exports
*Source: [ Jun’s economy lab ]
– 코스피 버블에 대한 솔직한 생각 (ft.김종봉 작가 1부)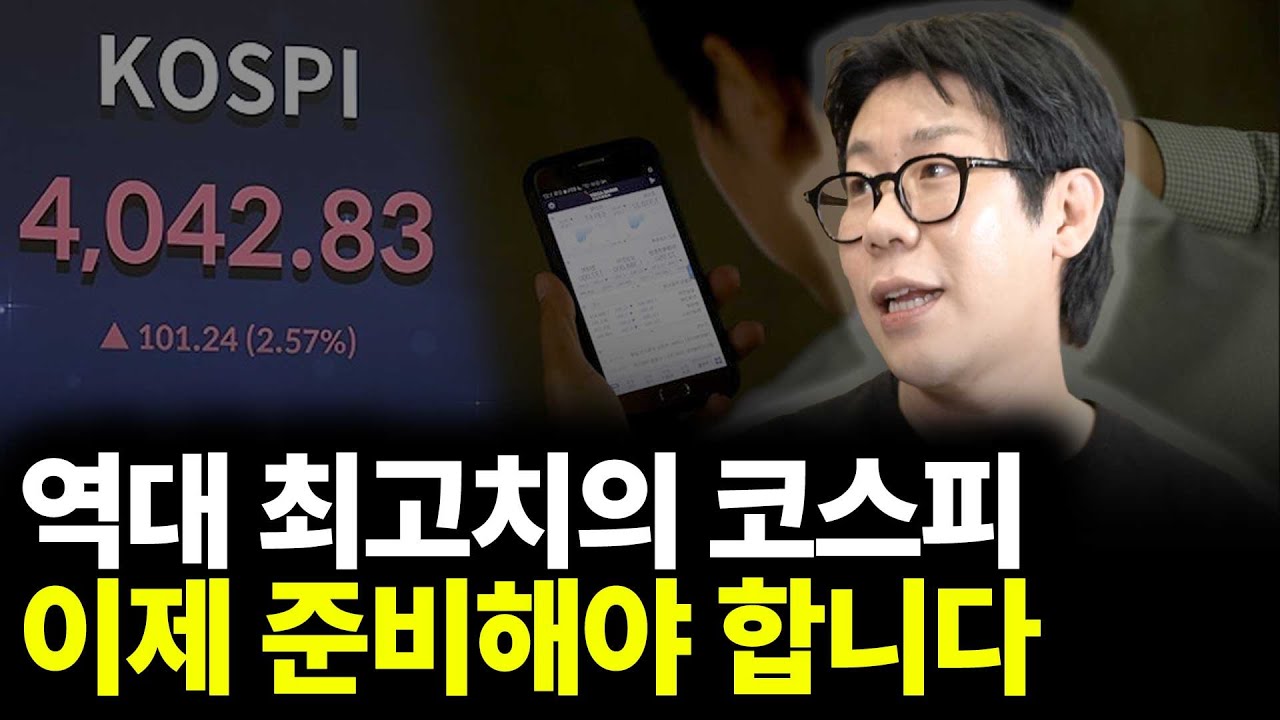
● China Soviet-Style Shift, Consumer Clampdown, Overcapacity, Military Purge, AI Chip Blockade
Will the Chinese Economy Converge to a Soviet-Style Structure? Signals of Suppressed Consumption, Overproduction, Military Purges, and Global & AI Ripple Effects
Key points summarized first.
This article covers the simultaneous occurrence of suppressed consumption and overproduction in the Chinese economy, the governance risks posed by military purges, the impact on global supply chains as well as on interest rates and inflation, and the intersection of AI trends with semiconductor sanctions.
It also outlines the structural limitations of household income distribution and conditions for policy shifts that other media rarely address, along with the lag effects among Korea, Taiwan, and the US caused by power and chip shortages in AI data centers.
The video is based on footage shot on November 6 and reinterprets the content in connection with recent trends.
Key SEO keywords such as global economic outlook, Chinese economy, inflation, interest rates, and supply chain changes are naturally reflected.
Today’s Key Headlines
China is experiencing suppressed consumption and overproduction simultaneously, approaching a Soviet-style failure and structure in resource allocation.
The purge of high-ranking military officials reaffirms the party’s dominance over the state and military, increasing the policy risk premium.
The combination of real estate deleveraging, local government debt, youth unemployment, and deflationary pressures limits the resilience of domestic recovery.
The combination of AI semiconductor sanctions and weak domestic demand restrains China’s AI growth path, while reshuffling the East Asian supply chain and impacting the interest rate and inflation trajectories in the United States.
News Briefing: What’s Happening in China Now
There is a deepening mismatch where consumption is weak but production is in excess.
Price competition intensifies in strategic industries such as electric vehicles, batteries, and solar energy, increasing reliance on exports.
The number of new real estate constructions and sales is significantly lower compared to before the pandemic, and the risk of unfinished projects undermines confidence.
Youth unemployment remains structural despite changes in statistical methods.
CPI is weak, while PPI has experienced long periods of negative values, intensifying deflationary pressures.
A series of purges among high-ranking military officials highlights the rigidity of the governance structure.
In a system where the party stands above the state and military, policy consistency and predictability are even lower.
Structural Similarity with the Soviet Union: Why the Term ‘Copycat’ Emerges
When resource allocation becomes politicized, suppressed consumption and overinvestment occur simultaneously.
Capital and credit are funneled toward state-prioritized industries, weakening profitability verification and accumulating excess capacity.
When household incomes rise slowly, weak domestic absorption increases inventory and price pressures.
Strengthened controls dampen entrepreneurial expectations, leading to a downward effect on innovation and productivity.
In the late stage of the Soviet Union, prioritizing military and heavy industry while suppressing domestic demand led to amplified imbalances with price distortions.
China retains elements of market mechanisms, yet its security and self-sufficiency driven policies create a similar balance.
Data-Driven View of the Asymmetry in the Chinese Economy
The lower end of household income distribution is thick.
A symbolic indicator from Premier Li Keqiang’s 2020 remarks noted that there were 600 million people earning 1,000 yuan or less per month.
Income stagnation in this group, combined with issues in social safety nets and the labor market, restricts consumption recovery.
The transition away from reliance on real estate is underway but requires time.
Housing has been a core component of household assets, and slower price and transaction activity reduces the propensity to consume.
Local government debt and LGFVs constrain the scope for infrastructure investment.
Price indicators reflect weak demand.
The CPI remains subdued while the PPI has experienced prolonged negative periods, putting pressure on corporate margins.
Exchange rates and interest rates are caught in a policy trilemma.
Bold interest rate cuts could lead to yuan depreciation and capital outflows, limiting policy room.
Military Purges and Governance Risks: Signals Interpreted by the Market
The principle that the party controls the military has been strengthened, and the purge of many senior military commanders reconfigures the loyalty structure.
Increased political loyalty may enhance unified decision-making but also weaken dissent and checks.
Procurement, auditing, and quality management risks in strategic sectors such as defense, space, and missiles are emerging.
Uncertainty in policy consistency raises the risk premium, adversely affecting foreign direct investment and capital market valuations.
Implications for the Global Economic Outlook: Inflation, Interest Rates, and Supply Chains
Weak domestic demand in China suppresses raw material and intermediate goods prices, exerting downward pressure on global inflation.
At the same time, overproduction in strategic industries drives down export prices, exporting disinflation to advanced manufacturing economies.
In response, the United States and Europe are intensifying counter-subsidies, tariffs, and content regulations, accelerating regionalization of supply chains.
As a result, global supply chains become dual-layered, with short-term cost increases coexisting with medium-to-long-term stability improvements.
The US Federal Reserve’s interest rate trajectory may gradually ease in response to cooling demand and disinflation, yet tariffs and geopolitical factors remain upward risks for service prices.
Asian currencies and interest rates are likely to vary significantly depending on the strength of the dollar, demand contraction, and the export proportion of Chinese markets.
AI Trends, Constraints, and Opportunities for China
Semiconductor sanctions constrain China’s ability to train state-of-the-art AI models, potentially widening performance gaps.
While restrictions on access to high-performance GPUs from Nvidia are partially offset by alternative chips and optimized software from companies like Huawei, performance and energy efficiency gaps remain.
Demand for power in AI data centers is surging domestically, yet the speed of establishment is uneven due to the power mix, regulations, and capital constraints.
Although applications centered on domestic advertising and e-commerce develop rapidly, the competitiveness of foundational models and the open ecosystem remain relatively constrained.
Within the East Asian supply chain, demand for advanced memory and packaging from Korea and Taiwan continues, while onshoring projects in the United States are absorbing medium-to-long-term demand.
National security-focused tech policies prolong the investment cycles in AI infrastructure outside China, which in turn serve as a buffer in the global economic cycle.
Key Points Other Media Rarely Cover
The real bottleneck for domestic recovery is not the average but the income, safety net, and housing risks of the lower 50% of households.
Unless the income elasticity in this segment is increased, fiscal and monetary stimulus multipliers will remain low.
Overproduction in strategic industries and reliance on exports inherently risk retaliatory tariffs and strengthened environmental regulations.
These factors export disinflation through intensifying price competition while simultaneously stimulating service price inflation through trade frictions.
Military purges signal short-term enhanced control but may also expose underlying issues in procurement, quality, and auditing systems.
In AI, the ‘chip-power-data’ triangle faces bottlenecks in power and software optimization, and China’s chip constraints extend the investment cycles of the global cloud top three, ironically creating long-term demand for AI infrastructure outside China.
Scenarios and Investment Checklist
Scenario 1. Gradual Slowdown and Managed Disinflation.
Real estate stabilizes slightly, domestic subsidies and a gradual interest rate cut keep growth stable at a low range.
Globally, this leads to moderate disinflation and selective strength in risk assets.
Scenario 2. Overcapacity and Escalated Trade Frictions.
Price wars in EVs and solar energy collide with defensive policies in the West, stifling trade.
Raw materials weaken while service and regulatory costs strengthen, distorting the composition of prices.
Scenario 3. Recurrence of Confidence Shocks.
Should real estate or local government debt events, or governance risks escalate, capital outflows and exchange rate volatility will increase.
Diversification of Asian asset classes and a focus on defensive dividend and cash flow-oriented selections will be necessary.
Checklist.
Monitor the pace of resolving unfinished housing projects and the execution of policy funds.
Assess improvements in youth employment and urban household income growth rates.
Watch for the duration of the PPI deflation and recovery in margins across industries.
Keep an eye on the expansion of external measures and subsequent changes in subsidies and tariffs in relevant countries.
Track the speed at which bottlenecks in power and chip procurement are resolved in AI infrastructure investments.
6–12 Month Timeline Guide
1–3 months.
Monitor year-end/beginning policy packages and infrastructure bond issuances.
Check for bottoming out of export prices and PPI.
4–6 months.
Observe changes in the completion rate of real estate projects and any additional easing of mortgage regulations.
Follow newsflow on power and chip procurement related to AI investment cycles.
7–12 months.
Monitor global regulatory schedules regarding tariffs and subsidies and progress in supply chain relocation.
Check trends in Asian capital inflows based on the US interest rate cut trajectory and dollar flows.
FAQ: Brief Questions and Answers
Why is consumption weak while production is strong?
State-driven investment and credit supply in strategic industries persist while weak household incomes, real estate, and safety nets diminish domestic absorption.
Won’t lowering interest rates solve this?
Due to the trade-off with capital outflows and exchange rates, monetary policy alone is limited in its ability to resolve the issues. Fiscal and structural reforms must be pursued concurrently.
What do military purges signal to the market?
They signal an enhancement of control that raises governance uncertainty premiums, and they highlight risks in the procurement, quality, and auditing systems in defense and aerospace sectors.
What opportunities and constraints does AI present for China?
Although domestic applications in advertising and e-commerce advance rapidly, restrictions on advanced chip access limit the competitiveness and energy efficiency of foundational models.
Ironically, this creates long-term demand for AI infrastructure investments outside China.
Data, Sources, and Limitations of the Interpretation
The indicator of 600 million people earning 1,000 yuan or less per month is based on official remarks from 2020 by Li Keqiang, and the latest updates are limited.
Youth unemployment rates require caution in long-term comparisons due to changes in statistical methods.
Price and growth indicators are subject to announcement delays and revisions, so interpretations focusing on trends are more valid.
Military-related personnel information is derived by cross-referencing official announcements and foreign media reports; due to the opaque nature of the sector, details may be fluid.
< Summary >
China is converging toward a Soviet-style distortion with simultaneous suppressed consumption, overproduction, strengthened control-based governance, and weak trends in real estate, debt, and prices.
This creates downward pressure on global inflation through weak demand while simultaneously exerting upward pressure via trade frictions, increasing volatility in interest rate trajectories.
In AI, while power and chip bottlenecks expose Chinese limitations, infrastructure investments in East Asia and the US support long-term cycles.
Investors should focus on key checkpoints such as the resolution speed of unfinished housing projects, improvements in lower-tier household incomes, the bottoming out of the PPI, and regulatory schedules.
[Related Articles…]
Chinese Deflation and Global Supply Chain Reshuffling
AI Semiconductor Export Controls and East Asian Competitiveness
*Source: [ 달란트투자 ]
– “과거 소련과 판박이다” 충격적인 중국 경제 실제 상황 | 김정호 교수 4부