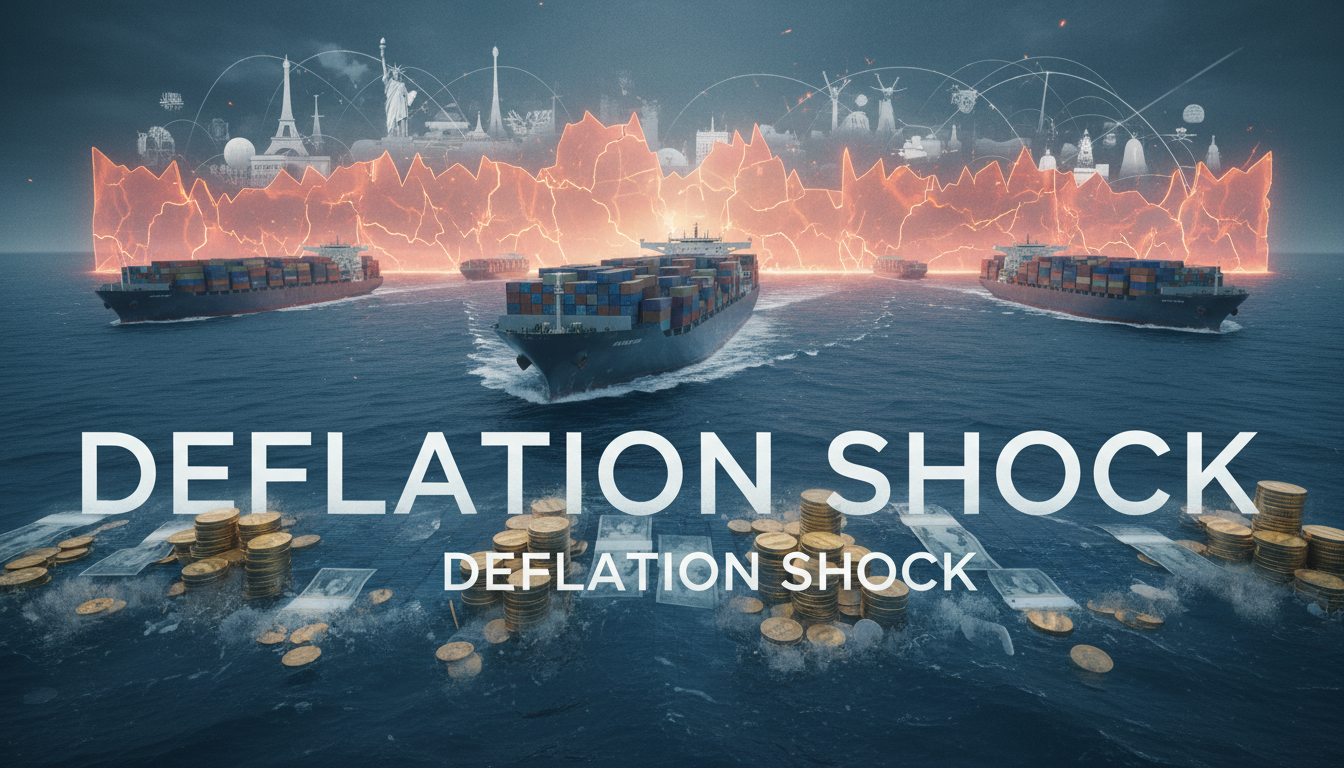
● Tariff Shock, Deflation Storm
San Francisco Fed: “Tariffs Are Not Inflation but Deflation” 150-Year Empirical Results and Summary of FOMC & Market Scenarios
Today’s article covers the core insights from the San Francisco Fed’s tariff-price study conducted over 150 years of data, the mechanism by which tariffs hit aggregate demand and intensify recession risks, the FOMC interest rate trajectory and exchange rate direction, asset market positioning, and even the influence on AI supply chains and semiconductor cycles.
This is not just a passing mention in the news—we have organized viewpoints and checklists that can be immediately applied to the Fed’s next meeting communications and portfolio rebalancing.
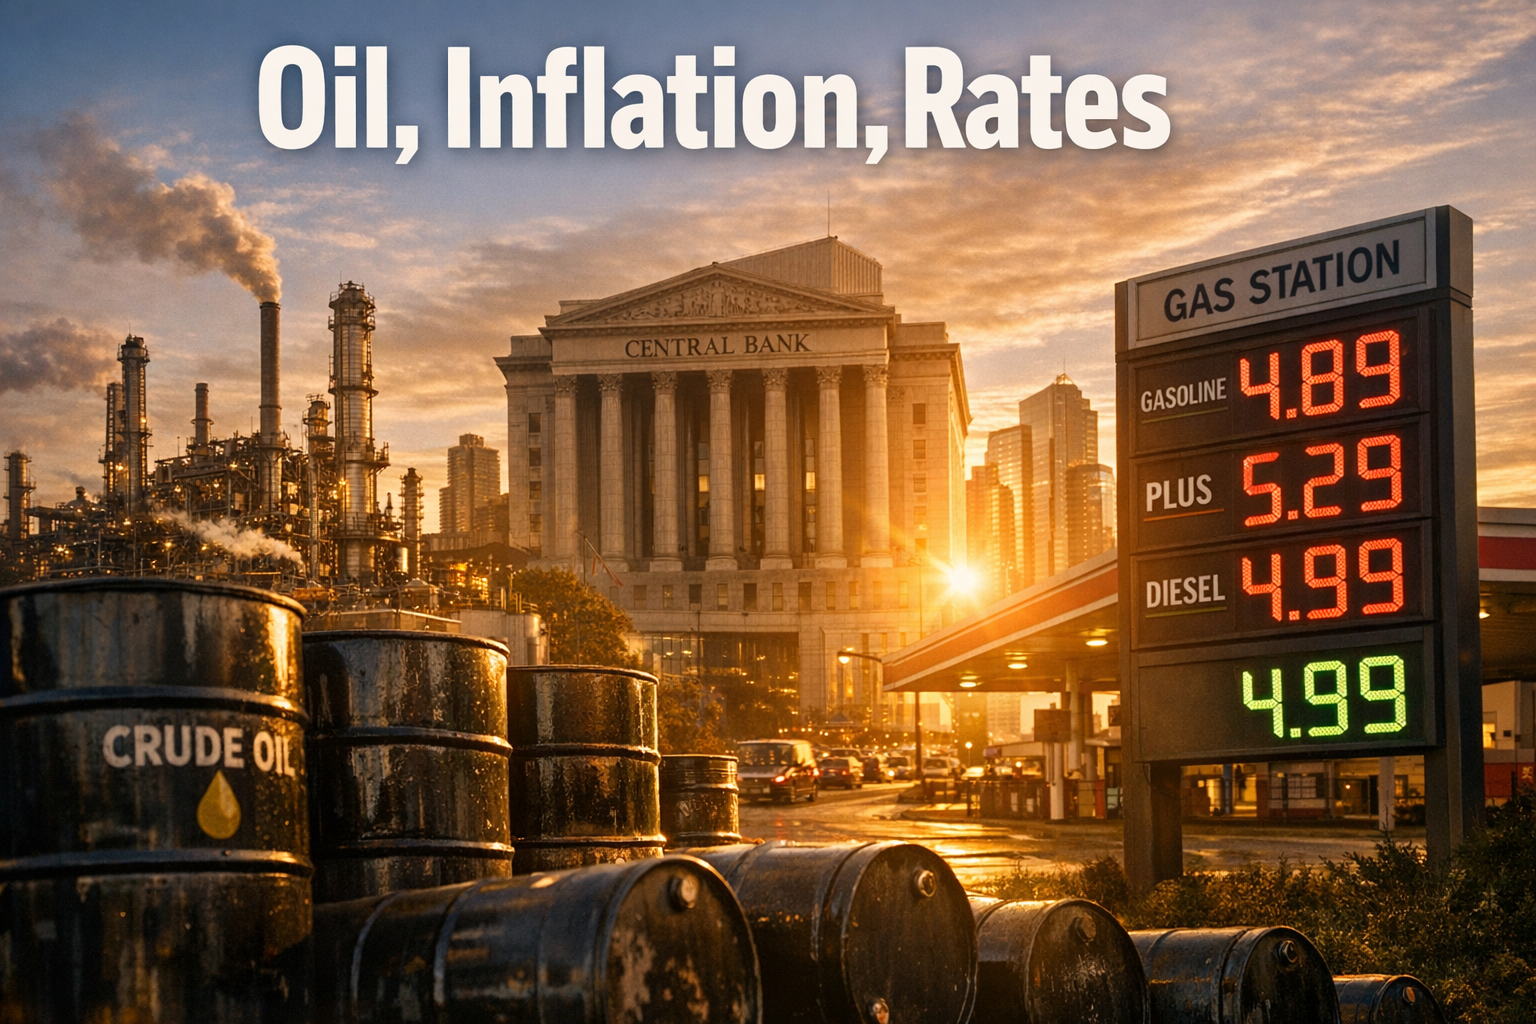
[News at a Glance] Tariffs = Deflationary Pressure, Fed’s Perspective May Change
The San Francisco Federal Reserve’s analysis of U.S. and European data from 1869 to 2020 concluded that tariff hikes operate as an aggregate demand shock with deflationary characteristics, lowering prices rather than raising them while worsening unemployment and growth.
Under a hypothetical shock (a 4 percentage point tariff increase), inflation was observed to respond by about -2 percentage points and unemployment by +1 percentage point, with magnitudes varying over time but the direction remaining consistent.
The key mechanism identified was that increased uncertainty and a decline in stock prices induced a wealth effect that simultaneously dampened consumption and investment.
These findings differ from the conventional view that assumed tariffs as a supply shock leading to stagflation, and they could alter the Fed’s interest rate assessments and the interpretation of the dot plot.
Key Data Points: Tariffs, Prices, and Employment in Numbers
In the full U.S. sample from 1869 to 2020, a 4 percentage point increase in tariffs was estimated to cause a -2 percentage point change in inflation and a +1 percentage point change in unemployment.
In the pre-war period (1869–1939), the decline in prices was more pronounced, while the post-war period (1946–2020) showed a smaller magnitude, though the direction remained the same.
Data from the late 19th to early 20th centuries for the UK and France also revealed simultaneous slowing of growth and declines in prices.
In summary, tariffs operated more strongly as a demand shock that “closes the wallet” rather than as a supply shock that “raises prices.”
Why These Results Occurred: Four Aggregate Demand Channels
One channel is the surge in uncertainty.
When risks related to policy direction, input costs, and retaliatory tariffs increase, companies postpone capital expenditures and consumers delay durable goods purchases.
Another channel is the wealth effect and financial conditions.
Tariff news and margin pressures place downward pressure on stock prices, decreased wealth dampens consumption, and widening credit spreads increase borrowing costs.
A third channel is the exchange rate channel.
Tariffs often lead to an appreciation of the domestic currency (or depreciation of the trading partner’s currency), which can offset import prices and reinforce deflationary pressures.
The fourth channel is the policy mix.
Even if tariffs increase tax revenues, a contractionary fiscal stance further squeezes aggregate demand, and if monetary policy is tightened concomitantly, recessionary pressures intensify.
Difference from Traditional Economics: “Supply Curve Shift” vs “Demand Curve Shift”
Textbook interpretations view tariffs as shifting the supply curve to the left, explaining them as causing higher prices and lower output (stagflation).
Empirical evidence suggests that a leftward shift in the demand curve is more dominant.
In other words, it is characterized as a “demand shock” where recessionary pressures and falling prices occur simultaneously.
While in the short term, the pass-through of tariffs on specific items may cause some prices to rise, at the macro level, the channels of uncertainty and financial conditions have repeatedly resulted in lower overall inflation.
Policy/Fed Implications: Interest Rates, Forward Guidance, Interpretation of the Dot Plot
If tariffs are deflationary, then the Fed’s rationale for raising rates or maintaining high rates for a prolonged period due to tariffs weakens.
In future FOMC communications, the phrase “tariff-induced inflation concerns” may be downplayed, while “evaluating slowing demand and employment conditions” might gain prominence.
While forward guidance remains data-dependent, it is likely to become more sensitive to employment, consumption, credit conditions, and downward adjustments in inflation expectations rather than headline inflation.
Ultimately, this could lead to a reassessment of the likelihood of an “early rate cut,” and the debate over the neutral rate (n*) in the dot plot might see a gradual shift downward.
Market Impact Checklist: Interest Rates, Stocks, Exchange Rates, Commodities, Real Estate
Government bond yields.
Deflationary pressures and recession concerns can lower long-term yields and lead to steepening of the yield curve (bullish steepening during the onset of a recession).
The stock market.
It is accompanied by downward revisions in earnings estimates and revaluation adjustments.
Export, cyclical, and capital goods sectors may be weak, while consumer staples, utilities, and healthcare are relatively defensive.
Exchange rates.
When deflation and risk-off sentiment are strong, a stronger dollar may re-emerge, and emerging market currencies, as well as the Korean won, could experience greater volatility.
Commodities.
Slowing demand exerts downward pressure on industrial metals and energy, and with intensified economic shocks, the safe-haven demand for gold increases.
Real estate.
Although falling interest rates support property prices, weakening real economic conditions and vacancy risks may offset this, leading to significant sectoral disparities.
Perspective for Korean Investors: Export, Won, and Bond Strategies
The Korean won tends to move in tandem with external risks.
In a risk-off environment, defensive currency hedging and diversification into the dollar and yen are effective.
Export-oriented stocks.
Amid global demand slowdowns, even within semiconductors and IT, it is important to distinguish between server/AI capital expenditures and smartphone/PC retail demand.
In bond positioning.
In an environment of disinflation and economic slowdown, increasing duration exposure may prove advantageous.
However, it is necessary to monitor whether the sticky service prices, driven by persistent inflation and wages, are showing signs of slowing.
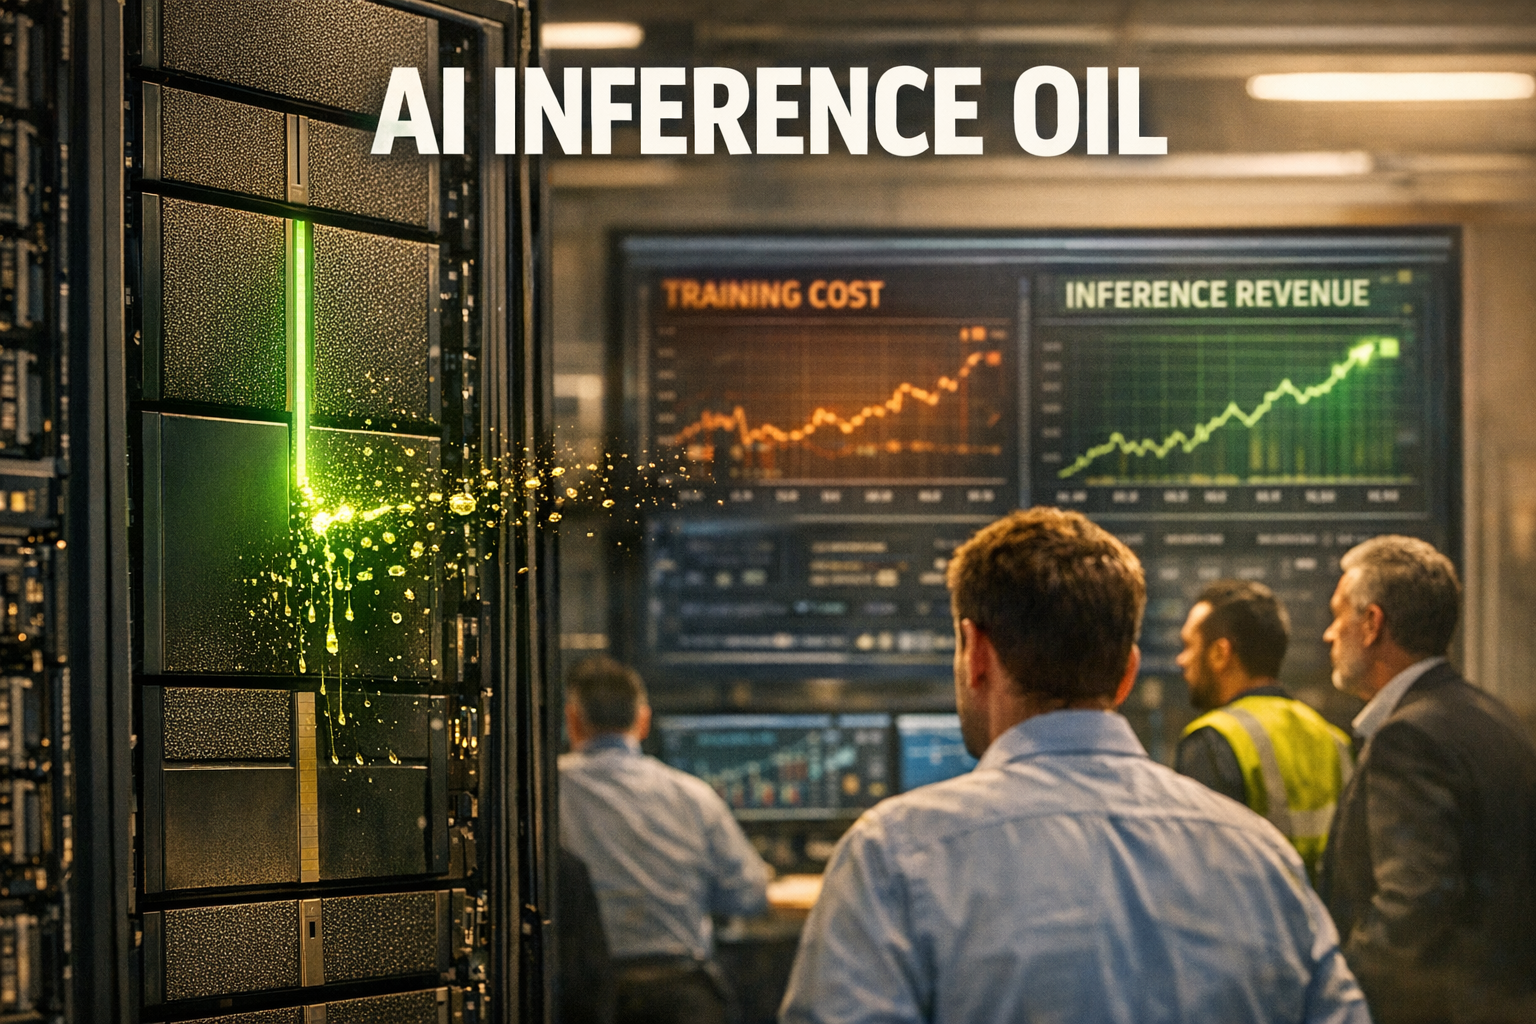
AI Trend Focus: Tariffs, Semiconductors, Cloud CapEx, and ‘AI Deflation’
While investments in AI infrastructure (accelerators, memory, power, and cooling) are structural, tariffs, export restrictions, and retaliatory tariffs may delay the timing of capital expenditures for cloud operators, postponing revenue recognition.
This results in delayed revenue recognition and supply chain reconfigurations that increase stock price volatility.
AI could exert medium-term deflationary pressures through productivity improvements.
In the short term, higher power rates and data center construction costs may cause cost-push inflation, but if tariff-induced demand contraction is stronger, the net effect could tilt toward deflation.
Semiconductors cycle.
Tariff risks prompt more conservative inventory management, which might reduce cycle amplitude but could slightly advance the peak-out timing.
Onshoring and friend-shoring efforts by different countries boost the benefits of domestic production for equipment and materials, while long-term margins may decline due to production decentralization.
The Most Crucial Point Often Overlooked Elsewhere
The key factor is the “duration” of the tariff shock.
Temporary tariffs may be absorbed through inventory adjustments, but if they persist, inflation expectations become anchored lower, weakening both wage growth and pricing power simultaneously.
The asymmetry of indicators is also important.
Even if headline CPI slows, the lag in services and rents catching up means it takes time for the Fed to gain “confidence”.
That gap helps maintain tighter financial conditions, thereby increasing recession risks.
The offsetting mechanism of exchange rates should not be overlooked.
The direct price effects of tariffs are partially offset by a stronger currency, weakening the “tariffs = price increases” equation.
If retaliatory measures and non-tariff barriers from trading partners also come into play, trade volumes may decline, leading to a collapse in demand characterized by reduced transactions rather than just lower prices.
Portfolio Guide by Scenario
For a scenario of deepening deflation and a shift toward Fed easing.
Increasing the allocation to long-term government bonds, maintaining exposure to quality growth and dividend defense stocks, and increasing positions in gold and the yen can be effective.
For a scenario of weakening deflation and a soft landing.
A balanced approach involving investment-grade credit, infrastructure, utilities, data center REITs, and core AI supply chain sectors (accelerators, HPC memory) is recommended.
For a scenario with increased policy volatility.
Maintain a cash and short-term bond buffer, adjust currency hedging ratios dynamically, and relatively reduce exposure to tariff-sensitive sectors.
Cautions in Data Interpretation
It is necessary to distinguish correlation from causation.
Since tariffs are generally introduced during economic slowdowns, it is essential to confirm that the research has ruled out reverse causation through identification strategies.
Attention must be paid to sample heterogeneity.
Because differences in industrial structure, welfare, and labor market institutions are significant, the applicability of estimates across countries and eras is limited.
The magnitude and scope of the shock can alter the results.
Full tariffs versus targeted tariffs, and temporary versus permanent effects, differ.
< Summary >
Empirical results gaining traction show that tariffs generate deflationary and recessionary pressures more through a contraction in aggregate demand than through supply shocks.
The Fed’s rationale for tariff-induced inflation weakens, and the interest rate trajectory may be reassessed toward easing.
The baseline market scenario includes stronger government bonds, a stronger dollar, weaker cyclical stocks, and relatively stronger defensive stocks.
While the AI investment cycle is structural, tariff and regulatory risks may delay the timing of capital expenditures and supply chain reconfigurations, increasing volatility.
A portfolio strategy that increases duration exposure, favors defensive and quality assets, and employs dynamic currency hedging is prudent.
[Related Articles…]Tariff-Driven Deflation: Signals in Interest Rates and Exchange RatesAI Supply Chain Reset and the 2025 Semiconductor Cycle Roadmap
*Source: [ Maeil Business Newspaper ]
– [홍장원의 불앤베어] 우리가 알던 경제학 상식 틀렸다! 150년 미국 역사 샌프란 연은이 실증연구 해보니