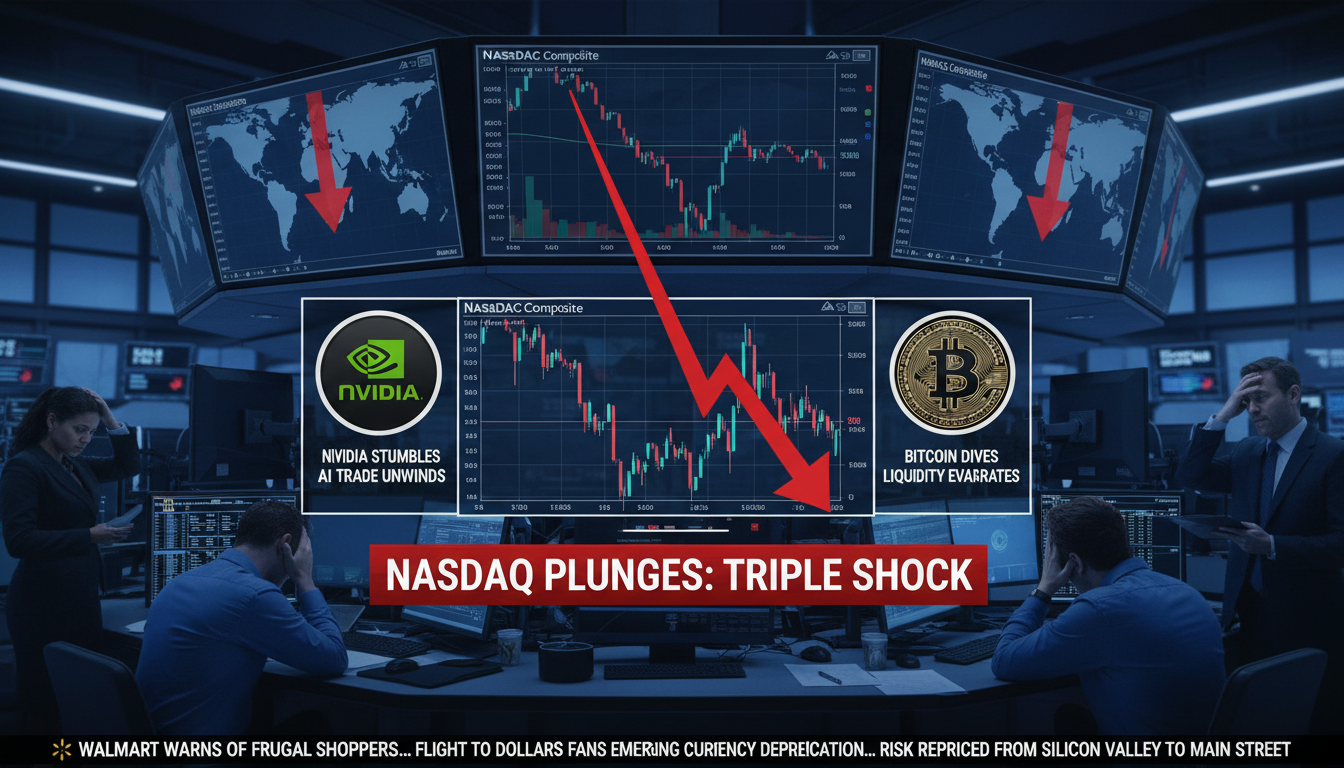
● Nasdaq Bloodbath – Nvidia Red Flags, Fed Hawk, Bitcoin Plunge
The Real Catalyst Behind Nasdaq’s “Vertical Drop” and the Next Scenario: The Shadow of Nvidia’s Earnings, Hawkish Fed Signals, and the Chain Reaction of Bitcoin’s Collapse
Early in the session, after a sharp 2% rally, the market suddenly flipped into a steep decline—here is a concise summary of why it crumbled so quickly.
This article covers everything from the implications of soaring inventory and accounts receivable within Nvidia’s earnings, to the timing of fading rate-cut expectations after the Fed’s hawkish remarks, the way Bitcoin’s 88K collapse chilled risk appetite, and even the possibility that the drop was exaggerated due to options and liquidity structures.
We clearly outline even the “uncomfortable changes in the numbers” and “market microstructure” that others merely gloss over.
Today’s Market at a Glance: News Timeline
-
Opening Rally.
Nvidia’s earnings and guidance exceeded expectations, propelling Nasdaq into a strong start with a rally in the low 2% range at the opening.
Buying interest poured into globally sensitive economic sectors and AI-related stocks. -
Mixed Employment Data.
Nonfarm payrolls surprised to come in strong, but the unemployment rate was higher than expected, sending mixed signals of “solid employment yet with hints of an economic slowdown.”
Divergent interpretations and debates over inflation and the path to rate cuts initially supported risk assets. -
Hawkish Fed Signals and a Shift in House Views.
The president of the Cleveland Fed emphasized “keeping monetary policy tight for now,” and remarks from a Fed governor carried tones warning of a possible sharp drop.
Morgan Stanley effectively ruled out the possibility of a rate cut in December, dashing expectations. -
Bitcoin’s 88K Collapse.
Breaching a psychological support level triggered massive deleveraging, and as profit-taking in tech stocks coincided, Nasdaq turned into a “sliding market” with an intraday range of over 3%.
Nvidia Earnings: “Good” but with Shadows in the Numbers
-
Sales remain high-growth, but the growth rate oscillates within a 50–70% band.
Guidance was positive, and the message was strong that the AI innovation cycle was expanding. -
Surging Inventory.
Recent quarterly inventory surged by over 100% compared to the previous year and sharply increased compared to the previous period.
Faster inventory growth relative to sales growth sends two signals simultaneously.
1) Positive Version.
It could be a deliberate build-up for next-generation GPU transitions and to meet bundled HBM/networking demand, or proactive inventory accumulation following the alleviation of packaging bottlenecks such as with CoWoS.
2) Cautionary Version.
It may be an early signal that finished goods are “moving out slower than anticipated” due to a slowdown in customer acquisition, adjustments to delivery schedules, or delays in approvals in specific regions or among certain customer groups. -
Abnormally Rapid Increase in Accounts Receivable (AR).
Changes in trading conditions primarily with hyperscalers, bundled project deliveries (accelerators plus switching), and inspection delays are pushing back the cash collection timing, causing AR to swell.
However, if the AR expansion continues for too long compared to operating cash flow (OCF), the gap with profits may widen, igniting concerns about the “quality of demand.” -
Key Points in the Numbers.
It is crucial to monitor whether DSO (Days Sales Outstanding) and DIO (Days Inventory Outstanding) normalize over the next two to three quarters.
Whether a simultaneous decrease in customer prepayments accompanies rising AR, or if cash conversion resumes in the next quarter, may significantly influence the stock’s sensitivity.
Macro Trigger: The “Timing Risk” of Inflation and Rate Cut Expectations
-
Although the mixed employment data appears to be a “deadlock” on the surface, the Fed’s interpretive framework tells a different story.
Considering the sticky risks of wage and service inflation, the outlook inevitably shifts toward a “wait and see” mode. -
Hawkish remarks and revised House views dashed expectations.
As expectations of a “rate cut by year-end” diminished, growth stock valuations were immediately discounted.
From a market outlook standpoint, a rebound in real interest rates and a stronger dollar pose headwinds for tech and emerging markets alike. -
Checkpoints.
If forthcoming CPI/PCE, JOLTS/unemployment benefits data, and FOMC statements collectively point to “continued cooling,” then rate cut expectations could be revived.
Conversely, if service prices remain sticky, the “long-term high rate” narrative will resurface.
Bitcoin Collapse and the Return of Correlation Among Risk Assets
-
The drop below 88K, rather than being a simple crypto issue, triggered forced deleveraging positions.
As the slowdown in ETF inflows, net selling by miners, and derivative liquidations overlapped, the synchronization extended even to tech beta. -
Ultimately, rather than the underlying “legitimacy” of the drop, technical pressures likely exaggerated the decline.
Thus, the probability of a short-term rebound snapback increases simultaneously.
Market Microstructure: Why Did It Slip Like a Slide?
-
Options Delta/Gamma Dynamics.
In the early phases of the rally, delta hedging driven by call buying amplified the upward move, and when prices fell below certain levels, increased put hedging accelerated the drop. -
Shallow Liquidity Zones.
During the lull between the earnings season’s end and macroeconomic events, thin order books tend to exaggerate the magnitude of declines. -
Systematic Selling Flows.
Trend-following and risk parity strategies likely entered a phase of reducing exposure in reaction to rising volatility.
Key Points Others Overlook (Deep Dive)
-
The surge in AR and inventory is not evidence of “weakened AI demand” but might be an early signal of “demand mismatch and product mix transition.”
As the focus shifts from training to inference, and with increasing bundled deals (GPU+networking+software), extended verification procedures delay the cash conversion timing. -
The Paradox of Bottlenecks.
While alleviating bottlenecks for CoWoS and HBM can boost shipment speeds, if bottlenecks remain in data center racks or power infrastructure at customer sites, the time finished products spend sitting at customer premises may lengthen, thereby inflating both inventory and AR simultaneously. -
Accounting Variables.
The accounting treatment (useful life/depreciation) and changes in purchase terms by hyperscalers directly affect vendor AR.
Regarding Michael Burry’s pointed discussion on “GPU lifespan,” vendors justify longer lifespans based on the utilization rates of older generation chips, but this is closely tied to demand optimization and becomes a sensitive issue at the top of the cycle. -
A Small Crack in Trust.
Unless issues of “governance and transparency,” such as the controversy over OpenAI’s auditor, subside, subtle discounts on the AI theme premium could occur.
The direction of “trust” may influence valuation multiples more than the numbers themselves.
What to Watch: Checklist and Scenarios by Timeline
-
Fundamental Checklist.
Trends in Nvidia’s DSO/DIO and whether customer prepayments or cash flow conversion resumes.
TSMC’s CoWoS capacity ramp-up, HBM3E supply plans (SK Hynix, Micron, Samsung).
Hyperscalers’ CapEx guidance and comments on the share of inference (Microsoft, Google, Amazon).
US 10-year real yields, the US Dollar Index, and the direction of the Financial Stress Index (FSI). -
1–4 Week Scenarios.
Bull.
Reconfirmation of cooling in CPI/PCE, stability or a decline in the 10-year yield, and a rebound in Bitcoin leading to recovery in tech beta.
Base.
Ongoing mixed data, with volatility oscillating in upper and lower ranges leading to earnings/guidance-sensitive markets.
Bear.
Reheating of service prices plus additional hawkish Fed signals, and another drop in Bitcoin causing a rapid retreat in risk appetite. -
Positioning Ideas (for informational purposes).
Core positions remain in structural AI innovation beneficiaries (semiconductor design, packaging, HBM, optical networking), while satellites respond flexibly to events.
In phases of short-term volatility, use put/call spreads for risk management and adjust cash positions flexibly around the event calendar.
In phases where downside may be exaggerated, approach quality AI infrastructure stocks in a staggered manner, but avoid going all-in until AR/inventory normalization is confirmed.
Today’s Conclusion
- The essence of today’s decline is an “event-driven drop” where “signs beyond the numbers + hawkish signals + a crypto collapse” coincided, and thin liquidity combined with options structures amplified the decline.
- While Nvidia’s surges in inventory and AR serve as risk warning lights, they are intertwined with structural factors like product mix transitions and infrastructure bottlenecks; the resumption of cash conversion over the next one to two quarters will be the real turning point.
- Rate cut expectations have receded to a “data-dependent” phase.
If cooling in service inflation is confirmed, the recovery potential for risk assets increases; conversely, if prices remain sticky, tech multiple adjustments will follow. - While global economic indicators serve as supplementary metrics, the market is currently more influenced by sentiment and microstructure factors.
Thus, mechanical reactions at both extremes of overbought and oversold conditions are likely to recur.
< Summary >
- Triple Trigger.
A simultaneous occurrence of surges in Nvidia’s inventory and AR, fading rate cut expectations after hawkish Fed remarks, and Bitcoin’s 88K collapse. - Exaggerating Mechanisms.
Option gamma, thin liquidity, and systematic selling amplified the decline. - Points to Watch.
Normalization of Nvidia’s DSO/DIO, hyperscalers’ CapEx commentary, alleviation of HBM/CoWoS bottlenecks, and a reconfirmation of cooling in service prices are keys to a rebound. - Strategic Hint.
Maintain core positions in structural AI innovation beneficiaries, while prioritizing event-driven risk management in the short term.
[Related Articles…]
- Hyperscaler CapEx and the Next Phase of the AI Cycle
- Reading the Inflation Path and Timing of Rate Cuts in the Global Economy
SEO Keywords Reference.
Global Economy.
Inflation.
Rate Cuts.
AI Innovation.
Stock Market Outlook.
*Source: [ 내일은 투자왕 – 김단테 ]
– 잘 나가던 나스닥 수직낙하한 진짜 이유
● AI Chip Bubble, Cash Burn Reckoning
Surge in Semiconductors and Nasdaq Driven by the Nvidia Effect, 70% Chance of December Rate Hold… But ‘Depreciation’ is the Real Variable
Key Points Covered in Today’s Article
Following Nvidia’s earnings, a rally centered on semiconductors spread immediately after the New York Stock Exchange opened.
Ahead of the December FOMC, the probability of holding rates was once as high as 70%, but employment data and divergent opinions within the Fed remain variables.
Walmart not only met expectations with its earnings, along with 27% growth in e-commerce, but also announced its move to list on the Nasdaq.
A point overlooked by other media is that the ‘depreciation period for AI semiconductors’ is the key accounting and cash flow factor that will determine big tech’s profits and valuations.
This document encapsulates the global economic trends, the direction of the U.S. stock market, and risks related to rates, inflation, and recession.
New York Stock Market Breaking News Briefing: Semiconductor Drive Spreads Across All Sectors
Following Nvidia’s stellar performance, the Nasdaq surged by over 2% at the opening, setting the tone.
The entire semiconductor sector was strong, with Broadcom, AMD, Intel, and equipment stocks gaining together.
Tech stocks such as Tesla and Palantir also responded dynamically to the recovery in risk appetite.
Walmart, which was weak before the open, rebounded sharply due to earnings and the momentum of its listing move.
This rally is not merely driven by ‘AI expectations’ but also by a repricing of liquidity and uncertainty about the rate path.
Debate over AI Semiconductor ‘Depreciation’: Michael Burry vs. Jensen Huang, What Do the Numbers Really Say?
The point of contention is the “useful life” of the GPU.
Assigning a longer useful life reduces annual depreciation expenses, making book profits look larger, while a shorter period does the opposite.
Burry argues, “GPUs become outdated in 2 to 3 years,” contending that big tech has underestimated the costs that will have to be recognized over the coming years.
Nvidia counters by saying, “With CUDA software optimization, even older chips like the A100 are operating at 100%,” asserting that their economic life is long.
Burry’s retort is, “Operation does not equal revenue.”
Older chips incur higher OPEX burdens due to power, space, and cooling costs, which could render the total cost of ownership (TCO) less favorable compared to new chips.
If hyperscalers adopt a useful life of 2 to 3 years, some research warns of an additional 7-22% depreciation on EBITDA in 2024.
Microsoft, Meta, and Alphabet have extended the useful life, whereas Amazon has shortened it; these differences in accounting policies are also key points to watch.
The crux is to determine whether the accounting profit lines up with cash generation, and whether the investment is sound based on TCO criteria that reflect power cost, cooling, rack efficiency, and uptime.
The Most Crucial Point Overlooked by Other Media: The Disparity between ‘Accounting Profit vs. Power Expense Reality’
The battle in the AI semiconductor arena is not merely about market share or TOPS competition but a total cost of ownership (TCO) war that includes a data center’s kWh, PUE (power usage effectiveness), and cooling CAPEX.
What matters more than the fact that an older chip “still runs” is the fact that “the more it runs, the more cash is drained by electricity and cooling costs.”
Extending the depreciation period is beneficial for defending EPS, but increasing power costs, load factors, and heat density can erode Free Cash Flow.
Ultimately, investors must check not only the disclosure of changes in depreciation estimates but also long-term power contracts and the roadmap for cooling methods (air-cooled/liquid immersion) and power density per rack to accurately assess true profitability.
December FOMC Check: 70% Chance of Holding Rates → Data Reinterpretation, and Strong Divisions within the Fed
The U.S. job report for September, with an increase of 119,000 jobs, was a headline surprise, but it also significantly revised down past numbers, hinting at weakening in the labor market.
Just before the announcement, the probability of a rate hold in December soared to 70%, and afterward, the figure wavered somewhat.
The key is that the Fed is finding it difficult to rely on data in the midst of data gaps and frequent revisions.
The minutes from the October FOMC meeting notably mentioned “strongly differing” opinions, indicating a pronounced divide between the hawks and doves within the committee.
Since the essence of the market rally rests on expectations of rates and liquidity, the trajectory of inflation easing and detailed employment indicators will determine year-end volatility.
Walmart: Meeting Earnings Expectations, 27% Surge in E-Commerce, and a ‘Move to Nasdaq’
Walmart’s global e-commerce sales grew by 27% while domestic sales in the U.S. increased by 28%, demonstrating its speed in transforming its business model.
Weak discretionary spending and the resilience of food and essential items are anchoring the ‘K-shaped consumption’ pattern.
Households earning over $100,000 contributed to 75% of quarterly sales growth, confirming an increase in price sensitivity among high-income groups.
The move from the New York Stock Exchange to Nasdaq signals an intention to emphasize technology, automation, and AI strategies.
Inclusion in the Nasdaq 100 could lead to inflows from index-tracking funds, potentially strengthening short-term stock momentum.
Historically, Walmart has shown strength during recessionary phases, a trend connected to deepening consumer polarization.
Liquidity vs. AI Bubble: The Real Force Driving the Market Now
Some see the current rally as more of a reallocation of liquidity than an AI narrative.
In a phase where liquidity is circulating among virtual assets, gold, and big tech, U.S. large-cap growth stocks and AI semiconductor stocks stand to benefit the most.
However, if depreciation, power costs, and the recovery period for capital investments materialize, valuations could undergo another revaluation.
The rise in consumer credit ‘shadow leverage’, such as BNPL, poses a risk to consumer resilience and must be factored into recession risk management.
Investor Checklist: Accounting, Cash, Power, and Structural Demand
- Accounting: Check disclosures on changes in depreciation periods, asset useful life notes, and any discrepancies between EBITDA and FCF.
- Cash: Evaluate data center CAPEX/future OPEX estimates (power and cooling) and long-term power contract statuses.
- Technology: Compare the efficiency of generational cycles, software optimization roadmaps, and mixed deployments (AI accelerators plus CPUs).
- Demand: Track hyperscalers’ total capital expenditure guidance and conversion rates from enterprise AI pilots to production.
- Macro: Monitor how the rate trajectory, the pace of inflation easing, and adjustments in employment data affect U.S. market valuations.
Positioning Ideas (Observation List)
- Core: Approach a basket of AI semiconductor leaders and TCO beneficiaries along the power, cooling, and server rack value chain.
- Balance: Increase the proportion of big tech companies with conservative accounting policies and high FCF stability.
- Defensive: Monitor retailers like Walmart that combine recession defense with e-commerce transformation.
- Risk: Reflect scenarios of accelerated depreciation, spikes in power costs, and potential bottlenecks at data centers in stress tests.
< Summary >
Nvidia’s stellar performance drove the semiconductor sector and, although there is a high chance of a rate hold in December, uncertainty remains due to data gaps and differing opinions.
The ‘depreciation period’ for AI semiconductors is crucial to scrutinizing big tech’s true profits, with TCO considerations that include power and cooling expenses being the real solution.
Walmart, with its earnings and Nasdaq move, appears poised for a structural re-rating, while consumer polarization continues.
Even in a liquidity-driven market, a balanced approach that checks accounting, cash flow, and power infrastructure realities is necessary.
[Related Articles…]
- December FOMC and the Soaring Probability of a Rate Hold: A Comprehensive Market Scenario
- The Debate on AI Semiconductor Depreciation: The True Risks Facing Nvidia and Big Tech
*Source: [ Maeil Business Newspaper ]
– 12월 금리동결 확률 70%까지 상승ㅣ美9월 고용 11만9천명 예상치 상회ㅣ월마트 실적 부합, 나스닥 이전 상장ㅣ홍키자의 매일뉴욕