● Trump Stimulus Ignites K-Shaped Split, BNPL Time-Bomb, Retail AI Windfall
Bottom-Ranked Counterattack 2026: Trump-Style Domestic Demand Boost, K-Shaped Consumption, BNPL Risks, and the Real Beneficiary Stocks of Retail AI
My article covers: 1) actual data on the polarization between online and offline, 2) the reasons high-income consumers are shifting to low-price channels and the beneficiaries, 3) the impact on the stock market and interest rates of a Trump-style domestic demand boost scenario in 2026, 4) potential candidates among struggling consumer stocks that could “rise as leaders again”, 5) BNPL (Buy Now, Pay Later) debt risks and a checklist, and 6) the hidden performance drivers of retail AI and retail media.This consolidates the real money-making points of this cycle all at once.
Key Checkpoints for U.S. Year-End Consumption: Online Boom, Offline Decline
Based on the aggregated data from various institutions after Black Friday, online consumption grew by about 9.1%, exceeding expectations.Mobile payments have surpassed 50% for the first time, marking a complete shift in the shopping focus from PC to smartphone.Offline sales increased by +1.7%, which, when considering inflation, indicates a real decline, and offline traffic decreased by about -3%.While the average spending per customer increased by +7%, the number of orders dropped by -1%, revealing a pattern of “recessionary consumption with a willingness to bear price increases.”Consumption focused on luxury goods and accessories—“quality over quantity”—has been reinforced, while the low-to-mid priced multi-item segment has weakened.The rise in BNPL usage among low-income groups may lead to a surge in defaults and credit cycle fluctuations, which could serve as a ticking time bomb for the volatility of consumer stocks.In conclusion, the e-commerce and mobile payment ecosystems, as well as retail media advertising, have secured the flow of benefits.
Expansion of K-Shaped Consumption: How the ‘Value-for-Money Reversion’ of High-Income Consumers is Shifting Market Share
Walmart recently noted in its performance commentary that it has observed an influx of high-income consumers with an annual income of over $100,000.High-income consumers are moving from Costco and Target to Walmart, capturing market share in the process.Walmart’s e-commerce has grown by about 27%, and its advertising (retail media) has grown by about 53%, accelerating structural improvements.Even dollar stores such as Dollar General (DG) and Dollar Tree (DLTR), which are considered the U.S. equivalent of “Daiso,” are experiencing visits from high-income consumers, with management noting that “the core customers have an annual income of over $100,000.”The expansion of low-price channels, despite facing the pressure of lower unit prices, is offset by traffic, repeat visits, and advertising revenue (retail media), which is the key point.
Trump-Style Domestic Demand Boost Scenario and Market Pathways (Based on Assumptions and Scenarios)
Ahead of the 2026 U.S. midterm elections, fiscal and policy momentum is highly likely to converge on boosting domestic demand.Policies being discussed include tactile measures such as tariff rebate cash distributions, income tax cuts, birth bonuses, corporate tax reductions, and requirements for employee bonuses.From a monetary policy perspective, scenarios include renewed pressure for interest rate cuts and potential changes in Fed leadership, which could lift stock market valuation levels.Should policy signals continue to suppress gasoline prices, U.S. consumer sentiment and contact retail sales may rebound resiliently.The above is based on scenarios derived from pledges and political schedules, and the stock market’s reaction may vary depending on the actual strength and timing of implementation.
From Bottom-Ranked Stocks to Leaders: 2026 Retail Investment Map (Focus Groups and Checkpoints)
-
E-commerce & Platforms
Amazon (AMZN): The triple engine of its e-commerce peak season, retail media, and AWS AI workload drives its performance.
Checklist: Advertising growth rate, shipping and fulfillment efficiency, new AI revenue pipeline from AWS, and foreign exchange fluctuations due to a strong/weak dollar. -
Value Consumption Channels
Walmart (WMT): With high-income consumer influx, e-commerce conversion, and advertising, there is potential for multiple re-ratings.Dollar General (DG) & Dollar Tree (DLTR): Leverage from traffic, checkout innovations, and expansion of small boxes.
Checklist: Comparable store sales (traffic vs. average spending), inventory turnover, proportion of retail media revenue, and shrink management. -
Potential Turnaround Candidates (Discretionary)
Nike (NKE), Lululemon (LULU), Deckers (DECK, including HOKA): After a 2-4 year adjustment period, these could enter a zone for value re-rating.
Checklist: Inventory normalization, success of new products/marketing ROI, demand in China/foreign exchange, and mix in wholesale channels. -
Apparel Revival
Abercrombie (ANF), Gap (GPS), Levi’s (LEVI): Trends such as denim and wide-fit, along with brand repositioning.
Checklist: Margin structure (promotion intensity), proportion of DTC, lead time shortening, and resharing data. -
Travel & Luxury Experiences
Airlines (such as Delta) and Hotels (Hilton, Marriott): Expanding premium seat/new luxury room mixes drive profitability.
Checklist: Gasoline/jet fuel prices, premium seat load factors, resort RevPAR, and recovery in corporate travel. -
Retail ETFs
XRT (U.S. Retail Comprehensive): For those concerned with individual risks, approaching the sector beta can be an option.
Checklist: Consumer indicators (card payments, retail sales), interest rate trajectory, and the pace of inflation moderation.
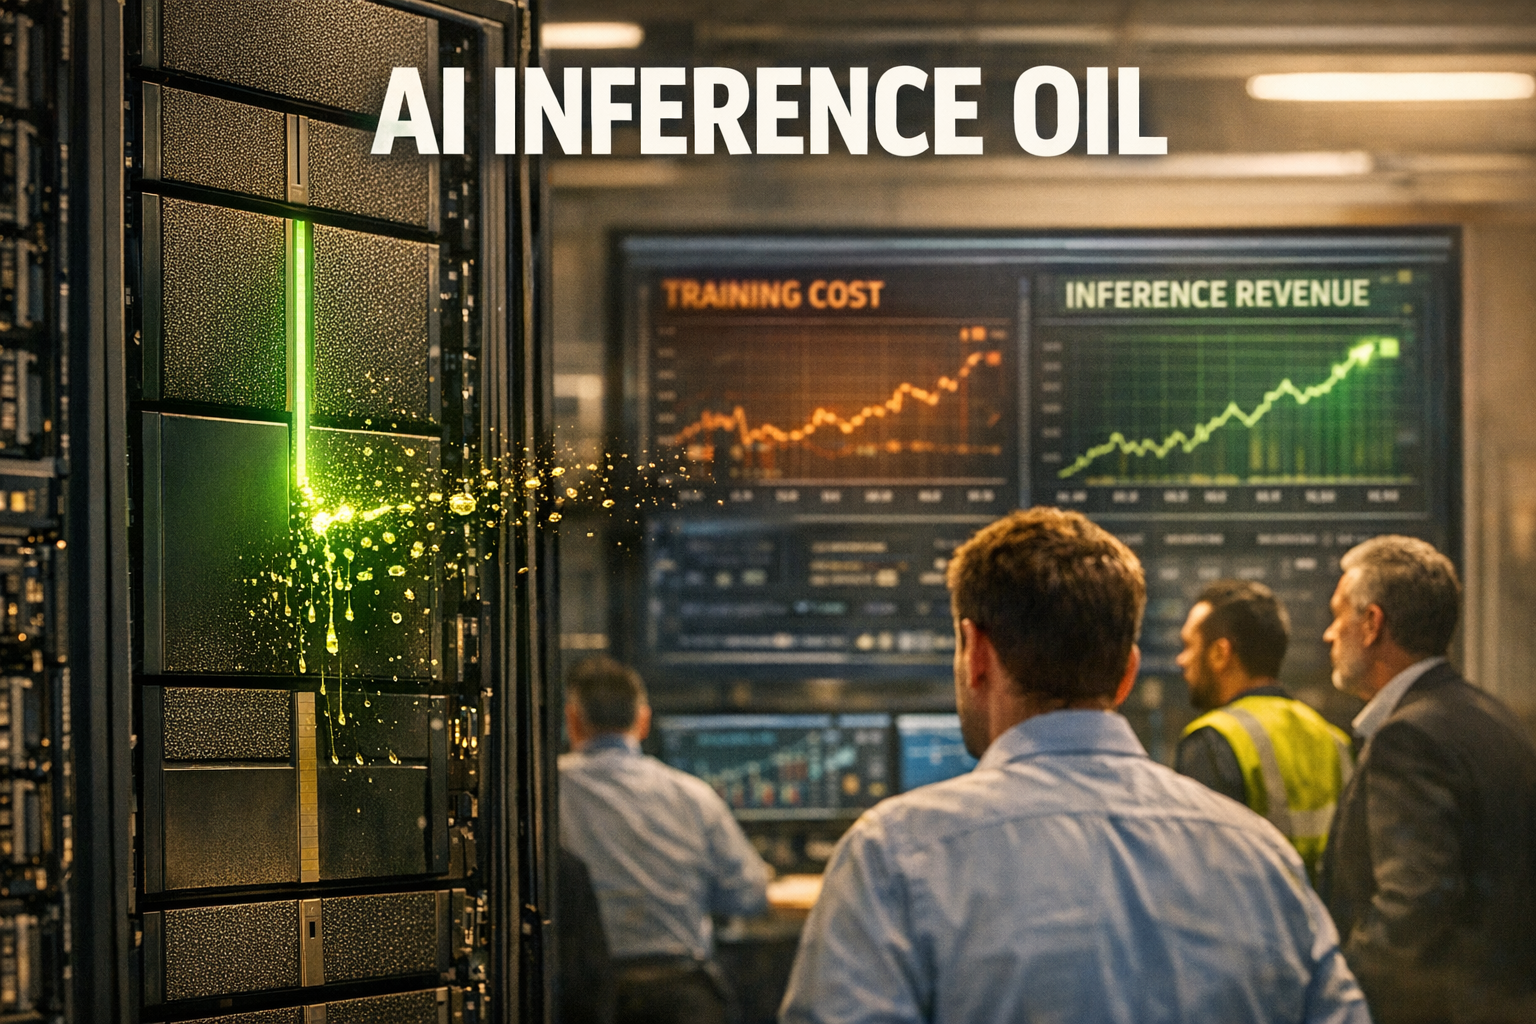
AI Trends: The ‘Hidden Margin’ of Retail Media, Demand Forecasting, and Customer Experience
Retail media networks (such as Walmart Connect and Amazon Ads) drive structural profit margins as advertising margins surpass retail margins.Generative AI improves conversion rates and reduces customer service costs by automating tasks such as writing product detail pages, personalizing search and recommendations, and handling customer support.Attaching AI to demand forecasting, price optimization, and markdown management can improve cash flows by increasing inventory turnover and reducing waste.Computer vision-based shrink reduction, unmanned payment, and last-mile route optimization redefine the productivity of offline retail.In conclusion, retailers with high AI adoption exhibit excellent margin defense even during economic recessions.
Risk Check: Points to Verify Even When They Look Promising
A rise in BNPL default rates could either accompany or precede a contraction in low-income consumption, thereby increasing the sales mix risk for large retailers.Persistent inflation, a rebound in gasoline prices, and a strong dollar simultaneously have negative effects on sales, margins, and translation gains/losses.Expanded tariffs and retaliatory tariffs pose a dual risk affecting both costs and demand.Cost pressures from rising wages, shrink (theft), and rental rates raise structural cost concerns, for which it is necessary to verify whether they can be offset by AI and automation.If interest rate cuts are delayed, the valuations of discretionary stocks may undergo a readjustment.
Execution Strategies (News-Style Guide): Let’s Move with a Checklist
Place Walmart, Amazon, DG, DLTR, and XRT at the top of your watchlist, and focus on tracking traffic, average spending per customer, inventory turnover, and advertising revenue during quarterly earnings.Track indicators such as interest rates, the dollar index, gasoline prices, alongside retail sales and card payment data, to gauge the direction of “consumer sentiment vs. costs.”While a phased, segmented approach is standard for discretionary stocks, adjust allocations flexibly in event-driven phases (earnings surprises, upward guidance revisions).Secure beta via ETFs (XRT) and allocate alpha to individual stocks with high AI and advertising proportions along with robust inventory control.Be prepared for defensive rebalancing towards low-price channels if BNPL default rates or contraction news emerges.
Key Insights Overlooked by Other Media
The “downshifting” of high-income consumers does not simply affect short-term traffic; it also alters product mix, supply chains, and the advertising ecosystem, bolstering high-margin cash flows via retail media.BNPL data serves as a de facto leading indicator of the credit cycle, with the direction of default rates determining the duration and intensity of a retail rally.There is a repeated high correlation between gasoline prices and contact retail sales, so policy signals on oil prices can have an effect comparable to a consumer re-opening.AI is not merely a “growth theme,” but a practical tool that transforms the P&L of retailers by reducing costs in shrinkage, waste, markdown, and call center expenses, leading to a re-evaluation of margin levels.
< Summary >Online strength and offline decline, with mobile payments surpassing half of transactions, have shifted the center of shopping.With high-income consumers reverting to value, Walmart and dollar stores are capturing market share, while retail media and AI drive profit margins.If the 2026 domestic demand boost scenario (fiscal and interest rate measures) materializes, a second act of the retail rally will emerge.Key risks include BNPL defaults, oil, the dollar, and tariffs, making the combination of XRT plus individual alpha plays (AMZN, WMT, DG, DLTR) effective.
[Related Articles…]
- NextGenInsight.net Latest: Collection of Consumer Insights
- NextGenInsight.net Latest: Trump Policy Checklist
*Source: [ 소수몽키 ]
– 꼴찌주들의 반격이 시작된다? 트럼프 집중 내수부양의 수혜주들
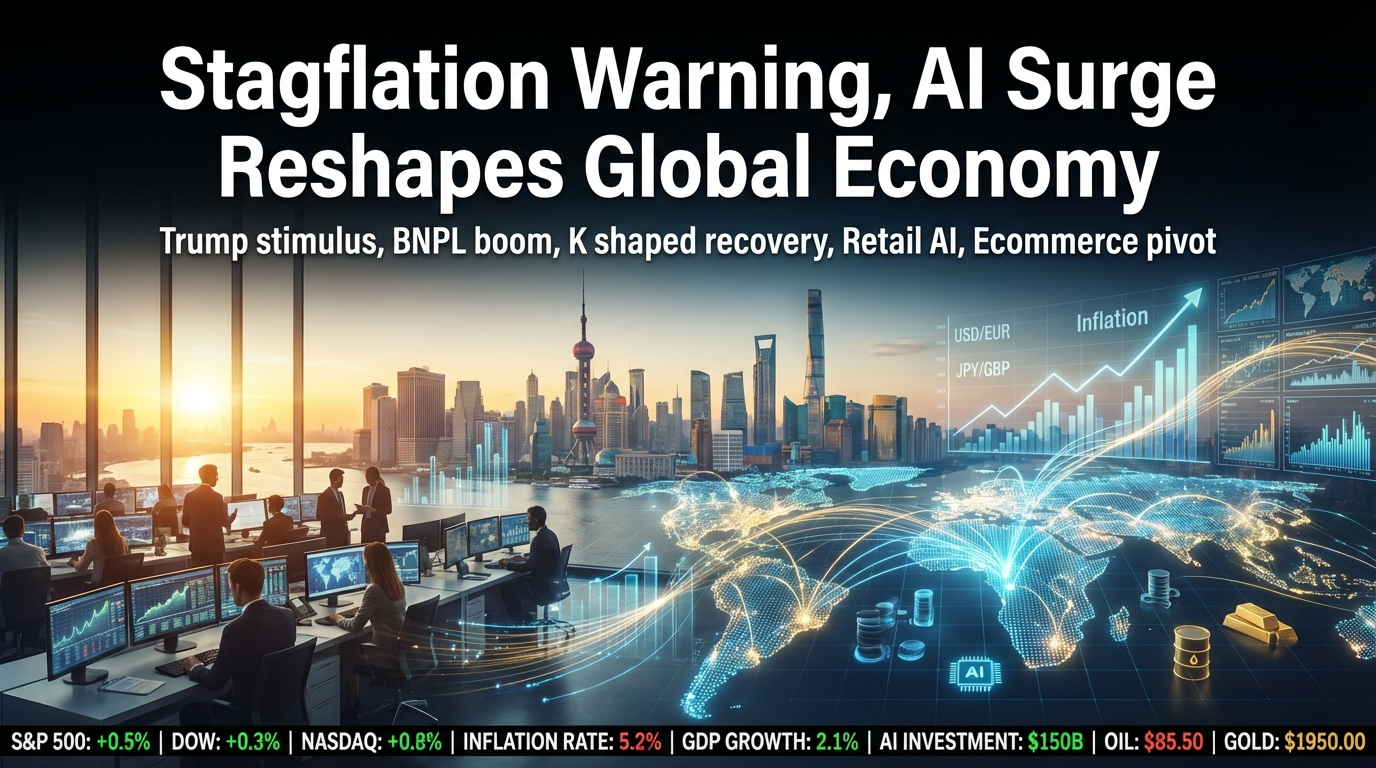
● Stagflation Looms, Global Growth Stalls
[Breaking News] OECD 2026~2027 Global Economic Outlook Overview: U.S. Stagflation Risk, World Stuck in Low Growth, Korea’s Gradual Recovery and Investment Gap
This article includes all three key points.
1) The exact context of the global economic figures for 2025–2027 presented by the OECD and region-specific differentiated risks.
2) The structural reasons behind a resurgence of inflation solely in the United States and the possibility of entering a de facto stagflation.
3) The “investment gap” amid signals of Korea’s recovery and practical response points for AI, power, and trade restructuring.
Headline Briefing: 2026–2027 Outlook in Numbers
The OECD summarized the global economy as “Resilient growth but with increasing fragilities.”
Global economic growth is projected at 3.2% in 2025, 2.9% in 2026, and 3.1% in 2027, indicating a trend of persistent low growth.
The United States is expected to grow at 2.0% in 2025, 1.7% in 2026, and 1.9% in 2027, with growth decelerating near its potential output (approximately 2%).
The Eurozone is anticipated to see growth of 1.3% in 2025, 1.2% in 2026, and 1.4% in 2027 as domestic demand normalizes and trade rebounds gradually.
Japan is projected to grow at 1.3% in 2025, 0.9% in 2026, and 0.9% in 2027, with steady domestic demand but a simultaneous slowdown in net exports.
China is expected to decelerate, with growth at 5.0% in 2025, 4.4% in 2026, and 4.3% in 2027 due to a sluggish real estate market and the fading effect of early shipments.
G20 inflation is forecast at 3.4% in 2025, 2.8% in 2026, and 2.5% in 2027, maintaining a downward trend.
However, it is noted that in the United States, the final transmission of tariffs through higher import prices may lead to additional inflation increases in the coming quarters.
Risks include changes in trade policy, a resurgence of inflationary pressures, rapid asset price adjustments, and deteriorating fiscal soundness.
Upside factors involve the easing of trade barriers, mitigation of geopolitical risks, and productivity improvements driven by investments in artificial intelligence (AI).
From an SEO keyword perspective, the core themes of this cycle are the global economy, inflation, interest rates, recession, and dollar trends.
United States: Why There Is a de facto Stagflation Risk
In terms of growth, 2026 is projected to dip below its potential growth rate, sketching a trajectory toward a “mild recession” near a downturn.
On the price front, the combination of higher import prices due to tariff increases and the downward rigidity of service prices results in a slow decline of inflation.
Although residential rental rates are softening, “sticky” items such as service wages, insurance premiums, medical expenses, public utilities, and transportation costs persist.
After hesitating to lower rates until mid-to-late 2025, delayed easing, expanding fiscal deficits, and an increase in net government bond supply are expected to destabilize long-term interest rates and the dollar trajectory.
While fixed investments related to AI, reshoring, national defense, and energy transition remain robust, bottlenecks in power, labor, and regulatory issues prevent these from quickly translating into short-term productivity gains.
Consequently, the combination of “slowing growth and persistently high prices” may create stagflationary conditions in a specific quarter of 2026.
Note: The OECD does not explicitly use the term “stagflation” but interprets the numerical mix as approaching that risk.
Key indicators include core PCE services, the re-establishment of the unemployment–vacancy (Beveridge curve) gap, credit card delinquencies, commercial real estate refinancing, and the real wage–productivity gap.
Eurozone, Japan, China: Disinflation and Low Growth, Each Facing Unique Challenges
The Eurozone is expected to experience easing energy shocks and a recovery in real wages, leading to falling prices and a modest recovery in growth.
The ECB is likely to adopt a data-dependent approach that allows for future rate cuts while remaining cautious of a potential second wave of wage increases.
In Japan, although the wage–price spiral is in its early stages, subdued growth due to declining net exports and the impact of yen fluctuations makes the gradual return to normalcy and selective exit from yield curve control (YCC) critical.
China is expected to continue its selective stimulus approach amid deleveraging in the real estate sector and fiscal pressures in local governments, with exports being restructured around AI and green manufacturing.
Korea: Bottoming Out in 2025, with a Gradual Recovery in 2026–2027… But the “Investment Gap” Remains a Challenge
The OECD projects Korea’s growth to be 1.0% in 2025, rising to 2.1% in 2026–2027, driven by a recovery in private consumption and exports.
Expansionary fiscal measures such as consumption vouchers, accommodative monetary policies, and a recovery in real wages will support demand; however, accumulating fiscal deficits will pose medium-term constraints.
Inflation is expected to be 2.0% in 2025, 1.8% in 2026, and 2.0% in 2027, remaining within the target range, though variables include exchange rates, oil prices, and public utilities.
Financial stability issues related to Seoul apartment prices and the won–dollar exchange rate may constrain the pace of rate cuts by the Bank of Korea, complicating policy mixes.
Notably, sluggish fixed-asset investment (new investment) weakens the link with improvements in employment and productivity.
Due to the overseas effects of increased U.S. investments, additional domestic capital expenditure on facilities is limited, necessitating targeted incentives to fill the “investment gap.”
A practical solution is to pursue “domestic retention” projects such as AI data centers, power infrastructure, HBM/foundry facilities, power semiconductors, and secondary battery materials.
Risks/Upsides Highlighted by the OECD: Points the Market Is Overlooking
Downside risks include further changes in trade policy, the re-emergence of inflationary pressures, rapid asset price adjustments, and deteriorating fiscal soundness.
Upside factors include the easing of trade barriers, the mitigation of geopolitical risks, and productivity gains spurred by AI investments.
Should trade barriers ease, there will be improvements in trade volume and investor sentiment, a restoration of disinflationary pressures, and enhanced visibility in interest rate pathways.
The “Non-Mainstream Key” 5 Points
1) Asymmetry in Tariff-Induced Inflation: While the United States experiences sticky inflation due to cost-push effects from import prices, non-U.S. countries benefit from disinflation via an “oversupply → price decline” channel.
2) Before AI Leads to a Productivity Coup, “Power, Land, and Substation” Become the Bottlenecks: The cost of power for data centers and transmission capacity are emerging as new constants in the cycle of service prices and capital expenditure.
3) The Divergence Between Real Economic Stagnation and Upside in Capital Markets: Persistent low growth may lead to rate cuts and liquidity swings, bolstering sectors such as big tech, AI infrastructure, and quantum momentum.
4) Market-Priced Fiscal Space: There is an extended period during which market interest rates are more influenced by net government bond supply and maturity premiums than by central bank policy signals.
5) Korea’s Edge Lies in the “Domestic Infrastructure–Export Balance”: Simultaneously fostering export growth in HBM and foundry while developing a domestic ecosystem for power, cooling, and campus-type data centers is essential for creating a virtuous cycle of employment and productivity.
AI Trend 2026–2027: Moving from Investment to Power to Productivity in an S-Curve
Until 2026, AI investments will be concentrated in GPUs, HBM, servers, cooling, and power facilities, causing a surge in capital expenditure.
Power constraints will be the largest bottleneck, as upgrades in generation capacity, transmission and distribution, demand response (DR), and liquid cooling will occur simultaneously.
From 2026 to 2027, rapid penetration of copilots and agents into actual operations will lead to visible reductions in work time and error rates.
Total factor productivity (TFP) is expected to improve gradually by about 0.3–0.7 percentage points initially, with data governance maturity determining the gap in outcomes.
Korea’s opportunities lie in addressing key bottlenecks such as HBM yields and advanced packaging, specialized foundry processes, data center power equipment, power semiconductors, and thermal management materials.
Checklist for Asset Markets and Business Positioning
Dollar: Increased volatility is expected amid a delicate balance of sticky U.S. inflation, fiscal deficits, and slowing growth.
Interest Rates: While short-term disinflation is anticipated, long-term bonds remain sensitive to fiscal and supply variables, necessitating duration risk management.
Stocks: In the medium term, sectors with AI infrastructure (semiconductors, power, cooling, optical communication) along with efficiency/automation software are strong candidates for excess returns.
Commodities: Real demand for copper, power, cooling materials, and high value-added materials will be enhanced, linked to the “AI electrification” theme.
Korean Companies: It is time to consider extending the value chain with investments in memory, packaging, power equipment, EMS, data center operations, and energy management software.
Policy Recommendations: The Triangular Formation of Predictability, Financial Stability, and Investment Activation
Enhance predictability in trade policy to help companies establish long-term investment plans, and phase out unnecessary trade barriers gradually.
Monetary policy should remain vigilant against inflation while adopting a gradual, data-driven stance that considers financial stability issues (real estate and exchange rates).
Fiscal policy should set clear fiscal rules and prioritize quality-enhancing expenditures such as investments in AI, power, and green infrastructure.
Korea should concurrently pursue measures like fast-tracking permits for data centers and power facilities, reforming power tariff structures, and packages for workforce retraining to incentivize new investments.
Comparative Framework: IMF/World Bank vs. OECD
The IMF uses PPP-based comparisons and the World Bank employs market exchange rates, making simple numerical comparisons difficult; however, all three institutions agree on the overall trend of persistent low growth.
The OECD’s December forecast reflects the latest update following the APEC signal of tariff reductions after tonnage cuts, clearly illustrating the risk allocations for 2026.
Action Items for Korean Practitioners
Exports: Expand the lineup of AI servers/memory, power semiconductors, and optical modules, and pursue diversification of customer bases.
Procurement: Adopt a conservative approach to lead times for power, cooling, racks, and substation equipment and establish proactive securing strategies.
Finance: Manage dollar–won exchange risks and separate short- and long-term interest rate spreads while maintaining an elevated liquidity buffer.
Strategy: Develop an investment roadmap that considers domestic data center campus clusters and their linkage to regional power grids.
< Summary >The global economy will continue to exhibit persistent low growth from 2025 to 2027.
In the United States, the combination of slowing growth and persistent inflation intensifies the stagflation risk in 2026.
The Eurozone and Japan will experience a modest recovery amid disinflation, while China’s structural deceleration continues.
Korea could see growth in the low-to-mid 2% range in 2026–2027, driven by a recovery in consumption and exports; however, the investment gap remains a challenge.
AI investments will transition from resolving power bottlenecks to driving productivity gains, with significant opportunities for Korea in HBM, power, and data center infrastructure.
Policy should focus on three pillars: trade predictability, inflation vigilance, and qualitative fiscal expansion.
[Related Articles…]
US Stagflation Risks and the Direction of the Dollar
AI Data Center Power Crisis: Which Korean Industries Will Benefit?
*Source: [ 경제 읽어주는 남자(김광석TV) ]
– [속보] OECD 2026년 경제전망, “미국 스태그플레이션 진입할 것”. 세계 경제는 ‘저성장 고착화’에 놓인다 [즉시분석]
● AI Bubble Myth, 10-Year Megacycle Spurs Korea’s Industrial Boom
The Real Reason Why Super Retail Investors Aren’t Worried About the AI Bubble: A 10-Year Megacycle, Algorithmic Volatility, and Korea’s ‘Forge’ Strategy
This article contains the following.
– The key evidence refuting the AI bubble theory and the direction of the US dollar and power infrastructure policies.
– Why Korea’s CCL, HBM, and SMR are likely to benefit simultaneously amid TPU and GPU competition.
– A checklist for value investing to survive a volatile KOSPI market and strategies for downturns.
– The essence of the ‘Terminator Market’ created by algorithmic trading and survival strategies for individuals.
– Mechanisms where power and material supply chain bottlenecks—rarely discussed in other content—determine inflection points in earnings.
One-Line News Summary
The US is expected to continue investing in power and data center infrastructure using dollar liquidity until it wins the AI hegemony battle with China.
Short-term sharp declines, occurring while the intrinsic value of companies remains intact, are likely due to volatility driven by algorithmic trading.
Korea is playing the role of a ‘forge’, and there is a high probability that structurally, core supply chains such as HBM, CCL, nuclear power (SMR), and gas turbines will continue to benefit.
The Big Picture of the AI Megacycle: A 10-Year Wave Market
The key is performance.
The revenue engine of AI infrastructure is the expansion of data centers and investment in power infrastructure, which is hard to diminish despite interest rate and inflation noise.
Like the Manhattan Project during the ‘Oppenheimer’ era, the US will not reduce its budget when it comes to areas involving hegemony.
Though there are supply chain constraints such as power shortages, transformer lead times, cooling, copper, and semiconductor materials, these are factors that call for extended investment periods.
Stock prices are likely to advance with cyclical fluctuations, and when interpreted as a 10-year economic cycle, mid-term sharp declines can be seen as adjustments within the structural trend.
It’s Not a Bubble, It’s Whether ‘Performance Has Slowed Down’
A company’s intrinsic value is its ability to make money, so the key criterion is whether its performance has slowed.
As long as there is continued AI demand, power infrastructure investment, and data center CAPEX, the upward trend in performance remains valid.
Even if expectations of interest rate cuts waver, the dollar funding for strategic industrial investments in the US is expected to continue.
Thus, short-term sharp declines might simply be price fluctuations coinciding with profit-taking and news catalysts, which should be distinguished from ‘value erosion.’
TPU vs GPU: Not a Competition, but an ‘Overall Demand Expansion’ and Structural Winners in Materials
Even if Google’s TPU increases its market share, high-performance CCL, packaging, substrates, and power solutions will require the same or even higher specifications.
Materials such as Doosan’s CCL, already validated in the NVIDIA chain, become a choice in terms of quality and reliability even with TPUs.
For TPUs to offer price competitiveness, they must maintain quality, which implies that the demand for high-spec materials remains unchanged.
In conclusion, even if there is a change in chip winners, demand for HBM (SK Hynix), CCL (Doosan), advanced packaging, and power equipment is likely to be neutral or better.
Korea’s ‘Forge’ Strategy: Where Are the Structural Beneficiaries?
– Memory: HBM is key to overcoming bottlenecks in AI computation, and its competitiveness lies in SK Hynix’s capacity and quality.
– Materials and Parts: High-spec laminates, packaging materials, and substrates like Doosan’s CCL are essential for both GPUs and TPUs.
– Power and Nuclear: SMR, gas turbines, ultra-high voltage transformers, and cooling systems are directly tied to expanding data center power grids.
– Legacy Memory and Storage: The explosion of data also stimulates demand for legacy products such as DRAM and NAND.
This sector is directly linked to US strategic investments in supply chains, and while exchange rates and dollar flows may have an impact, the direction is interpreted as demand-driven.
The ‘Terminator Market’ Created by Algorithms: The Nature of Volatility
The intraday volatility of large-cap stocks is greater than before, and there are days when markets fall by -8% without any event.
Algorithms learn human patterns of fear and greed, causing market swings and prompting chasing high prices and dumping at lows.
While price signals have become noisier, value signals such as supply chains, orders, and facility investments have actually become clearer.
Ultimately, the survival strategy is to focus on ‘value’ rather than ‘price’ and to extend the time frame.
Downturn Know-How: A Checklist Before Hitting the Sell Button
– Performance: Check if consensus for sales and operating profits has faltered, or if guidance has been revised downward.
– Orders and Capacity: Review any changes in new orders and expansion plans related to data centers and power infrastructure.
– Supply Chain: Monitor changes in bottlenecks and lead times for key items like HBM, CCL, and transformers.
– Policy and Interest Rates: Evaluate the actual impact of US strategic industrial support, interest rates, and dollar trends on CAPEX.
– Valuation: After short-term sharp declines, assess whether PER/EV-EBITDA is reasonable compared to growth rates.
– News vs. Facts: Distinguish between a ‘justification for a sharp decline’ and ‘value erosion,’ and if there is no value erosion, respond with staggered buying.
Outlook on KOSPI Volatility Roadmap
The index may experience large swings, surging from 2,200 to 4,200 and then adjusting in the 3,800 range.
This range is seen as an adjustment within the economic cycle, and whether a new high is broken determines the strength of the next wave.
To view price fluctuations as opportunities, first check the intrinsic value trajectory of the stock along with its orders and capacity cycle.
Value Investing Philosophy: ‘Verifying the Truth’ Rather Than a Target Amount
The reason assets continue to grow even after reaching a certain size is to continually verify the investing truth of ‘convergence to intrinsic value.’
It is crucial to trust that a seed will eventually grow into a tree without rush.
Investment education in plain language and sharing experiences to reduce financial illiteracy increases individual survival rates.
Key Points Not Often Mentioned in Other YouTube or News Sources
– Power infrastructure bottlenecks will eventually determine the upper limits of performance.
The longer transformer, copper, cooling, and site regulation lead times extend, the more prolonged the CAPEX period becomes, thereby extending the profit duration of material and equipment companies.
– The rise of TPU does not diminish the pricing power of high-spec materials.
On the contrary, the credibility premium of ‘proven CCL and packaging’ may be reinforced, potentially intensifying winner-takes-all outcomes.
– In an algorithm-driven market, the true edge is not ‘information’ but ‘time.’
The ability to withstand the same facts over a longer time frame determines long-term returns.
Practical Investment Operation Guide: Quarterly Review Routine
– Quarterly Earnings: Record trends in sales, profits, order backlogs, inventory, and margins against consensus.
– CAPEX/Power: Schedule key dates for data center power consumption, transformer expansions, and investment plans in transmission and distribution.
– Exchange Rates and Dollar: Manage exchange rate exposure by matching sales currencies with cost currencies.
– Risks: Monitor geopolitical issues, regulations, and price/performance ratios of competitors’ new products.
– Actions: Apply the principle of staggered buying when there is no value erosion accompanied by a sharp decline, and staggered selling when there is value erosion despite a rebound.
Points to Watch for 2026
Even if interest rates gradually moderate, investments in power and data centers and supply chain bottlenecks will not be easily resolved.
If inflation surges again, the cycle for energy and power equipment may be further extended.
In periods of a strong dollar, separate the effects of increased import costs and foreign currency sales for each stock.
A strategy of positioning at the intersection where national policies and corporate CAPEX meet is effective.
Building Mental Resilience for Downturns
Focus less on the market and more on company reports.
Before selling, first check if there are any issues within the company.
If no issues are found, switch from selling to staggered buying.
To avoid being swayed by prices, automate decision-making with a pre-determined checklist and manual.
Economic Keywords Recap
Direction of interest rates increases volatility, but strategic industrial CAPEX is highly likely to continue.
Inflation may extend the cycle through higher equipment prices and longer lead times due to delays.
Dollar liquidity aligns with the US strategy for AI hegemony.
Mid-cycle corrections do not break the structural trend.
Supply chain bottlenecks are factors that prolong the profit periods of material and equipment companies.
< Summary >
– AI is more likely to follow a ’10-year megacycle’ rather than being a bubble, and short-term sharp declines may be due to price fluctuations driven by algorithms.
– The US will continue to invest in power and data center infrastructure using dollars and policies, while Korea’s HBM, CCL, SMR, and gas turbines are set to benefit structurally.
– Regardless of the TPU vs GPU competition, high-spec materials and parts will benefit from overall demand expansion.
– The survival strategy is to follow a value investing checklist, extend the time frame, and react based on the presence or absence of value erosion during downturns.
[Related Articles…]
AI Hegemony Battle and Korea’s Semiconductor Supply Chain
Interest Rate Transition and the Megacycle of the Stock Market
*Source: [ Jun’s economy lab ]
– 슈퍼개미가 AI버블 걱정을 하지 않는 이유(박두환 대표 1부)