● AI Price Bloodbath, BAI Gold Rush
Oracle·Broadcom Earnings Big Event Week: From the ‘Peak-Out’ Signal of AI Investment Controversy, to Software Counteroffensive and the 2026 BAI (Non-Technology Beneficiary) Scenario, All Summarized at Once
This article neatly encapsulates Oracle’s credit risk ‘peak-out’ signal that could trigger a stock rebound, Broadcom’s AI networking momentum, Salesforce and Adobe’s shift to usage-based AI pricing, Synopsis’ re-rating conditions, and the roadmap of OpenAI vs. Google’s price war and the spread of BAI.
It is perfect as a final checklist for investment before committing, covering the global economic outlook, interest rates, inflation, tech stocks, and perspectives on AI investment.
This Week’s Key Calendar and Points of Interest (Source: Based on the provided original text; dates are subject to change)
-
Oracle (after market close on 12/10): The possibility that the resolution of AI overinvestment controversy will act as a switch for a software rally.
-
Broadcom (12/11): Key points include continued AI networking/ASIC orders and defending cash flow generation.
-
Synopsis (12/10): Monitoring whether easing US-China risks, Intel’s recovery, and the resolution of M&A uncertainties occur.
-
Adobe (around 12/12): The focus is on whether numbers will confirm fears of generative AI encroachment or the cohesion of pro workflow.
-
Salesforce (recent announcement): The shift from a seat-based to a usage-based AI pricing model is emerging as a signal of structural improvement.
-
Meta (ongoing): Indications of cost risk management through budget cuts in the metaverse and a multi-vendor GPU strategy.
Oracle: Will the CDS Peak-Out Lead to a Stock Bottom?
The key issue was “debt and cash flow risks stemming from AI data center investments.”
Recent trends in credit risk indicators such as the 5-year CDS have shown a ‘decline after a peak,’ suggesting the possibility of having peaked excessive concerns.
If this signal persists, it may lead to a resolution of valuation discounts → and herald the beginning of a re-rating.
-
Points to look at in the numbers: OCI (cloud infrastructure) growth rate, new contracts and backlog related to GenAI, data center CAPEX guidance, FCF deployment, and debt maturity structure.
-
Scenario: If performance alleviates concerns, it could trigger a stock rebound and lead to improvements not only in software as a whole (IGV) but also within the AI infrastructure partner ecosystem.
-
Risk: If margins and cash flows continue to be pressured without a reduction in CAPEX, the rebound may be limited.
Broadcom: Verifying the AI Networking Cash Machine
Broadcom has sustained high growth through its focus on AI switching and custom silicon (ASIC), and maintained robust cash generation along with the integration effects of acquired businesses.
This earnings report will hinge on the sustainability of AI networking demand and the maintenance of margins.
-
Checklist: Updates on the AI revenue share, pipeline for switches and niche ASICs, defense of GPM/OPM, FCF/shareholder returns, and comments on stock and lead times.
-
Market signal interpretation: Solid guidance could lead to a reduction in the risk premium across the entire AI hardware chain.
Synopsis: Three Conditions for a Re-rating After Two Years of Adjustment
Despite being the undisputed leader in EDA with a long-term upward story, prolonged valuation discounts over two years have accumulated due to US-China regulations, underperformance of major customer Intel, and large M&A variables.
Recent conditions show signs of gradual improvement.
-
Condition 1: Easing of the US-China export restrictions (reduced uncertainty of additional sanctions).
-
Condition 2: Progress in process/foundry/factory strategies and normalization of design tool investments from key customers such as Intel.
-
Condition 3: Clarification of pricing, regulatory, and integration risks related to large-scale M&A (regarding Enics-related matters).
-
Numbers to watch: RPO/backlog, commercial license renewal rates, sales mix between China and the US, and the recovery of operating leverage.
Salesforce·Adobe: The Battle Between the AI Pricing Model of ‘Encroachment vs. Cohesion’
Salesforce had concerns over the structural slowdown of its seat-centric revenue model, but its transition to a ‘usage-based pricing’ model driven by AI agents signals structural improvement.
For enterprise customers, the lowered TCO relative to labor costs accelerates adoption.
-
Salesforce checklist: Proportion of revenue from usage, NRR, attachment rate of AI add-on modules, and margin profile of non-license revenue.
-
Adobe checklist: Integration with pro workflows such as Firefly/Frame.io, ARPU maintenance, and enhanced trust functions through content provenance (captioning/watermarking).
-
Interpretation: The ‘falling penetration’ of generative AI is beneficial for end-users but simultaneously induces margin compression and intensified differentiation competition for platform operators.
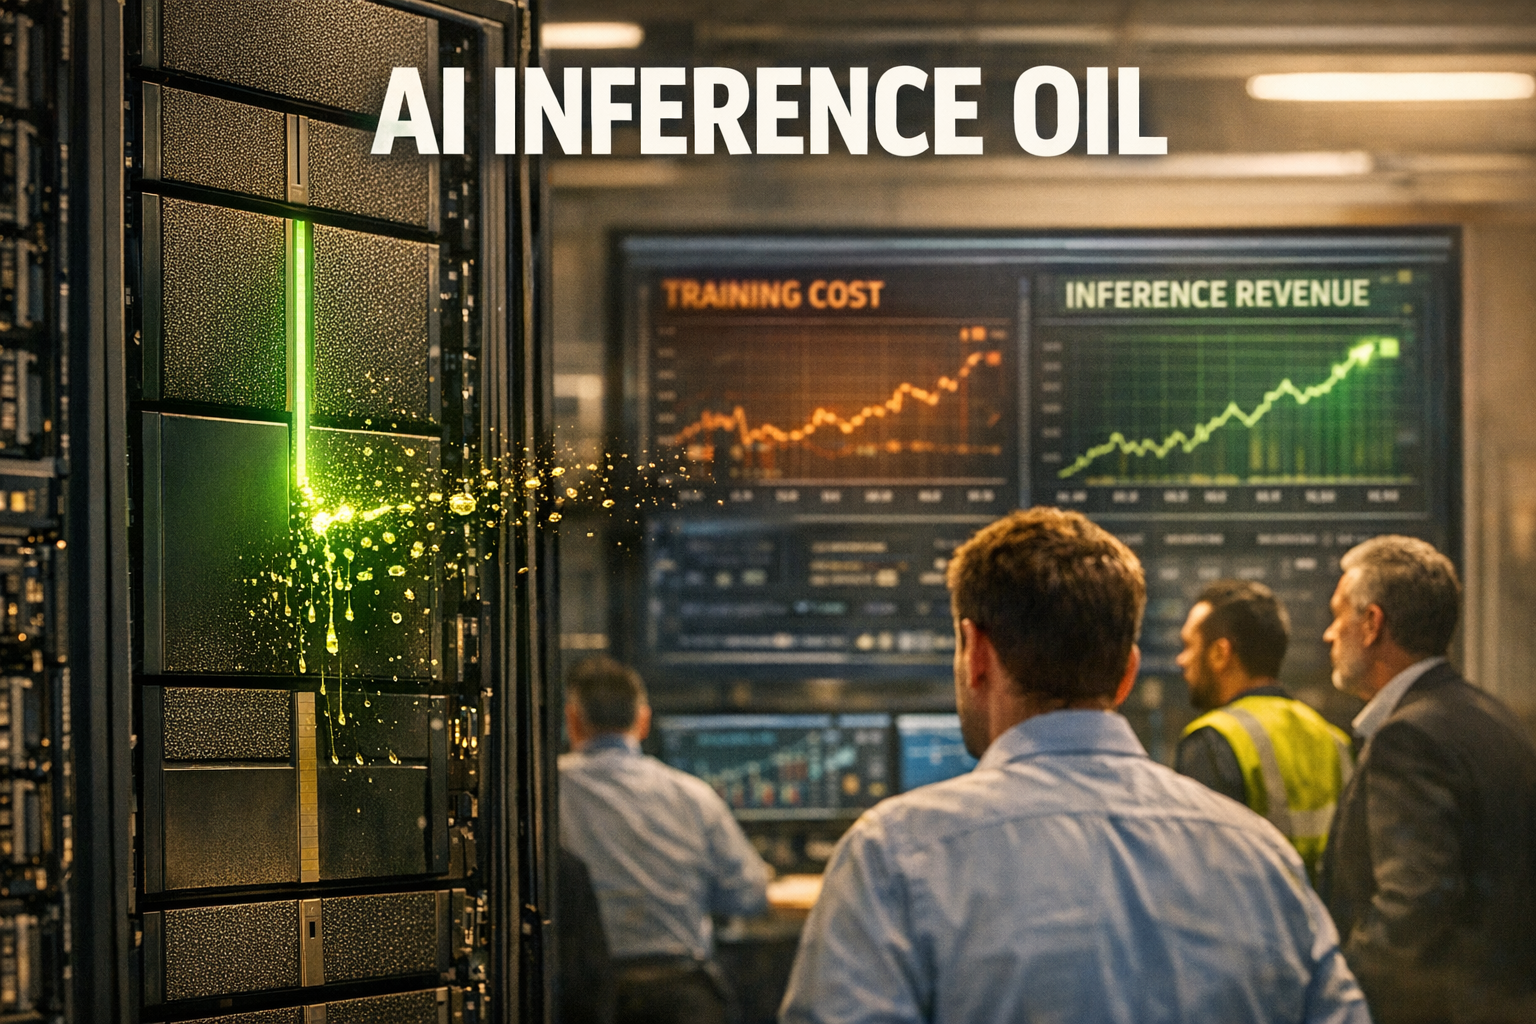
OpenAI vs. Google: AI Deflation Created by the Price War, and the Spread of BAI
As the gap in model performance narrows and price competition intensifies, the token/agent pricing is rapidly stabilizing downward.
This lowers the cost for companies adopting AI, accelerating adoption, and could lead to the spread of ‘BAI (Non-Technology Beneficiary)’.
-
Short term: Increased volatility in the revenue/margin guidance of model providers (hyperscalers and foundational model companies).
-
Mid term: Revenue recovery through usage-based pricing, domain-specialized models, and bundled premium features.
-
BAI point: Indicators such as reduced SG&A as a percentage in consumer, manufacturing, logistics, and healthcare, increased revenue per employee, and shortened lead times/returns will appear first in the numbers.
Meta: Dieting Costs and Supply Chain Risks
Meta is drawing a picture of managing both costs and risks through signals of budget cuts and workforce restructuring in its metaverse division, along with diversifying GPU suppliers.
The key is whether cost optimization, done within limits that do not impair platform growth, will really translate into improved margins.
Sector Strategy Viewed Through IGV: A Checklist for a Rebound in ‘Overly Adjusted Stocks’
The top constituents of IGV (US Software ETF) (Oracle, Adobe, Salesforce, Palantir, MS, etc.) are bound by the same macro framework.
-
Macro key: A peak in interest rates and easing inflation provide tailwinds for tech stock valuations, while a strong dollar poses headwinds for software companies with high overseas revenue shares.
-
Factor: Relative strength may favor companies with strong cash flow defense and pricing power over high-growth stocks.
-
Tactic: Instead of chasing highs after gap-ups due to earnings surprises, it is generally advantageous to approach those stocks with larger divergences between guidance and stock decline in fractions.
This Week by the Numbers – Checklist
-
Oracle: Check whether OCI YoY growth accelerates (e.g., a recovery in the 30% range would signal renewed confidence), a reduction in the CAPEX/FCF gap, debt maturity schedule, and a drop in the CDS.
-
Broadcom: Look for an upward update in AI networking revenue/orders guidance, defense of GPM, normalization of inventory days, and continuity in the FCF/dividend/stock buyback track.
-
Synopsis: Monitor RPO growth rate, stabilization of the China/US sales mix, comments on the recovery of large customers, and mitigation of M&A integration risks.
-
Adobe: Track digital media net growth, ARPU and churn rates, and references on enterprise adoption through Firefly usage.
-
Salesforce: Check for growth in usage-based revenue, upward revision in operating profit margin guidance, and the upgrade rate of AI add-on services.
“Key Insights Not Covered Elsewhere”
-
Leading nature of credit indicators: Oracle’s CDS peak-out is one of the conditions for a stock bottom, and it often moves about half a tempo ahead of earnings.
-
TCO reversal juncture: The usage-based pricing of Salesforce and Adobe is a signal that the “AI processing cost relative to labor” has dropped below the critical threshold.
-
The paradox of the price war: Although compression of model margins is negative, it drives higher overall adoption rates which boosts EPS upside for BAI.
-
Cash flow is king: In a high interest rate environment, valuation discounts due to market conditions are overcome by free cash flow.
-
Multi-vendor risk hedge: Strategies like Meta’s, which reduce dependency on a single GPU or model, lower the long-term risk premium.
Macro Triggers: The Intersection of Global Economic Outlook, Interest Rates, Inflation, and Tech Stocks
A peak in interest rates and easing inflation are conditions for multiple expansion, while a strong dollar is a headwind for software companies with a high proportion of overseas revenue.
When the Fed’s communication shifts from “higher rates for longer” to “gradual easing,” earnings surprises can easily lead to an expansion in valuations.
ETF·Event Briefing (Information Provided)
An announcement from PLUS ETF states that a full portfolio purchase certification event to celebrate the “Triple Crown” achievement is ongoing until 12/31.
Detailed conditions and prize instructions need to be checked via separate links/channels, and this is for informational purposes only, not investment advice.
Risk Note
-
Earnings volatility: Greater sensitivity to AI-related guidance may lead to increased volatility driven by headlines.
-
Policy and regulation: Changes in US-China/EU competition laws and export controls could asymmetrically affect the EDA and cloud sectors.
-
Cost curves: The impacts of power costs, GPU procurement, and data center CAPEX on TCO are likely to resurface.
One-Line Strategic Summary
This week, if the “credit indicator peak-out + cash flow defense + transition to usage-based pricing amid the price war” align, a short-term re-rating in the software and AI chain is possible.
Check the patterns in the numbers and guidance, along with the structural improvement indicators of potential BAI beneficiaries.
< Summary >
-
Oracle’s CDS peak-out could be a signal that the AI overinvestment controversy is easing, and if confirmed by earnings, it may reignite the software rally.
-
Broadcom’s focus will be on sustained orders for AI networking/ASIC and margin defense, and if solid, the risk premium across the hardware chain could diminish.
-
Synopsis may see a re-rating if the three major uncertainties related to US-China issues, key customers, and M&A are alleviated.
-
Salesforce and Adobe are in a phase of confirming the balance between ‘encroachment risks vs. cohesion’ through the shift to usage-based pricing and pro workflow integration.
-
The model price war, despite compressing margins, accelerates adoption, thereby boosting the EPS upside of BAI.
-
Macro conditions—interest rates, inflation, and the dollar—determine the ‘breath’ in tech stock valuations.
[Related Articles…]
- 2026: The Tipping Point of AI Investment Winners and the Semiconductor Cycle
- The Impact of Interest Rate Peak-Out on Tech Stock Valuations
*Source: [ 소수몽키 ]
– 중요한 순간 앞둔 오라클 & 브로드컴, AI 랠리 되살릴까
● AI Surge, No Crash
Even in Adjustments, There Is No Collapse: The Asset Structure Reshaped by AI Innovation, and Why Now is the Opportunity
Key Points Contained in Today’s Article
Right now, discover why “fearless opportunity” lies hidden in a market correction.
It summarizes the rationale behind “there is a bubble but no collapse” based on the financial structure and cash generation capability of mega tech companies.
It presents a method to differentiate vendor financing and circular investment controversies using real demand indicators.
It depicts an investment map of AI innovation divided into software and physical AI, and a next-leader replacement scenario.
It provides a three-stage framework for creating a ‘lifetime salary’ structure with dollar assets.
From the perspective of economic outlook, it explains the structural significance of U.S. stock market corrections and the timing of transitioning between active and passive strategies.
News Summary: Market Diagnosis and Key Arguments
Although adjustments are occurring, the scenario of collapse has a low probability.
The reason is the inherent strength of mega tech companies, whose debt ratios are mostly below 50% and whose annual free cash flow and capital generation exceed $100 billion.
AI innovation is unfolding as a structural investment cycle following the era of cloud, rather than being a one-off momentum.
Although individual stocks inevitably exhibit high volatility during overheat phases, the overall demand trajectory of the ecosystem remains intact.
Unlike the past decade of passive dominance, the field of innovation increasingly rewards excess returns and possibilities for active management.
Assuming a collapse of the U.S. stock market bubble would require simultaneous occurrence of a collapse in real demand and a credit crunch, and current macro data do not suggest such a shock.
Throughout this article, investment interpretations are attached based on key keywords such as U.S. stocks, economic outlook, AI innovation, dollar assets, and mega tech companies.
Vendor Financing and Circular Investment Controversies: Fact-checking Points
Circular investments and vendor financing are common in technological cycles.
The issue is not the structure but the continuity of demand.
The criteria are as follows.
- Customer Usage Indicators: Check monthly token generation, GPU usage hours, and the growth rate of enterprise AI workloads.
- Timing of Cash Flows: Examine the debtor days (DSO) for infrastructure companies, and the gap between operating cash flow and investing cash flow in the cash flow statement.
- Quality of Cloud CapEx: Check whether there is an increase in investments in AI inference facilities, power, and cooling rather than mere expansion.
- Price-Demand Dynamics: Look at whether prices for HBM, optical modules, and networking are easing gradually while maintaining demand.
- Cancellation Risk: Track sudden CapEx halts by major customers like the 2017 cloud order cancellations.
If these five factors are normal, vendor financing acts as a mechanism for leveraging, and collapse theories lose their power.
Conversely, if a slowdown in usage along with large customer investment halts occur together, circular investments become a gateway to amplifying losses.
AI Innovation Investment Map: Software vs. Physical AI
In AI, ROI comes first in back-office processes rather than in “user-experience apps.”
- Software Layer: Growth is driven by models/agents, data platforms, MLOps, security, and inference optimization.
- Physical AI Layer: Data centers, power and cooling, high-bandwidth memory (HBM), networking, optical modules, and robotics relieve bottlenecks.
This year, the investment frontier has broadened from a single software theme to include physical AI.
During the expansion phase, excessive expectations cause some stocks to plummet.
However, following the bottleneck-relief axes (power, HBM, networking), new leaders emerge through replacement.
A simultaneous two to three-stage propagation is underway from “mega tech → components/materials → application services.”
Risk Radar: Signals That Could Escalate into a “Collapse”
Unless the following signals occur simultaneously, the market is likely to remain in a correction phase.
- Widespread sudden halt in CapEx by major customers and supply chain order cancellations.
- Continuous decrease in AI usage indicators and a sharp drop in SaaS net revenue retention (NRR).
- A rapid widening of high-yield spreads, suspension of medium- to long-term corporate bond issuance, and a credit crunch.
- Delay in data center ramp-up due to bottlenecks in power and cooling causing downward revisions of sales guidance.
- Damage to revenue models due to regulatory shocks.
If two or three of these signals occur simultaneously, it is necessary to switch to a defensive mode.
Strategy: Portfolio Playbook During a Correction
A hybrid strategy that combines a core index with active tips proves effective.
- Core: Absorb volatility by investing in U.S. large cap and quality indices.
- Satellite: Gradually purchase positions in sectors benefiting from physical AI bottleneck relief (power, HBM, networking) and enterprise AI-adopting SaaS.
- Rebalancing: Realize profits when sectors surge more than 15–20% and reallocate gradually for sectors that fall by 10–15%.
- Cash-Generating Assets: Secure dividend and interest flows with U.S. dollar-denominated government bonds and IG short-term bonds to enhance psychological defense.
- Risk Management: Avoid concentrating solely on individual themes, and absorb cyclical rotations through diversification by industry and value chain.
Creating a “Lifetime Salary” with Dollar Assets: A Three-Stage Framework
Stability Bucket (6–24 months of expenses): Bolster cash flows with dollar short-term bonds, money market funds, and deposit assets.
Income Bucket (5–7 years timeline): Generate monthly/quarterly cash flows with IG, preferred stocks, and dividend growth ETFs.
Growth Bucket (7+ years): Aim for real value appreciation through indices and qualitatively active strategies that encompass mega tech and AI innovation.
The proportions of the three buckets can be adjusted based on age, income stability, and target withdrawal rate.
The key is to simultaneously hedge against economic, exchange rate, and policy risks through dollar assets.
Considering Korea’s low growth and aging structure, gradually increasing the proportion of cash flows in dollars is a rational approach.
Active vs. Passive: A Mixture is the Answer Now
Passive strategies automatically ride on the structural growth of mega tech.
However, in innovation phases, alpha is created by active management.
A combination of 70–80% index and 20–30% thematic/quality active strategies is exponentially advantageous during a correction.
The era when simply chasing the “index returns” was sufficient is over, and decisions that read the direction of innovation can widen the return gap.
Core Element That Other YouTube/News Outlets Fail to Mention
The key to AI demand is judged by the physical constraint of “power.”
The speed of power and cooling infrastructure expansion determines data center ramp-up and the decline in inference pricing.
This means that not only hardware but also the margin structure of software companies is directly connected to power efficiency.
Therefore, power pricing, PUE improvements, chip efficiency, and model streamlining are all linked as an investment principle.
Ultimately, the contrarian idea that “AI is a power business” will be the axis of revaluation in this cycle.
3–12 Month Scenario: Rotation and Leader Replacement
3–6 Months: Within a period of correction and consolidation, individual stock volatility increases and the relative strength of quality and cash-flow stocks rises.
6–12 Months: As bottlenecks in power and HBM ease, a second wave of beneficiaries in physical AI emerges, and software companies with proven references in actual adoption are re-evaluated.
New leaders will emerge from companies that “solve bottlenecks” and those in “enterprise AI with proven ROI.”
Conclusion: Why is This Correction an Opportunity?
The fundamentals of mega tech and the real demand behind AI innovation remain robust.
Triggers capable of causing a collapse are still lacking, and the correction is a healthy process to cool down an overheated market.
Securing cash flow based on dollar assets, and adding active strategic tips centered on bottleneck relief, increases the probability of success.
Looking at the bigger picture of the economic outlook, this correction is a time to select the next leadership.
< Summary >
- Key: There is a bubble in part, but the probability of collapse is low.
- Reason: Low debt ratios of mega tech, high cash generation, and continuous real demand for AI.
- Check: Identify collapse signals through usage, CapEx, power bottlenecks, and credit spreads.
- Strategy: Core index plus active additions along bottleneck axes; three buckets based on cash flow from dollar assets.
- Focus: The contrarian viewpoint that “AI is a power business” and the direction of leader replacement.
[Related Articles…]
- How to Utilize U.S. Stock Market Corrections: Defend and Seize Opportunities with Quality and Cash Flow Stocks
- How AI Innovation is Changing the Asset Structure: Power, HBM, and Networking Lead the Revaluation
*Source: [ 경제 읽어주는 남자(김광석TV) ]
– 조정은 있어도 붕괴는 없다 “지금 조정장이 오히려 기회”인 이유는? AI 혁신이 만든 새로운 자산 구조 | 경읽남과 토론합시다 | 채상욱 대표 3편
● Fed Cut Backfires, Dollar Roars, Korea Faces 1,500 KRW Shock
The Real Reasons Why the Won Cannot Be Suppressed Even if Interest Rates Are Cut in December: Rising U.S. Treasuries, Stubborn Inflation, Korea’s Unique Dollar Supply and Demand, and the Headwinds of AI Capital Expenditure.
Key Headlines at a Glance.
Even though a December interest rate cut is likely, long-term U.S. Treasury yields are rising again.
The dot plot’s indication of a neutral rate in the 3% range and the limited rate cut make the downward pressure on the exchange rate weak.
Inflation stubbornly remains in the 2.7–3.0% range, supporting a strong dollar regime.
Korea-specific factors (corporate dollar reserves overseas, capital outflow expectations, changes in remittance regulations, and energy import costs) prevent the weakening of the exchange rate.
An interest rate cut could actually boost AI, biotech, and data center investment enthusiasm, encouraging capital to move to U.S. stocks.
If the 10-year yield rises to 4.25% or above, there is a possibility that USD/KRW could touch the 1,500 level.
A point other media miss: The absence of a “domestic dollar supply signal” is simultaneously stimulating both speculative demand and actual demand.
Global Macro: The Dynamics of Interest Rates, U.S. Treasuries, and Inflation.
The probability of a December rate cut by the Fed is high, but the market is looking toward next year.
The dot plot showing a neutral rate around 3% signals that “a steep cut is difficult.”
The yield on the 10-year U.S. Treasury briefly fell below 4% before rebounding close to 4.2%.
Generally, with rate cut expectations, long-term yields should also fall, but “uncertainty over next year’s economy and inflation” supports long-term yields.
The inflation rate remains sticky in the 2.7–3.0% range.
Within the Fed, divisions among hawks, neutrals, and doves have lowered the forward guidance credibility.
In conclusion, while an interest rate cut itself is a weak dollar variable, stubborn inflation and the rebound in long-term yields maintain the strong dollar variable.
Why the Exchange Rate Does Not Fall: Korea’s Unique Dollar Supply and Demand Factors.
Expansion of corporate dollar reserves.
Korean conglomerates have increasingly stockpiled dollars in their overseas subsidiaries.
Since these dollars need to be used again for investments in the U.S. (semiconductors, batteries, data centers, joint ventures, etc.), there is little incentive to bring them back to Korea, convert them to won, and then remit them.
This scale of reserved dollars directly affects the liquidity in the foreign exchange market.
Capital outflow pressure and overseas remittance investors.
If the rate cut is interpreted not as “defensive for the economy” but as “risk-on,” capital may flow more heavily into U.S. growth and AI-related stocks.
Domestic investors may tend to accumulate more dollars to diversify overseas.
Impact of changes in remittance regulations.
There are expectations of streamlining and strengthening the annual non-documentary limit system of USD 100,000, such as integrating small overseas remittance routes, which the market interprets as a signal that the government intends to control the speed of dollar outflows.
As regulations tighten, demand that preemptively factors in the “dollar scarcity premium” may emerge.
Structural burdens from energy and raw material imports.
As the exchange rate rises, costs related to oil, gas, and electricity are passed on.
A 100-won increase in the exchange rate is a tangible indicator that could raise market anxiety, as exemplified by an approximately 2 trillion won foreign exchange loss for Korea Electric Power Corporation.
Korea’s heavy reliance on imported intermediate goods and energy means that when the exchange rate rises to a certain point, the improvement in export profitability is offset or reversed.
Interest Rate–Exchange Rate Decoupling: Abnormal Signals in Recent Months.
In the past, a drop in U.S. interest rates was often accompanied by a stronger won.
Recently, an unusual pattern has emerged where the won remains weak regardless of changes in U.S. interest rates.
This suggests that “Korea’s unique imbalance in dollar supply and demand” is dominating the pricing.
Exchange Rate Bands by Scenario (for review, recommended quarterly updates).
Base Scenario.
U.S. 10-year yields: 4.0–4.4%, inflation steady at 2.7–3.0%, and 2–3 limited rate cuts.
USD/KRW in the box of 1,420–1,500.
Risk-On – Weak Dollar Scenario.
If the Fed turns more dovish than expected, with inflation dropping to around 2.5% and mild growth slowdown.
USD/KRW between 1,370 and 1,430.
Risk-Off – Strong Dollar Scenario.
If the 10-year yield rises to 4.5% or above, with sticky inflation and fiscal uncertainty coupled with geopolitical events.
USD/KRW could temporarily break through the 1,500–1,580 range.
Interest Rate Cuts and the Stock Market: The AI Trend Changes the Variable.
In the past, interest rate cuts were sometimes accompanied by a decline in stocks due to fears of recession.
This cycle coincides with a large-scale physical investment cycle in AI, data centers, and power infrastructure restructuring.
An interest rate cut could leverage AI investment demand and reignite the strength of U.S. growth stocks.
Beneficiary Sectors: Semiconductors (especially HBM and HBM packaging), semiconductor equipment, power infrastructure (transmission and distribution, transformers, cables), cooling (liquid cooling), data center REITs, cloud, and biotech.
This trend increases dollar demand and encourages capital movement from Korea to the U.S., reinforcing the pressure on a weak won.
Limitations of the “Weak Won Is Good for Exports” Formula: There Is an Appropriate Exchange Rate.
Korea’s structure of processing imported raw materials and parts for export means that if the exchange rate exceeds a certain level, the total costs increase significantly.
According to industry surveys, the appropriate exchange rate range has been stated to be roughly 1,300–1,375 won.
The current level (around 1,470 won) is already over 100 won above the average appropriate range, which could reduce or reverse the net positive effect on exports.
The consensus that next year’s export growth rate could fall to 0% reflects the inclusion of higher tariff and exchange rate cost increases.
What Other Media Rarely Pinpoint: The Absence of a “Domestic Dollar Supply Signal.”
If the government only controls dollar outflows, the market may overestimate “scarcity,” leading to both speculative and actual demand.
The solution lies in concurrently presenting a visible roadmap for dollar supply.
- Proactive issuance of foreign currency bonds by public enterprises and policy banks, along with guidance on foreign exchange volumes.
- Incentivizing corporates to onshore their dollar reserves through swap and currency hedging incentives.
- Mitigating short-term spot demand by releasing long-term hedging guidelines for energy public enterprises.
- Pre-transparently stating the market stabilization measures for specific levels (e.g., above 1,520 won).
With such “supply signals,” speculative demand would thin out, actual demand would diversify, and exchange rate volatility would decline rapidly.
Key Checkpoints on Korean Investor Capital Flows and Regulatory Changes.
The trend of simplifying and integrating limits and procedures for overseas remittances aims to channel dollar flows into the formal system.
In the short term, “tightening regulations = dollar scarcity” could stimulate market sentiment.
If overseas remittance investors continue to favor U.S. growth stocks, the structural trend may lead to an increased proportion of dollar cash and dollar-denominated assets.
Investment Strategy: Manage Risks from the Exchange Rate While Seizing Opportunities in the AI Value Chain.
For Individual Investors.
- Maintain a base currency proportion of around 60–70 for won, and 30–40 for dollars, adjusted according to the cycle.
- Operate within bands, such as selling dollars or increasing stock positions when the exchange rate nears 1,500 won, and buying dollars or strengthening hedges when it is around 1,420 won.
- For U.S. stocks, consider a basket approach with allocations such as 1 for AI core (semiconductors and cloud), 1 for power infrastructure, and 0.5 for biotech.
Domestic Stock Ideas.
- Select companies with low sensitivity to import costs and high proportions of dollar-denominated sales.
- Consider sectors benefiting from power, data center infrastructure, power equipment, industrial cables and transformers, and cooling solutions.
- In finance, look at securities and banks with strong dollar lending and global investment banking collaboration capabilities.
Hedge Tools.
- Use a combination of dollar deposits and exchange rate ETPs in a staggered manner.
- Employ short-term U.S. Treasury ETFs for a dual defense against interest rate and exchange rate risks.
- Export-import companies can manage average prices by staggered forward contracts for 3, 6, and 12 months.
Triggers and Boundary Lines: 7 Macro Data Points.
- U.S. 10-year yield: Accelerated won depreciation if maintained at or above 4.25%.
- DXY Dollar Index: A rebound above 107 signals the resumption of a strong dollar.
- U.S. 5y5y Inflation Expectations: An increase above 2.5% suggests a reduction in the Fed’s dovish bias.
- USD/KRW: A deviation of over 3% from the 200-day moving average is a short-term overheating warning.
- Korea’s Trade Balance and Energy Import Prices: Re-emergence of deficits could re-trigger risks.
- Foreign Currency Swap Basis (3M): An expanding negative basis signals tightening dollar funding conditions.
- Relative Strength of KOSPI/Nasdaq: A directional indicator for capital flows.
Conclusion: The “Interest Rate Cut = Exchange Rate Decline” Formula Does Not Work in This Range.
In this cycle, sticky inflation, the rebound in long-term U.S. Treasury yields, Korea’s unique distortion in dollar supply and demand, and the AI investment super-cycle are operating simultaneously.
In this combination, even with a December rate cut, the resilience of the exchange rate decline is weak.
Policy should focus on “supply signals” rather than merely controlling outflows to reduce volatility.
The investment answer lies in managing exchange rate bands and targeting the AI value chain basket.
< Summary >
- Despite a December interest rate cut, persistent inflation and the rebound in U.S. Treasuries support a strong dollar.
- In Korea, corporate dollar reserves, capital outflow expectations, changes in remittance regulations, and energy import costs combine to dampen the fall of the exchange rate.
- If the 10-year yield is maintained at or above 4.25%, there is a possibility of USD/KRW touching the upper limit of 1,500.
- Interest rate cuts could ignite AI, biotech, and power infrastructure investments, reinforcing the preference for U.S. stocks.
- The key policy is not to control dollar outflows but to transparently present a “domestic dollar supply roadmap.”
- The strategy involves operating within exchange rate bands, targeting the AI value chain basket, and using staggered hedge tools.
[Related Articles…]
- The Impact of BOJ Normalization on Asian Exchange Rates and the Sensitivity of the Won
- Mapping U.S. Data Center Investments and Beneficiary Companies in the Power Infrastructure Sector
*Source: [ Jun’s economy lab ]
– 12월 금리인하에도 환율이 안 떨어질 것 같은 이유