● Trump Mega-Buys Rare Earths, Commodity Supercycle Reloaded
Signal From the Trump Administration’s “Record-Scale Rare Earth Purchase”: Is the Commodities Supercycle Returning After 20 Years?
This report consolidates six items:1) Why the Trump administration acquired a “record-scale” stake in a rare earth company and the market implications
2) Why this is not a short-term theme but an operational shift toward supply-chain independence
3) Why a weak-dollar regime can lift both commodity prices and commodity-linked emerging markets (Brazil/Latin America/Australia)
4) The 2026 investment tracks most likely to matter: nuclear power, uranium, and copper
5) How Big Tech earnings season could redirect market flows
6) Key points often omitted in mainstream coverage
1) News Brief: Trump Administration to Purchase 10% Stake in USAR (USD 1.6 Billion)
Key facts
- The Trump administration announced the purchase of a 10% stake in the U.S.-listed rare earth company USA Rare Earths (ticker: USAR).
- Transaction size is approximately USD 1.6 billion, described as the largest purchase in prior rare earth/strategic minerals transactions.
Why this is larger: private capital mobilization
- The transaction is positioned not only as a government purchase but as a catalyst to attract private capital.
- The targeted capital raise reportedly increased from USD 0.5 billion to USD 1.0 billion due to strong demand, with indications of near-full subscription.
Market reaction: price action preceded the announcement
- The announcement was released over the weekend; the stock had already risen sharply during the prior week (e.g., ~47%).
- The focus is therefore on understanding the policy/flow dynamics rather than momentum-based chase entries.
2) Review of the Strategic Asset Acquisition Sequence: Rare Earths, Lithium, Alaska Minerals
Chronology referenced in the text:
- July 2025: Acquisition of a 15% stake in MP Materials (approx. USD 0.4 billion referenced).
- September 2025: 5% investment-related news involving Lithium Americas.
- October 2025: Executive-action momentum to restart Alaska mining activity, alongside investment-related news involving Trilogy Metals (TMQ) and mine stakes.
- January 2026 (current): Confirmed purchase of 10% of USAR plus facilitation of private capital raising.
Overall, the pattern suggests policy execution supported by capital formation, consistent with supply-chain restructuring rather than a one-off thematic trade.
3) Investor Implication: Rare Earth Supply-Chain Independence Has Moved From Declaration to Execution
Why it matters
- Rare earths are critical inputs for EVs, defense systems, semiconductors, robotics, and the energy transition.
- Reducing dependence on China is framed as a national strategic priority.
Two macro linkages
- Supply-chain restructuring can raise costs and contribute to inflationary pressure.
- Resource “bloc” formation can heighten geopolitical risk and redirect capital toward defense and commodities.
This combination typically supports longer-duration thematic persistence, independent of short-term volatility.
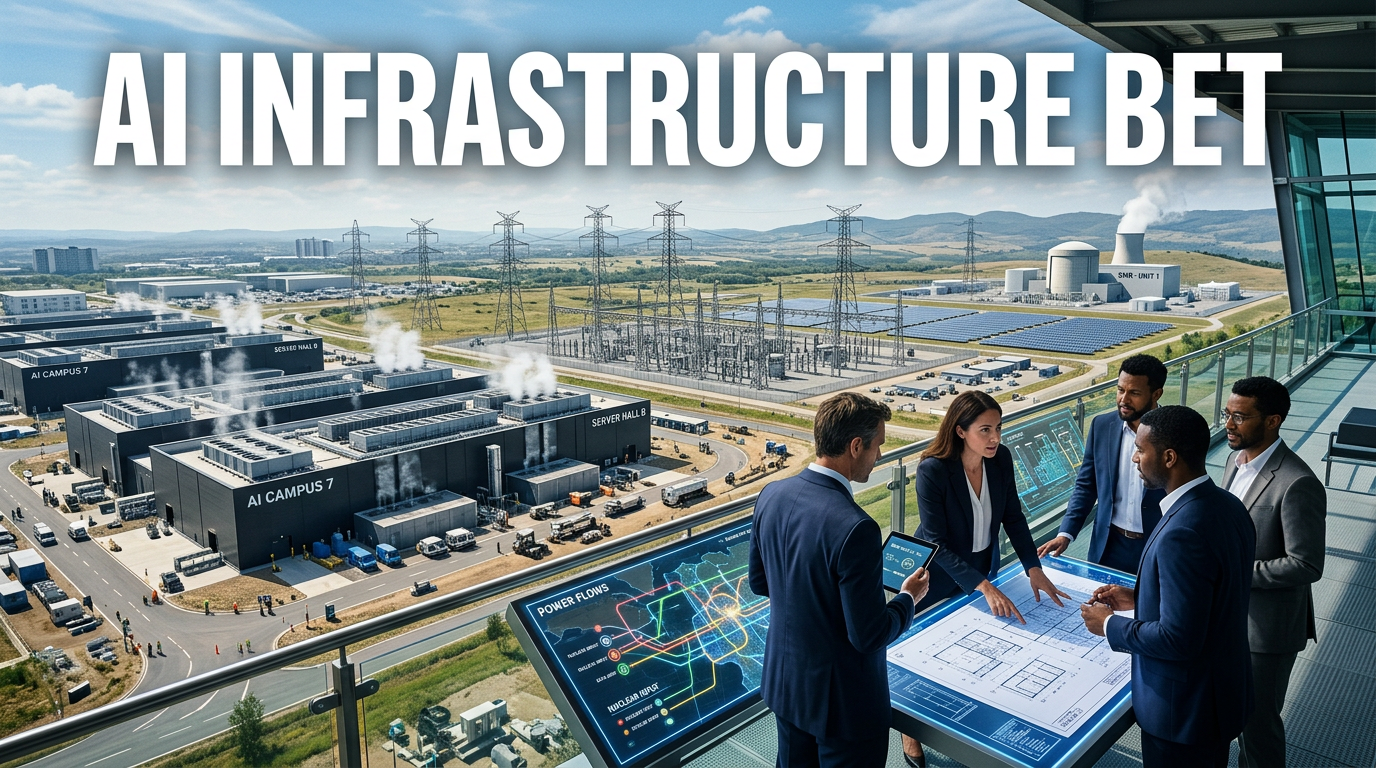
4) Drivers of Commodity Strength: Weak Dollar + Geopolitics + AI Infrastructure Demand
Core premise
- The analysis assumes a weaker U.S. dollar index trajectory since the Trump inauguration.
- Historically, a weaker dollar is supportive of commodity prices.
Additional catalysts
- Geopolitical risk and potential supply disruptions.
- Physical demand tied to AI data-center expansion (power generation, copper, silver, and related inputs).
When these factors overlap, price momentum can become self-reinforcing. Given elevated levels in several markets, broad exposure via ETFs is presented as the more practical approach.
5) ETF Lens: A Linked Chain From Commodities to Nuclear to Defense and Semiconductors
The underlying framing:
- The U.S. is developing strategic industries as integrated, supply-chain-based ecosystems.
ETF tracks referenced
- Rare earths: RMX
- Lithium: RIT
- Commodities (miners/metals): XME
- Nuclear/uranium: URA, URNM
- Defense: ITA
The emphasis is less on selecting a single instrument and more on identifying how policy direction channels capital, interacting with rate-cut expectations, inflation, and the U.S. dollar.
6) 2026 Focus: “Robotics” and “Nuclear” Highlighted at Davos
Two investment-relevant keywords emphasized:
- Robotics: automation demand across manufacturing, logistics, and defense.
- Nuclear power: supported by AI-driven electricity demand and renewed interest in nuclear build-out.
Nuclear is positioned as a multi-stage value chain (uranium, fuel, components, construction, regulation), which can extend thematic duration.
7) Why the “20-Year Reawakening” Matters: Commodity Countries Begin to Move (Brazil/Latin America/Australia)
A notable observation:
- Brazil/Latin American equities, described as structurally weak since 2008, have shown renewed momentum alongside commodity strength.
Implication
- Commodity upcycles may extend beyond individual metals (gold/silver/copper) into country-level capital flows and emerging market relative performance.
Why it is being revisited now
- If dollar weakness persists, historical patterns suggest U.S. asset dominance can soften and capital can rotate toward non-U.S. assets, including emerging markets.
- The text references a potential relative-strength shift versus the U.S.
8) Risk Check: Commodity Strength Can Reignite Inflation
Broad-based rises in commodities, energy, and metals can transmit into inflation with a lag.
- The analysis references a potential re-emergence of inflation concerns in 2H 2026.
This risk matters because renewed inflation can undermine rate-cut expectations and pressure equity valuations.
9) Next-Quarter Variable: Big Tech Earnings and the Direction of Capital Rotation
Scenario A: Strong Big Tech earnings
- Capital rotation back toward Nasdaq/mega-cap technology.
- Commodities may consolidate after overheating.
Scenario B: Mixed results (margin pressure, AI capex burden highlighted)
- Continued acceleration toward commodities/defense/non-U.S. exposures.
Positioning is framed as contingent on earnings outcomes and the U.S. dollar trend rather than a single-direction commodity bet.
10) Key Points Often Missed in Other Coverage
Point 1) The strongest signal is not the government purchase, but the creation of a private-capital pathway
- Direct government buying can be episodic.
- Establishing financing “rails” can sustain market-driven inflows over time.
Point 2) Rare earths have been elevated from a theme to a national-operational risk category (security/industry)
- Price action may be driven by policy, regulation, subsidies, and procurement contracts rather than valuation alone.
Point 3) Under prolonged weak dollar and commodity strength, relative winners may be assets outside the dollar-centric system
- This is framed as a relative-performance shift rather than a systemic failure narrative.
- It increases the potential value of global diversification and asset allocation.
Point 4) Supply-chain restructuring links rare earths, nuclear, defense, and robotics into a single strategic map
- Viewing these sectors together can reduce sensitivity to short-term price swings.
11) Keywords to Track
This development is expected to be interpreted through five recurring lenses:
- U.S. equities
- Inflation
- Rate cuts
- U.S. dollar weakness
- Supply-chain restructuring
When these variables move in the same direction, commodities and strategic-industry exposures tend to overheat; reversals can also be rapid.
< Summary >
- The Trump administration’s USD 1.6 billion purchase of a 10% stake in USAR indicates rare earth supply-chain independence is moving from signaling to execution.
- The impact is amplified by the facilitation of private capital raising alongside the government purchase.
- A weaker dollar, geopolitical risk, and AI infrastructure demand are supportive of commodities, with early signs of strength in commodity-linked markets such as Brazil/Latin America/Australia.
- Robotics and nuclear power are positioned as core 2026 tracks, while the inflation reacceleration risk from commodity strength warrants monitoring.
[Related Articles…]
- Rare earth supply-chain restructuring and investment checkpoints: https://NextGenInsight.net?s=rare%20earths
- Nuclear renaissance: uranium and power infrastructure investment trends: https://NextGenInsight.net?s=nuclear
*Source: [ 소수몽키 ]
– 트럼프 행정부의 역대급 매수, 20년만의 슈퍼사이클 신호일까
● April Fed Pivot Shock, Tariffs Turn Deflation, Jobless AI Boom
2026 Economic Outlook: An Authentic Inflection Point—April Fed Pivot, Tariffs as Deflationary Pressure, and the Practical Scenario of “Jobless Growth”
This report consolidates three core themes.
1) Structural reasons the Federal Reserve may be forced into a dovish pivot around April
2) The mechanism by which tariff escalation becomes deflationary pressure rather than inflation (a 2018–2019 replay)
3) The transition to “jobless growth” driven by AI and robotics, and the shift in consumption momentum from labor income to capital income
Additionally, it highlights a key under-discussed risk: data distortion that makes indicators appear stronger than underlying conditions (declining statistical reliability).
1) Key Briefing: April, the Fed, and fragmentation define the 2026 narrative
Keyword 1: April (inflection point)
Tariff shocks typically transmit to the real economy with an approximate one-year lag, rather than immediately.
During the 2018 tariff conflict, claims of “tariff immunity” surfaced later in the year; however, the growth slowdown became evident in 2019, cited here as precedent.
Keyword 2: The Federal Reserve (Fed pivot risk)
A pivot toward easing is often associated with weaker-than-expected growth.
Accordingly, an April shift may reflect policy easing following adverse developments, rather than a purely positive catalyst.
Keyword 3: Fragmentation (geoeconomics and trade bloc formation)
While trade fragmentation is commonly assumed to raise costs and inflation, the framework here emphasizes that the opposing forces may dominate in practice.
If trade volumes slow, growth, investment, and oil prices may soften concurrently, weakening aggregate demand and lowering the inflation equilibrium.
2) Why April? The one-year lag from tariffs plus indicator-distortion risk
(1) Tariff shocks reach the real economy with a lag, not instantly
When tariffs are imposed, firms often avoid immediate price pass-through and instead adjust:
inventories, ordering, investment, and hiring plans.
As these adjustments cascade through supply chains, demand slows, with effects often becoming visible roughly a year later.
(2) “Strong data, weak sentiment” may intensify
A central concern is that the reliability of some US indicators may deteriorate.
If survey response rates decline due to heightened uncertainty around residency or immigration, job losses may be less visible in official figures.
For example, reduced filing for unemployment benefits could result in under-counting rather than genuine labor-market improvement.
(3) Prioritize passively collected indicators over survey-based metrics
Data streams collected automatically (e.g., ADP-style payroll processing data) may be less prone to non-response distortion. Signals may emerge there earlier around April.
3) Why tariffs can be deflationary pressure rather than inflation
The central conclusion is:
“Tariffs may be inflationary for specific US categories, but globally the net effect can skew deflationary.”
(1) The US is ~26% of global GDP; the remaining ~74% can face stronger downside pressure
When access to the US market is constrained, other economies can see weaker demand, delayed corporate investment, and reduced growth expectations.
This can weaken global aggregate demand and propagate disinflationary/deflationary pressure.
(2) Diversion and discounting: goods blocked from the US may be sold cheaper elsewhere
If products such as steel and aluminum cannot be sold into the US, supply may be diverted to Europe and third markets at lower prices, suppressing inflation outside the US.
(3) Policy uncertainty suppresses investment, amplifying downside growth risks
The more material channel may be policy uncertainty, which tends to delay capex and hiring, weakening demand and price pressures.
(4) 2018–2019 precedent: inflation pressures eased
The period is cited as empirical precedent, with inflation pressure moderating across the US, China, and Korea and renewed discussion of deflation risk.
4) Oil and inflation: scenario-based interpretation of why CPI looked inconsistent
(1) View that inflation could have printed lower
Despite a lower-than-expected core CPI reading, the claim is that it may have been lower under typical relationships.
(2) Credibility check: divergence between gasoline/oil dynamics and CPI component behavior
At points in December, observed oil trends appeared inconsistent with select CPI/PPI subcomponents, while category-specific increases (e.g., recreation services) may have offset broader disinflation forces.
(3) Implication: inflation stability in 1H 2025 may strengthen the case for Fed easing
If this framework holds, inflation may remain stable in the first half of 2025, increasing the probability of a more accommodative Fed stance and linking to an April policy shift.
5) Counterpoint to “fragmentation equals structurally higher inflation”
The common view is that reshoring and friend-shoring raise costs and embed higher inflation.
This report conditions that view on one assumption:
“The argument holds if trade volumes are maintained.”
If instead:
(1) Intra-bloc trade slows
(2) Inter-bloc trade slows more sharply
(3) Trade intensity (trade-to-GDP) weakens globally
Then demand and growth effects can dominate cost pressures, lowering the inflation equilibrium.
6) The larger 2026 theme: “jobless growth” and the replacement of the consumption engine
(1) Productivity gains may not translate into employment growth
In this cycle, productivity gains may come less from scaling labor and more from substitution via:
AI, automation, and humanoid robotics, enabling growth with reduced labor input.
(2) Labor income to capital income as the driver of consumption
If employment growth weakens, wage-driven consumption can decelerate, with investment/capital income increasingly filling the gap.
(3) Policy focus: robot taxes, redistribution, and soft-landing design
Debates such as “robot taxes” are framed as part of broader policy design to stabilize consumption during the AI transition.
7) High-importance points less emphasized in mainstream coverage
Key Point 1) Treat a Fed pivot as a potential warning signal, not purely a risk-on catalyst
Easing often responds to deteriorating conditions; liquidity effects may lead markets, while real-economy stress can follow.
Key Point 2) The combination of tariff lag and declining data reliability increases timing risk
If real activity weakens while official statistics appear resilient, both policymakers and markets face higher risk of mis-timing.
Key Point 3) “Fragmentation is inflationary” is incomplete; if trade volumes fall, disinflation can dominate
Beyond cost pressures, concurrent declines in investment, trade, oil, and growth can pull the inflation equilibrium lower.
Key Point 4) AI is not only a technology theme; it extends to consumption, employment, and taxation
Automation and humanoid robotics translate into a macro question: who sustains consumption demand.
8) Investor and workforce monitoring framework (practical)
(1) Indicators to watch around April
ADP-style employment data, real-economy consumption metrics, and shifts in corporate capex guidance
(2) Inflation monitoring
Focus on component-level trends after removing distortions, not only headline prints
Track divergences between energy and services inflation
(3) Tariff and trade-war signals
Prioritize order volumes, inventory adjustment, and deferred investment over headline “price increase” narratives.
(4) AI diffusion signals
Monitor wage growth deceleration versus expansion of consumption supported by capital income
Track whether robot taxes and redistribution rise into actionable political agendas
< Summary >
In 2026, the transmission of tariff shocks with an approximate one-year lag may become visible around April; if disinflation persists, the probability of a shift toward Fed easing increases.
Tariffs can be net deflationary globally via weaker investment, reduced trade volumes, and lower oil prices, potentially outweighing category-specific US cost-push effects.
AI and robotics can enable jobless growth, accelerating a structural shift in consumption support from labor income toward capital income.
[Related Articles…]
- Fed Pivot Signal Checklist: Identifying the Moment the Rates-and-Liquidity Cycle Turns
- Post-Tariff Supply Chain Realignment: Five Scenarios for Korean Corporates
*Source: [ 경제 읽어주는 남자(김광석TV) ]
– 분기점이 온다. 연준이 완화적으로 돌아설 수밖에 없는 이유, 관세·유가·물가의 계산된 시나리오 | 3인토론 – 문홍철x성상현×김광석 4편
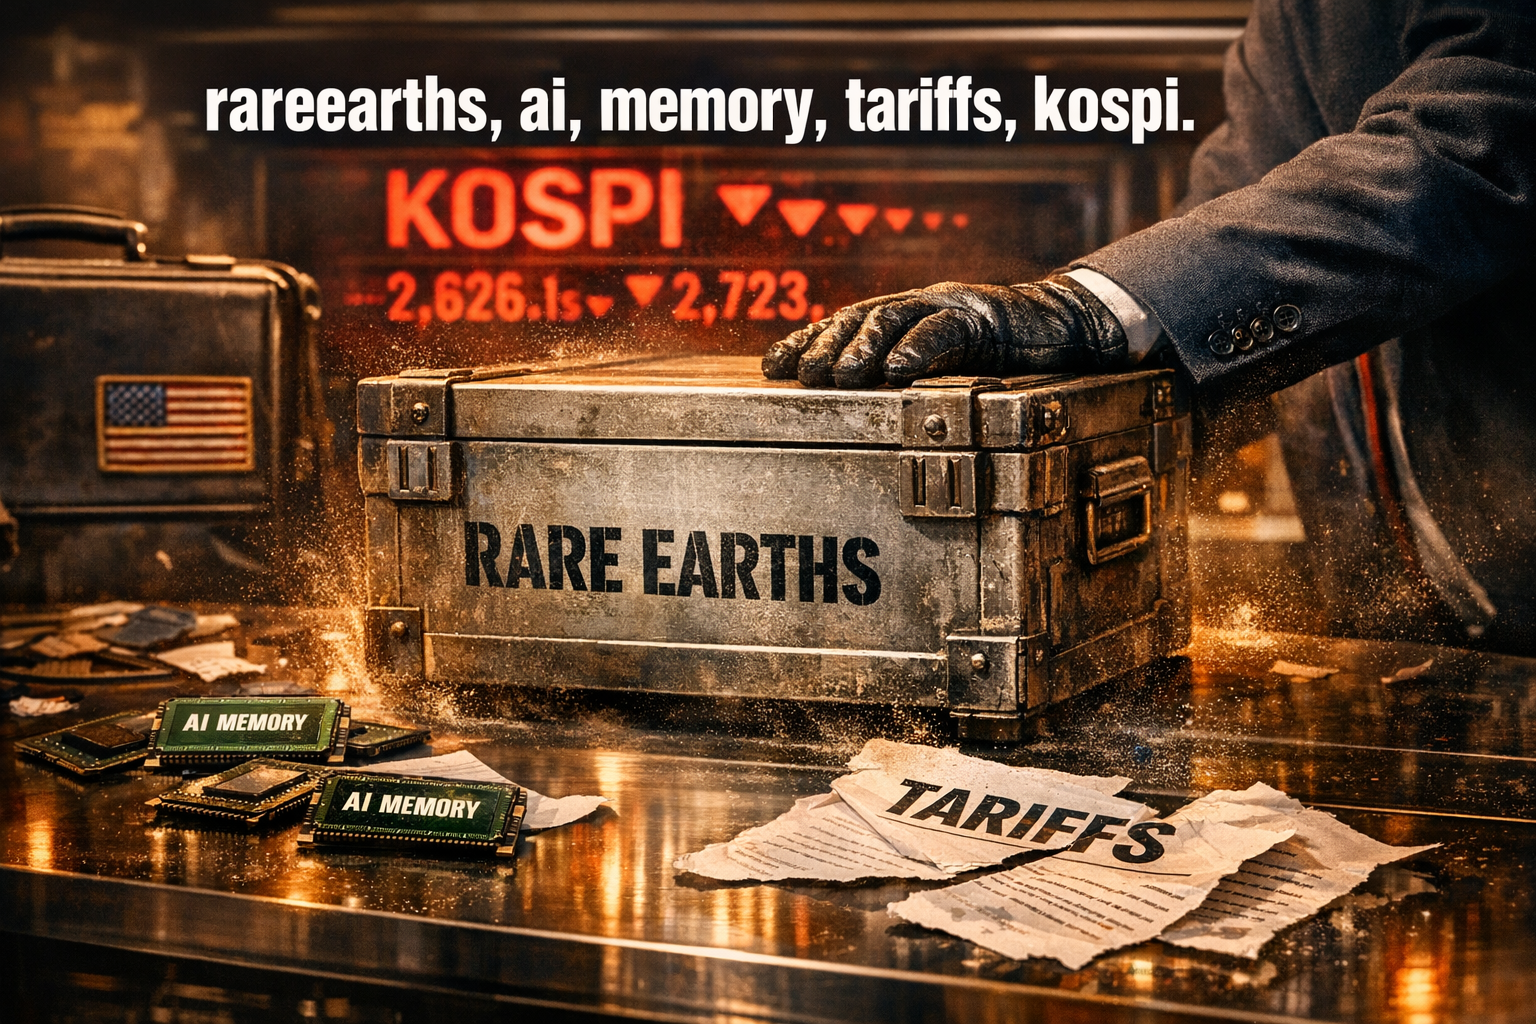
● KOSPI 5000 Surge, Samsung and SK Hynix Rocket, AI Memory Shockwave, Power and Copper Crunch, Tariff Threat Shrugs Off
Samsung Electronics and SK Hynix Surge: The Key Watchpoints After “KOSPI 5000” (AI, Commodities, Tariffs, and Data Centers)
This report focuses on four points:
1) Why Korean equities are rising more strongly than U.S. equities (capital flows, valuation, AI diffusion)
2) The real drivers behind the surge in Samsung Electronics and SK Hynix: structural upside extending beyond HBM to LPDDR and NAND
3) Why markets are relatively indifferent to tariff headlines (Trump-related risk interpreted as a negotiation lever)
4) The under-discussed core: AI investment ultimately converges on power, water, and commodities (silver/copper), shaping the next cycle
1) Market Snapshot: KOSPI 5000 Is a Signal, Not a Celebration
Key news flow
- Samsung Electronics and SK Hynix advanced sharply, pushing the KOSPI through 5000 and attempting to consolidate above it.
- Multiple global investment banks issued upward revisions to SK Hynix target prices.
- U.S. indices have not declined materially; Korea appears stronger due to relative outperformance.
Market interpretation
- The 2025–2026 period resembles a typical long-cycle transition from U.S.-led performance to non-U.S. outperformance.
- The AI theme is broadening from GPUs (U.S.) to memory and semiconductor equipment/materials (Korea), and further into global commodities.
- Even with a rapid index move, valuation pressure may be limited if EPS expectations rise concurrently.
Macro/positioning context
- Markets are simultaneously pricing in rate-cut expectations, potential inflation re-acceleration, FX volatility, supply-chain reconfiguration, and a semiconductor upcycle.
2) Why Korea Is Moving “More Strongly”: AI Diffusion + Valuation + Capital Rotation
1) AI is a diffusion theme, not a single trade
- The initial phase centered on LLMs/cloud/GPU; investment is now spreading to inputs required to run AI.
- GPUs → HBM (high-bandwidth memory) → broader memory → substrates/cleaning/materials → data-center power/cooling → commodities (silver, copper).
2) Korea is positioned in high-value segments of the AI supply chain
- HBM is shifting toward customer-specific characteristics, changing contracting structures.
- This transition may influence how the market values memory businesses (beyond traditional PBR-centric frameworks).
3) “Bubble” assessment remains inconclusive
- If earnings revisions rise alongside prices, forward valuation multiples may not expand excessively.
- The move appears increasingly tied to improving earnings visibility rather than price momentum alone.
3) The True Catalyst for Samsung Electronics and SK Hynix: LPDDR and NAND Are Also Turning
[Item 1] Apple accepted sharp LPDDR (mobile DRAM) price increases
- Apple typically compresses pricing via long-term agreements; acceptance implies reduced negotiating leverage amid tight supply.
- A key driver is industry capacity reallocation toward HBM, pushing mobile DRAM down the production priority list.
iPhone 18 variable (on-device AI)
- If AI features raise RAM content from 8GB to 12GB, suppliers may benefit from both higher ASPs and higher content per device.
- This supports near-term earnings momentum for suppliers while increasing Apple’s cost pressure.
[Item 2] Citi thesis: memory shifting from “commodity” to “customized industry”
- HBM increasingly requires customer-specific design, delivery schedules, and volume commitments.
- If customers must lock contracts ~1 year in advance, cyclicality may moderate and earnings visibility may improve.
[Item 3] Micron’s USD 24bn investment in Singapore: NAND re-emerging
- AI performance is constrained not only by compute but also by storage and data retrieval throughput.
- This supports renewed investment in NAND and storage infrastructure.
- Implication: the cycle may broaden from HBM-led strength to a wider memory upturn.
4) Microsoft Adds 15 Data Centers (~KRW 1.8tn): AI Bottlenecks Are Power, Water, and Land
News summary
- Microsoft is expanding data-center capacity in Wisconsin at large scale, including a regional economic revitalization narrative.
Investor-relevant takeaways
- Data-center economics and scalability are constrained by power supply, cooling water, and permitting.
- AI should be viewed increasingly as an infrastructure theme (electricity, cooling, grid), not only a software theme.
- This framework links to bullish demand narratives for silver and copper.
5) Why Tariff Headlines Are Not Being Priced as a Severe Shock
News summary
- Tariff references moved from 15% to 25%.
- While framed around procedural issues, market interpretation leans toward a negotiation tool to pressure investment commitments.
Why equities did not materially sell off
1) Markets have learned to interpret Trump-style statements as part of a bargaining process rather than final policy.
2) Expectations remain that incentives or legislation could reshape the outcome.
3) For semiconductors, AI demand and supply-structure change are currently larger drivers than tariff rhetoric.
6) Cycle Framework: “Mid-to-Late Expansion” Rather Than Peak Bubble
Cycle framing
- Non-U.S. outperformance versus the U.S. tends to occur in major transitions every 10–15 years.
- In prior episodes, sharp semiconductor price moves were followed by additional upside lasting 6–9 months (~40% probability), 10–15 months (~40%), or longer under AI-driven extensions (~20%), implying a probabilistic rather than deterministic path.
KOSPI upper-bound framework
- Conditions may remain constructive into the first half of next year, with uncertainty potentially rising in the second half.
7) Commodities (Silver, Copper, Gold, Platinum) and AI: Supply Constraints Drive the Thesis
Silver (Ag) demand drivers
- Silver’s high conductivity supports demand across semiconductors, data centers, and power infrastructure.
- Solar and EV electrification trends also contribute to demand growth.
- Supply expansion is slow due to long mine development timelines (often 10–15 years).
Investment risks
- Silver is highly volatile; sharp reversals can follow rapid advances, including leverage/margin rule changes.
- Separate long-term thesis from short-term entry timing.
Copper (Cu) follows similar logic
- Structural demand from grids, data centers, and EVs is rising while supply remains exposed to geopolitical and mining risks.
8) Crypto (Bitcoin): Near-Term Weakness; Long-Term Variable Is Quantum Computing
Key points
- Bitcoin continues to be interpreted through a four-year cycle framework, though current positioning and flows appear weaker versus other assets.
Primary long-term risk: quantum computing
- Quantum advances could eventually threaten existing cryptographic schemes.
- Dormant coins could be vulnerable targets.
- Protocol-level response may be slower for Bitcoin due to governance and consensus constraints relative to other networks.
9) The Most Important Under-Covered Points
Point A: KOSPI 5000 reflects shifting pricing power, not a headline milestone
- When a dominant buyer such as Apple accepts higher pricing, markets may read a transfer of pricing power to suppliers.
- This can drive not only earnings revisions but also structural re-rating of valuation levels.
Point B: The AI cycle is moving from compute to storage, power, and cooling
- HBM alone may appear narrow; broadening into NAND/storage and infrastructure materially changes the breadth and duration of the cycle.
- AI increasingly links to national infrastructure, power policy, and commodity availability.
Point C: Capital allocation and policy packages matter more than tariff soundbites
- Markets are prioritizing where CAPEX is deployed and where data centers are built.
- The focus is shifting from rhetoric to observable capital flows.
10) Investor Checklist
Semiconductors
- Whether HBM contracting (longer duration/customization) translates into materially higher earnings stability.
- Whether LPDDR and NAND pricing strength is one-off or structural.
Macro
- Foreign flow behavior during sharp FX moves (concentration in mega-caps vs broadening).
- Whether AI-related earnings resilience holds if rate-cut expectations fade.
AI infrastructure
- Whether power, water, and land constraints are alleviated via grid investment and permitting reforms.
Commodities
- Monitor volatility triggers such as leverage/margin requirement changes following sharp moves in silver/copper.
< Summary >
- KOSPI 5000 is better interpreted as a signal that AI diffusion is improving Korean semiconductor pricing power.
- The upcycle is expanding beyond HBM to LPDDR and NAND, strengthening expectations for a broader memory recovery.
- Microsoft’s data-center expansion reinforces that AI is entering an infrastructure phase centered on power, water, and commodities.
- Tariff headlines are treated as negotiation leverage; capital remains concentrated in the AI supply chain.
- The critical point is that AI extends beyond semiconductors into storage, power infrastructure, and commodity constraints, which can shape the next phase of the cycle.
[Related Links…]
- AI semiconductor cycle: where capital flows after HBM
https://NextGenInsight.net?s=semiconductors - Commodities supercycle: next variables for gold, silver, and copper
https://NextGenInsight.net?s=commodities
*Source: [ Jun’s economy lab ]
– 삼성전자 SK하이닉스 급등, 코스피 5000파티 더 갈까? 강환국 작가와 함께합니다