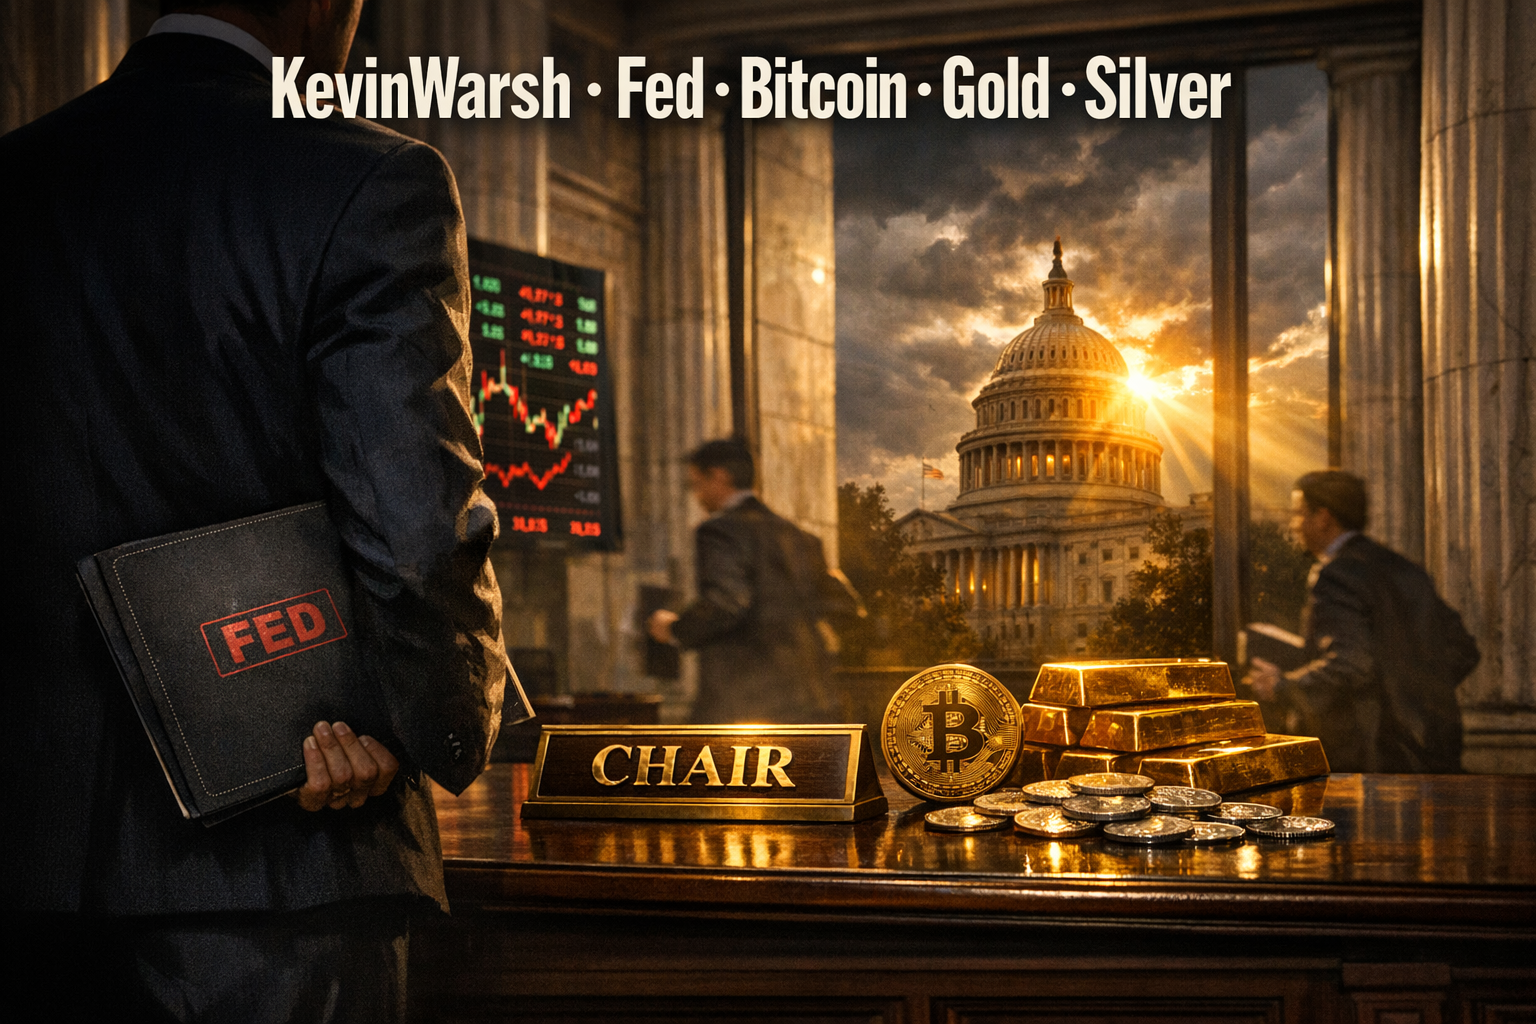
● Bitcoin-Gold-Silver Crash, Kevin Warsh Shock, 2026 Fed Regime Flip
Synchronized Sell-Off in Bitcoin, Gold, and Silver: The Key Signal Is Elsewhere — How a “Kevin Warsh (Fed Chair Nominee)” Narrative Could Reshape 2026 Markets
This report consolidates three core points:
1) Why the Bitcoin drawdown occurred concurrently (leveraged liquidations, thin weekend order books, geopolitical risk)
2) Why the gold and silver sell-off (margin increases, short-term overheating, USD strength) appeared as “real-asset capitulation”
3) The most material issue: the variable more destabilizing than whether Warsh is hawkish or dovish (including 2026 market scenarios)
1) Market Snapshot (Briefing Format)
[Headline]
Markets repriced immediately as Kevin Warsh emerged as a leading candidate for the next Federal Reserve Chair under Trump. Bitcoin, gold, and silver sold off together as the “USD strength + tightening risk” regime returned to the forefront.
[Market Reaction]
- Bitcoin: key levels broke following accelerated short-term weakness (loss of psychological support)
- Gold: volatility expanded to a one-day plunge magnitude
- Silver: significantly larger decline than gold (structurally higher volatility due to leverage and order-book dynamics)
- Tech/Nasdaq: typically the first to weaken as expectations for easing decline
[Core Interpretation]
The move resembled a “policy-risk repricing” more than a “recession scare”:
potential Fed leadership change → surge in monetary-policy uncertainty → leverage reduction and position unwinds.
This was less a signal of immediate economic deterioration and more a rapid increase in the “price of policy uncertainty.”
2) Bitcoin Sell-Off: Four Triggers
2-1. Trigger 1: “Hawkish Fed” repricing (USD strength)
If Warsh is perceived as hawkish, markets tend to reprice toward a higher terminal rate, delayed cuts, or faster liquidity withdrawal. USD appreciation typically pressures risk assets such as Bitcoin, especially when valuations are supported by liquidity premia.
2-2. Trigger 2: Leveraged long liquidation cascade
When leverage builds on “mean-reversion” expectations, a single surprise can trigger sequential liquidations. This pattern is often driven more by market microstructure and positioning than by fundamentals.
2-3. Trigger 3: Geopolitical risk (U.S.–Iran tensions) → risk-off
In the short run, Bitcoin frequently trades as a risk asset (often Nasdaq-like). Escalating geopolitical risk tends to increase demand for cash/USD, which is unfavorable for Bitcoin.
2-4. Trigger 4: Thin weekend order books (liquidity gap)
Weekend participation is lower and order books are thinner. Comparable selling pressure can produce larger, stepwise declines, amplifying moves on identical headlines.
Additional variable: U.S. budget process risk (shutdown/procedural uncertainty)
Even if transient, it can raise the “uncertainty premium.” Recent market conditions have shown muted response to positive news and heightened sensitivity to uncertainty.
3) Gold and Silver Sell-Off: Positioning and Margin Dynamics
3-1. USD strength + upward repricing of rate path (tightening risk)
Gold and silver are commonly viewed as inflation hedges, but short-term pricing is highly sensitive to real-rate expectations and the USD. A tightening narrative typically pressures the complex first.
3-2. Exchange margin hikes: the primary accelerant
Margin increases force leveraged participants to post additional collateral or reduce exposure. This can trigger selling independent of discretionary intent, creating a feedback loop: price decline → margin calls → further selling.
3-3. Mean reversion after short-term overheating (unwinding of recent gains)
Following rapid monthly gains, markets often use modest negative catalysts to justify larger profit-taking. Silver typically exhibits higher volatility than gold due to thinner liquidity, greater leverage intensity, and mixed industrial-demand sentiment.
4) Kevin Warsh: The Central Issue Is Not “Hawk vs. Dove,” but Fed Operating Regime
Key attributes frequently associated with Warsh:
- Experience across the White House, Wall Street (Morgan Stanley), and the Fed (youngest Governor)
- Skepticism toward QE-era policy; preference for restraint in balance-sheet expansion
- Criticism of excessive data dependence and forward guidance; inclination to alter the Fed’s communication framework
- Views on inflation that emphasize productivity and supply-side considerations rather than relying primarily on demand destruction via aggressive rate hikes
Market concern is not limited to a higher-rate bias, but rather the risk that the Fed’s communication rules (forward guidance) and policy framework could shift, reducing predictability. Markets often price assets based on predictability more than precision; lower predictability raises discount rates and compresses valuations across equities, crypto, and commodities.
5) 2026 Macro Lens: Why “Fed Chair Risk” Becomes a Larger Market Variable
5-1. Policy uncertainty tightens financial conditions
Before rate changes occur, uncertainty can tighten conditions via higher rate volatility, wider credit spreads, and USD strength, potentially weighing on investment and hiring.
5-2. Sensitivity is higher while inflation is not fully resolved
When inflation is clearly anchored, leadership changes tend to have limited impact. When the inflation path is ambiguous, a Chair transition can trigger immediate repricing of the expected rate path, destabilizing risk assets and commodities concurrently.
5-3. Potential conflict between fiscal/trade policy and the Fed
A market concern is the combination of fiscal expansion and stronger tariffs/industrial policy (inflationary impulse) alongside a Fed maintaining restrictive policy (inflation vigilance). This mix can reinforce USD strength and elevate volatility.
6) Underemphasized but Most Material Takeaways
Key 1: The synchronized sell-off was more about market structure than asset fundamentals
Bitcoin: liquidations from leverage.
Gold/silver: forced deleveraging driven by margin hikes and crowded positioning.
Weekend liquidity gaps can turn these into a chain reaction. This points to fragility in positioning rather than a direct deterioration in macro data.
Key 2: The larger Warsh risk is reduced Fed predictability, not simply “hawkishness”
De-emphasizing forward guidance and challenging prevailing policy signaling can reduce the market’s reliance on a “high-clarity central bank.” Lower clarity encourages markets to price worse-tail outcomes, elevating volatility.
Key 3: 2026 may be defined by a regime shift in policy operations rather than the level of rates
Beyond the number of cuts, longer-horizon asset pricing is materially affected by changes to the policy framework (guidance, balance-sheet strategy, inflation-target implementation). Warsh is perceived as a candidate capable of altering that regime.
7) Monitoring Checklist: Indicators That Clarify Direction
7-1. Tone and content of the first 1–2 FOMC meetings
- Emphasis on inflation-fighting vs. flexibility on easing
- Degree of openness to cuts
- Balance-sheet stance (pace of runoff vs. stabilization)
7-2. Co-movement of the USD index and real yields
When Bitcoin and gold decline together, the underlying driver is often the combination of USD strength and rising real yields.
7-3. Leverage and derivatives positioning metrics (funding rates, open interest, margin data)
Abrupt drawdowns are frequently triggered by crowded positioning and leverage before fundamentals dominate.
< Summary >
Bitcoin’s decline can be interpreted as the confluence of Warsh-driven tightening repricing, leveraged liquidation cascades, geopolitical risk, and weekend liquidity gaps.
Gold and silver declines were amplified not only by USD strength but also by exchange margin increases that forced deleveraging.
For 2026, the primary Warsh-related market risk is a potential shift in Fed operating and communication frameworks that reduces predictability, rather than a simple hawkish/dovish classification.
Key indicators: early FOMC messaging, USD/real-yield dynamics, and derivatives leverage metrics.
[Related Links…]
https://NextGenInsight.net?s=Bitcoin
https://NextGenInsight.net?s=Federal%20Reserve
*Source: [ 내일은 투자왕 – 김단테 ]
– 비트코인, 금 대폭락은 금융시장 대폭락의 전조인가? (ft. 케빈 워시)
● Wall Street Pivot, Slash US Stocks, New Fed Chair Shock, 2026 Winners and Losers
Wall Street’s Pivot Toward Reducing U.S. Equity Exposure: Incoming Fed Chair Risk + Key 2026 Opportunities and Risks
Wall Street’s growing consensus to reduce U.S. equity exposure reflects multiple concurrent drivers, not a single catalyst.
This report consolidates:
① The primary factors behind the synchronized shift toward “underweight U.S. equities”,
② Why the “new Fed chair effect” tends to recur (historical pattern + cycle-specific variables),
③ Where opportunities vs. risks are separating into year-end and early 2026 (sector/style/earnings quality),
④ The most critical checkpoints often underemphasized in mainstream coverage
1) [Market Update] Why Wall Street Is Turning Toward “Reduce U.S. Equities”
The core message is not that U.S. equities are structurally unattractive, but that
the conditions that supported U.S. outperformance are weakening simultaneously.
1-1. Valuation risk has become structurally elevated
In recent years, U.S. equities (especially large-cap growth) were supported by a combination of
earnings, liquidity, and expectation-driven repricing (notably AI).
The current concern is that even if earnings remain resilient,
upside from further multiple expansion is increasingly constrained.
The key macro variables are
interest rates and inflation.
A “higher for longer” rate environment (or a slower easing path)
tends to compress growth-equity multiples via a higher discount rate on future cash flows.
1-2. Narrative shift: “AI is positive, but not all AI equities are attractive”
AI remains a long-duration productivity theme; however, in public markets, “AI” labeling can accelerate expectation premia and create price-to-fundamentals gaps.
The underweight message is typically less about AI’s long-term relevance and more about
misalignment between valuation and earnings visibility.
1-3. Risk management: Concentrated “U.S.-only” positioning is becoming less efficient
A dominant message in global asset allocation is increased emphasis on
regional and currency diversification.
After an extended period of U.S. leadership, the risk of higher volatility has risen,
making volatility control more central than incremental return chasing.
2) The “New Fed Chair Effect”: Will It Repeat?
Markets frequently reprice when a new Fed chair takes office, driven by concerns that
policy communication uncertainty triggers rate-path reassessment and equity drawdowns.
2-1. Why markets destabilize under a new chair
The Fed chair materially shapes expectations for the policy rate path. Under a new regime, markets reassess:
- Policy priority: inflation control vs. growth support vs. financial stability
- Communication style: tighter expectation management vs. clearer forward guidance
- Event response function: preemptive easing vs. reactive tightening under stress signals
When uncertainty rises, equity valuation risk concentrates first in high-multiple growth segments.
2-2. The dominant variable this cycle: macro mix, not leadership change
Leadership transition is a catalyst, but the primary market driver is the macro regime that constrains policy.
Key combinations include:
- Slowing growth + persistent inflation: most restrictive for policy flexibility
- Slowing growth + declining inflation: increases probability of easier financial conditions
- Resilient growth + re-accelerating inflation: increases risk of upward rate repricing and multiple compression
Accordingly, “new chair risk” is secondary to
the data-dependent environment that dictates policy choices.
3) Opportunity vs. Risk Into Year-End and Early 2026: Differentiation Framework
In the current regime, thematic exposure is less decisive than earnings quality and durability.
3-1. Attributes likely to be rewarded
- Strong free cash flow: higher rates increase the premium on realized cash generation
- Pricing power: supports margin defense under residual inflation
- AI translating from cost to productivity: measurable margin or efficiency improvement
- Capex with demonstrable payback: investment that converts into revenue and cash returns
3-2. Common risk characteristics
- AI-labeled equities without revenue/margin follow-through
- High leverage and sensitivity to refinancing costs
- High earnings volatility versus consensus: asymmetric downside on small misses
- Elevated regulatory/policy risk: particularly data, platforms, and antitrust
3-3. Sector mapping approach: “AI infrastructure” vs. “AI applications”
If AI is a long-term growth vector, performance dispersion often depends on positioning within the cycle:
Infrastructure (chips/data centers/power/networking) vs.
Applications (software/automation/vertical AI).
Infrastructure can overheat quickly through capex cycles, while applications often monetize later but can create durable lock-in once value is proven.
Repositioning typically begins where infrastructure pricing implies peak-cycle assumptions.
4) Critical Points Often Underemphasized
4-1. “Reduce U.S. equities” typically means “reprice the U.S. premium,” not “exit the U.S.”
- The U.S. remains a primary center of innovation and capital markets
- When valuation runs ahead of fundamentals, expected forward returns compress
- As a result, institutions signal “rebalancing” rather than structural abandonment
4-2. The next differentiator: AI diffusion cost structure and monetization speed
- Trajectory of training and inference costs
- Resolution speed of power and data-center capacity constraints
- Evidence that AI adoption is reducing labor, time, and error costs at scale
The market sensitivity is less about AI capability and more about
the pace at which AI converts cost into profit.
4-3. Policy risk compresses into three recurring indicators
- Inflation trend direction
- Labor/consumption deceleration signals
- Rate-path repricing and term premium dynamics
Deviation in any single axis can accelerate institutional de-risking and reallocation.
5) Investor Checklist: Reducing Execution Risk
- When reducing U.S. equity exposure, prioritize trimming valuation risk rather than indiscriminately selling high-quality businesses
- During earnings, focus on margins and forward guidance over narrative
- Implement rebalancing in tranches rather than single-point timing
- Segment AI exposure across infrastructure, applications, power, and data pipelines
< Summary >
Wall Street’s call to reduce U.S. equity exposure primarily reflects valuation repricing risk, not a collapse thesis.
Incoming Fed chair risk is a catalyst; the main driver is the growth–inflation–rates configuration.
Potential beneficiaries are businesses with cash-flow strength, pricing power, and provable AI-driven productivity gains; higher-risk segments include expectation-heavy theme exposures and leverage-sensitive equities.
The market’s key inflection is not “AI growth” in isolation, but AI diffusion costs and monetization velocity.
[Related]
- U.S. Equity Rebalancing and 2026 Portfolio Strategy
- Key Checkpoints: How Fed Policy Shifts Transmit to Global Markets
*Source: [ 소수몽키 ]
– 미국주식 줄여라, 줄줄이 태세전환하는 월가 / 신임연준의장의 저주, 이번에도 반복될까 / 올해 주목할 주식, 조심할 주식 정해졌다 / 멤버십 전용 자료들(리포트/펠로시 매매 등)
● Fed Pivot Shock – Liquidity Whiplash – AI Boom – Jobless Growth – Won Held Hostage by King Dollar
April 2026: Why Markets React When the Fed Pivots (Liquidity, AI Productivity, Strong USD, and FX Structure)
This report consolidates four themes:1) Why April 2026 is cited as a potential inflection point in the liquidity cycle.
2) What it implies for investing that AI may resemble the early Internet era (1995–1997).
3) How “jobless growth” could reshape asset markets and policy.
4) The structural basis for the view that the KRW exchange rate is primarily driven by the United States.
A final section highlights key points often omitted in mainstream coverage.
1) Briefing: Key Takeaways (Consolidated)
1-1. [Fed/Liquidity] “Around April 2026, the Fed could pivot sharply dovish”
A shift toward easing can be interpreted as a signal of deteriorating conditions rather than an unambiguously positive catalyst. The downside trigger need not be a crisis; it may reflect accumulated pressures such as growth deceleration, labor-market weakening, and rising policy constraints.
A historical analogy is the 2018 tariff escalation: early narratives suggested the US economy could absorb tariffs, yet a difficult-to-attribute slowdown emerged in 2019 and was later framed as lagged tariff effects. The same lag framework motivates the focus on April 2026 as a potential policy inflection window.
1-2. [Inflation] “Tariffs are inflationary” vs. “Disinflation pressure may dominate”
Two competing mechanisms were emphasized:
- Baseline view: tariffs raise costs, supporting structurally higher inflation.
- Counterview: fragmentation and tariffs suppress global demand, reduce trade, and weaken investment; the resulting slowdown can pressure commodity prices (including oil) and broader inflation downward.
The framework distinguishes between the United States (approximately 26% of global GDP), where inflationary effects may be more visible, and the remaining 74%, where disinflationary pressure may be stronger. Global inflation could converge toward a new equilibrium rather than move unidirectionally.
1-3. [Data Reliability] “Economic indicators may overstate underlying strength”
Lower survey response rates can distort labor and income statistics, potentially making employment and household conditions appear stronger than reality. In such an environment, investors may place greater weight on indicators with lower survey dependence and more automated collection characteristics (e.g., ADP-style payroll measures).
1-4. [AI] “AI may resemble the early dot-com phase, not the pre-crash peak”
The view presented is that the market is in an “investment ramp” phase, with total factor productivity (TFP) beginning to emerge but not yet fully diffused. This aligns more closely with the 1995–1997 period than with late-stage exuberance.
A supporting comparison is capex intensity: during the dot-com era, S&P 500 IT firms reportedly spent roughly 7% of revenue on capex; current spending is described as similar in magnitude. The implication is that an infrastructure investment cycle may still have room to translate into a broader productivity cycle.
1-5. [Employment] “This productivity wave may not increase employment”
AI, automation, and humanoid robotics can raise output without proportionate job creation. If productivity gains do not translate into labor income growth, consumption may depend more on capital income (investment returns) or policy transfer mechanisms.
A potential regime-change signal is the emergence of “robot tax” or related policy debates: a shift from promotion to regulation/taxation could represent a meaningful long-term risk indicator.
1-6. [FX] “KRW may be increasingly driven by the US rather than domestic factors”
Two structural points were highlighted:
(1) KRW weakness can persist even when the dollar index is soft, implying drivers beyond domestic Korea-specific fundamentals. KRW can co-move with JPY and TWD due to regional policy choices and flows. The scenario suggested that these influences could moderate in 2026.
(2) At a broader level, the United States may prefer to avoid excessive weakness in partner currencies if it seeks to support domestic manufacturing competitiveness. Therefore, KRW dynamics may be more sensitive to US monetary policy, political events (e.g., midterm-election dynamics), and external economic strategy than to local variables alone.
2) Three Core Pillars for 2026: Liquidity, Productivity, FX
2-1. Liquidity Cycle: Why April 2026 is flagged as a policy-turn window
The core premise is that tariff and policy shocks often affect the real economy with an approximate one-year lag. Under this framework, a tariff or policy shock around early April 2025 would map to heightened sensitivity around April 2026.
A key risk factor is that the Fed may not pivot “preemptively”; instead, a change in tone can occur rapidly once data or financial conditions cross a threshold. Markets can interpret a sudden dovish pivot as confirmation that something has broken, amplifying volatility.
2-2. AI Productivity Cycle: Investment first, productivity later
Productivity is treated as a lagging outcome. When productivity prints appear strongest, the investment opportunity set may already be less favorable.
Under this framing, the current phase is characterized by heavy investment. A more material risk scenario is sustained investment without corresponding incremental innovation or efficiency gains. Monitoring should therefore extend beyond valuation to include:
- the pace of TFP diffusion, and
- changes in output per unit of AI-related investment.
2-3. FX Structure: Why a post-strong-USD regime may not resemble prior weak-USD cycles
A central question is whether rate cuts will mechanically produce dollar weakness and KRW strength as in prior cycles.
Dollar-linked stablecoins were cited as a potential structural variable: they may increase dollar demand via settlement and balance-holding needs, while also functioning like a liquidity conduit linked to short-dated US Treasury holdings, which could exert opposing effects. The practical conclusion is that even if the strong-dollar phase ends, a rapid reversion to prior KRW ranges (e.g., 1,200 or 1,100 per USD) may be less likely. FX should be evaluated as a function of evolving dollar-demand structure (digital-dollar/stablecoin dynamics) and US policy.
3) Investor Implementation: What to Monitor and What to Avoid
3-1. April 2026 as a rebalancing window rather than a panic trigger
The approach is to acknowledge a broader liquidity-supportive backdrop while treating any volatility or drawdown around April as an opportunity to assess portfolio resilience and rotate exposures.
Key monitoring variables include the US policy-rate path, evidence of inflation re-acceleration, and shifts in policy communication.
3-2. Leadership rotation: From AI infrastructure to AI-enabled applications
If 2025 leadership is driven by infrastructure (GPU, HBM, power-grid buildout), 2026 leadership may shift toward sectors that translate AI adoption into structurally higher revenue and margins.
This implies expanding focus from chip and hardware suppliers to industries where AI materially changes cost structure, productivity, and service quality (manufacturing, logistics, financials, healthcare, retail).
3-3. Risk management: Cash and Treasuries as functional hedges
In a high-rate environment, cash and government bonds can serve as volatility-management tools rather than inert allocations. Treating cash as structurally inferior may increase portfolio fragility during regime shifts.
4) Critical Points Often Overlooked
4-1. “Good-looking data” can increase inflection-point risk
Turning points can be most destabilizing when deterioration is occurring but not clearly visible. Lower survey response, large revisions, and GDP distortions concentrated in specific categories can delay recognition by both the Fed and investors, potentially compressing volatility into discrete windows such as April.
4-2. The primary AI bubble trigger may be policy posture, not valuation
A valuation-only explanation can miss timing. A sharper risk catalyst may be a shift in the rules of capital allocation: fiscal tightening, new taxes, or explicit AI/automation regulation (including robot-tax proposals). Political, fiscal, and regulatory shifts can reprice risk more abruptly than technical narratives.
4-3. FX should sometimes be analyzed as an Asia currency complex (JPY–TWD–KRW)
KRW-only analysis can be insufficient. When JPY and TWD move due to policy or flow dynamics, KRW can be mechanically pulled into the same regime. A 2026 framework may require monitoring the broader regional currency package rather than domestic Korea indicators alone.
< Summary >
April 2026 is cited as a potential liquidity inflection window due to lagged effects from tariff and policy shocks and the possibility of a rapid Fed pivot once thresholds are breached.
AI may be in an early-stage phase analogous to 1995–1997, where investment precedes broad productivity diffusion; a key risk is a policy shift from support to regulation/taxation rather than valuation alone.
If jobless growth becomes more prominent, the consumption base may shift from wage income toward capital income and policy transfers, with implications for market structure and policy response.
KRW dynamics may be increasingly influenced by US policy and a regional Asia currency complex (JPY, TWD, KRW); even if strong USD conditions ease, historical mean reversion in KRW may be less reliable due to structural changes in dollar demand and policy.
[Related Links…]
- https://NextGenInsight.net?s=Fed
- https://NextGenInsight.net?s=FX
*Source: [ 경제 읽어주는 남자(김광석TV) ]
– [풀버전-하편] 2026년 4월, 연준이 돌아서는 순간. 유동성 사이클의 진짜 변곡점. 강달러의 끝은 어디인가? | 3인토론 – 문홍철×성상현×김광석 (4, 5, 6편)