● Tesla Semi Shatters the Electric Truck Myth, Mega-Charging Slashes Costs, Musk Sparks a Power and Cooling War
Not “Bill Gates Was Wrong,” but the EV Heavy-Truck Economics Equation Has Changed: Three Tesla Semi Inflection Points (Weight, Charging, TCO) Plus the Broader “Power/Cooling/Infrastructure” Race Linking SpaceX, xAI, and Tesla
This report consolidates four core points:
1) Why the assumption “batteries are too heavy for electric heavy-duty trucks” is weakening (with figures).
2) How megawatt charging changes operating models, not merely charging speed.
3) Why total cost of ownership (TCO) declines materially based on PepsiCo real-world operating data.
4) The macro-level “power/cooling/infrastructure” constraint that connects SpaceX, xAI, and Tesla and is often missed in mainstream coverage.
1) Key Briefing: Tesla Is Challenging the “Electric Heavy Trucks Are Impractical” Thesis With Numbers
1-1. Bill Gates’ 2020 objection vs. Tesla Semi disclosed 2026 production specifications
The core objection was straightforward:
“Battery packs become too heavy, reducing payload capacity, making long-haul freight effectively impractical.”
As of 2026, the Tesla Semi’s disclosed production specifications imply not only an emissions narrative, but a potential change to the economic operating equation for freight operators.
1-2. Curb weight (revenue capacity) as a central variable
In freight, curb weight directly affects revenue: under gross vehicle weight limits, lighter tractors increase allowable payload.
Reported Tesla Semi figures (as cited in an official table reference):
- 500-mile variant curb weight: 23,000 lb (approx. 10.4 t)
- 300-mile variant curb weight: 20,000 lb (approx. 9.1 t)
Competitive framing referenced:
- Mercedes eActros 600: range 311 miles (~500 km), battery ~621 kWh
- Volvo FH Aero Electric: up to 373 miles (~600 km), battery ~780 kWh, battery pack mass referenced at 12 t+ levels
Key claim: Tesla targets comparable or longer range while reducing curb weight by roughly 1.0–1.5 t versus some peers, implying a structural advantage in payload economics.
1-3. Korea-relevant normalization: “Seoul–Busan round trip”
If a Seoul–Busan round trip is treated as ~800 km (500 miles), the 500-mile variant represents a one-charge operational cycle for that route.
A 1 t payload delta is economically material, affecting realized revenue and margin per trip.
1-4. Regulatory overlay (U.S. 23 USC 127) can further improve payload economics
U.S. rules provide an additional weight allowance for electric trucks to account for battery mass.
If Tesla reduces curb weight through engineering while also receiving regulatory allowance, the historical diesel advantage on payload weakens.
2) Quantitative Interpretation: +200 Miles of Range for +1.36 t Indicates Battery-System Efficiency Gains
2-1. 300-mile to 500-mile: weight increase is limited
- 300-mile variant: 20,000 lb (9.1 t)
- 500-mile variant: 23,000 lb (10.4 t)
- Range +200 miles with weight +3,000 lb (~1.36 t)
2-2. Back-calculating with energy use (1.7 kWh/mile) highlights pack/structure efficiency
Cited efficiency: 1.7 kWh/mile.
Additional 200 miles implies ~340 kWh incremental energy.
If this is achieved with ~1.36 t incremental mass, the implication is not only “more cells,” but improvements in cell-level energy density, pack-level structural efficiency, and integration.
2-3. Architectural approach: structural integration vs. add-on battery packaging
Legacy approaches often retrofit batteries onto diesel-derived frames, leading to stacked structural mass.
Tesla’s approach is described as closer to a structural battery concept, where the pack contributes to vehicle structure, potentially reducing redundant frame mass. If validated, the debate shifts from “EVs are inherently heavier” to “design architecture can neutralize weight penalties.”
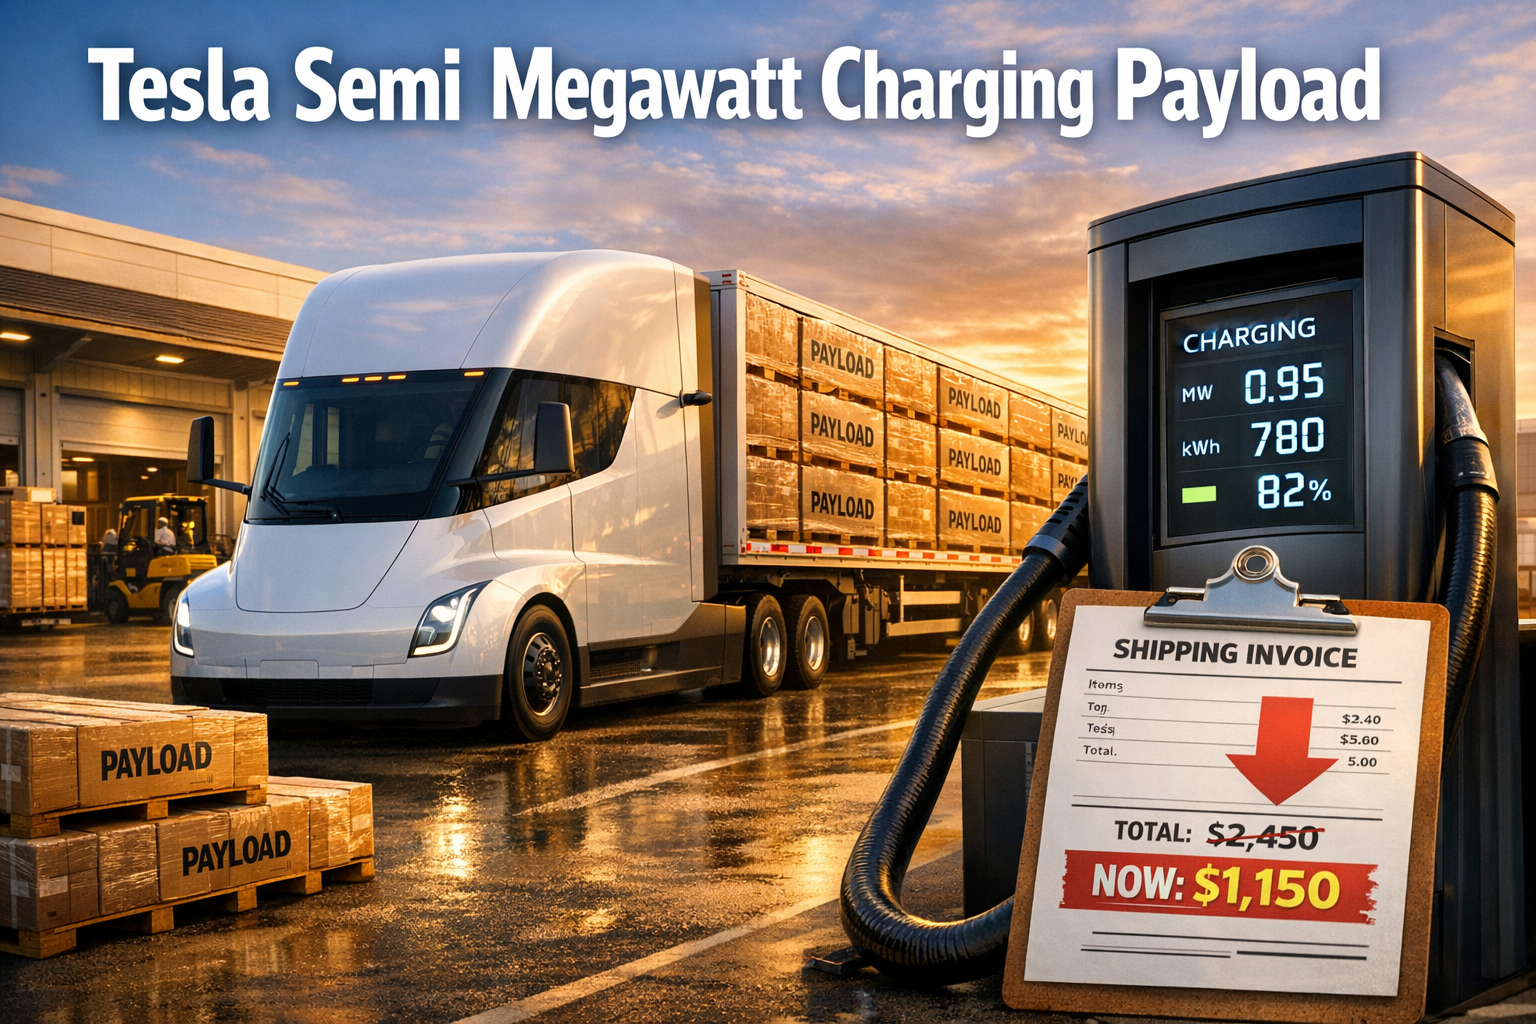
3) Megawatt Charging Is an Operating-Model Lever, Not a Convenience Feature
3-1. Fast ramp to ~1,206 kW peak: operational relevance
Reported charging behavior: peak power reaches ~1,206 kW within ~30 seconds.
Compared with 250 kW passenger-vehicle fast charging, this operates in a different power regime with implications for scheduling and asset utilization.
3-2. Core operating thesis: charging aligns with mandated rest periods
U.S. duty rules require a 30-minute break after 8 hours of driving. The operating objective is to absorb charging entirely into this mandated downtime.
Claimed capability: within ~30 minutes, recharge up to ~70% of the driving range (approximately 350 miles).
If achieved reliably, “charging downtime” is reframed as “compliance downtime,” reducing the operational disadvantage historically associated with EV refueling.
3-3. Infrastructure implication: grid capacity and peak demand become a freight cost variable
Megawatt-class charging links trucking economics to grid interconnection, peak pricing, and demand-management structures.
This extends beyond automotive performance into energy infrastructure investment and policy design, where early access to power capacity and favorable tariff structures could become a competitive differentiator in logistics.
4) TCO as the Decision Variable: Signals From PepsiCo Operating Data
4-1. Maintenance cost: diesel $0.17/mile vs. Semi $0.08/mile
Cited PepsiCo operating figures:
- Diesel: $0.17 per mile (maintenance)
- Semi: $0.08 per mile (maintenance)
Interpretation: reduced maintenance events due to the absence of oil changes, filters, and exhaust aftertreatment systems.
4-2. Energy cost: at 100,000 miles/year, diesel ~$74k vs. electricity ~$34k
Cited annualized comparison:
- Diesel fuel: ~$74,000/year
- Electricity: ~$34,000/year
Combined with maintenance, the cited savings magnitude is ~ $50,000 per truck per year.
4-3. Payback framing: 3–4 years materially lowers adoption friction
EV trucks likely carry higher upfront capex, but fleet decisions are cash-flow driven.
Recurring savings at the cited scale support a 3–4 year payback narrative, which can reduce purchasing hesitation and potentially influence freight cost structures over time without assuming aggressive adoption.
4-4. Battery life (1,000,000-mile design target): residual value becomes central
A 1,000,000-mile design target implies potential for meaningful residual value rather than end-of-life disposal.
For commercial vehicles, a credible used-market residual can accelerate adoption by stabilizing lifecycle economics.
5) Aerodynamics as a Battery Multiplier: Semi Design Priorities
5-1. Cd 0.36: efficiency lever for long-haul energy use
Reported drag coefficient: Cd 0.36.
Typical diesel heavy trucks are referenced at Cd ~0.6–0.7; a comparison is made to a Cd ~0.38 performance car.
At highway speeds, drag materially drives energy consumption; better aerodynamics reduces required battery capacity for a given route, improving weight, cost, and payload outcomes simultaneously.
5-2. Design features aligned to drag reduction
Referenced elements: central seating position, camera-based mirrors, trailer-gap flaps, and underbody smoothing.
The design objective is energy reduction per mile, enabling smaller effective battery requirements for equivalent duty cycles.
6) AI and Macro Linkage: Why “Space-Based AI Data Centers” and Electric Trucking Share the Same Constraint
6-1. Common bottleneck: power and cooling
Discussion extends to SpaceX and xAI integration themes. The linkage is physical infrastructure: AI training is power- and cooling-constrained; megawatt truck charging similarly concentrates demand and requires power delivery and thermal management.
This reinforces a macro theme: electricity infrastructure is re-emerging as a binding constraint across multiple sectors.
6-2. “Terrestrial physical limits” framing: pushing compute offshore/space as a cost-structure idea
The argument presented: land-based data centers face constraints from power availability, cooling, permitting, and local opposition; relocating compute to space is posed as a way to alter cost and constraint structures.
Independently of feasibility, the signal is that AI is increasingly governed by energy and infrastructure economics, not software alone.
6-3. Investor scenario risk: merger structure and Korean tax exposure
A key risk highlighted: if a transaction is executed via share exchange, Korean tax interpretation may treat it as a taxable disposal event for investors, potentially affecting after-tax returns.
By contrast, ticker changes with corporate continuity (e.g., FB to META) historically did not create the same tax outcome.
The relevant variable is transaction structure (share exchange vs. corporate continuity), not the headline “merger” label.
7) Underemphasized Points (Reframed)
7-1. The Semi as a freight-cost deflation mechanism
The central economic claim is cost reduction, not environmental positioning.
If freight operating costs decline structurally, effects can propagate beyond fleet margins into broader supply-chain cost baselines and pricing dynamics, without assuming immediate or universal adoption.
7-2. Megawatt charging advantage may accrue to power access, not vehicle specs
At megawatt scale, charging sites resemble substation-class projects.
Operating economics can diverge based on wholesale power exposure, demand response participation, on-site energy storage integration, and peak-demand optimization. Logistics competitiveness may increasingly include energy procurement capability.
7-3. “Space AI” is secondary; the primary reality is an ongoing power/cooling/infrastructure race on Earth
Whether space-based compute is near-term viable is separate from the immediate trend: rapid growth in AI electricity demand drives grid investment needs, policy friction, and siting disputes.
Combined with commercial vehicle electrification, grid investment may shift from discretionary to strategically necessary at national scale.
8) Global Macro and AI Trend Checklist (2026–)
- Logistics electrification may increasingly appear in corporate financials as operating-cost reduction.
- Grid investment can create an infrastructure capex cycle, increasing demand for transformers, transmission/distribution equipment, cooling systems, and energy storage.
- AI data-center competition will increasingly hinge on power pricing, land, and water/cooling constraints, potentially intensifying policy conflicts.
- Tariffs, regulation, and subsidies may materially influence commercial EV adoption speed, particularly in North America.
- Interest-rate conditions directly affect capex decisions (truck procurement, charging infrastructure, grid upgrades).
This set of dynamics can be consolidated into five macro variables:
Inflation, interest rates, supply chains, energy transition, semiconductors.
< Summary >
The Tesla Semi is positioned to pressure diesel economics across three axes: curb weight (payload economics), charging/operations, and maintenance plus energy TCO.
Megawatt charging is framed as an operating-model change by aligning charging with mandatory rest periods (30 minutes), rather than as a standalone speed metric.
PepsiCo operating data cited suggests materially lower maintenance and energy costs, supporting a 3–4 year payback framework, with potential implications for freight-cost structures over time.
The broader linkage between the Semi and “space AI” narratives is the constraint set of power and cooling; competitive outcomes may depend as much on electricity infrastructure access and tariff optimization as on vehicle specifications.
[Related…]
- Tesla-related latest issues at a glance: https://NextGenInsight.net?s=Tesla
- AI infrastructure/data-center trend updates: https://NextGenInsight.net?s=AI
*Source: [ 오늘의 테슬라 뉴스 ]
– “빌 게이츠가 틀렸다!” 불가능하다던 테슬라 세미, 스펙에 숨겨진 ‘놀라운’ 반전은?
● Stablecoin Surge, Visa Killer, Dollar Power Play
Why a “10x” Stablecoin Payment Volume Scenario Is Becoming Plausible
This report covers three points:(1) Why stablecoins are evolving from “Visa-adjacent” to a payment rail that can surpass traditional card networks
(2) The primary U.S. objective in institutionalizing stablecoins (Treasuries, dollar dominance, and fiscal-deficit mechanics)
(3) The “Top 3” points investors should track and the likely beneficiary segments (Circle, exchanges, custody, payment infrastructure)
1) Core News Brief: “Bitcoin Is Correcting; Stablecoins Are Expanding”
Bitcoin volatility has weakened near-term risk sentiment. In contrast, stablecoins are increasingly used as payment and remittance infrastructure rather than speculative instruments, sustaining faster usage growth.
Key takeaways:
- Stablecoins function as “digital dollars,” driving rapid growth in payment volumes.
- Annual settlement/payment volumes have been cited at approximately USD 9 trillion as of 2025.
- By 2030, expansion by several multiples—up to ~10x versus current levels—has been discussed as a plausible scenario.
2) What Stablecoins Are: “The Dollar for the Digital Economy”
2-1. Definition: 1 USD ↔ 1 Token (1:1 Peg)
Stablecoins are tokens typically pegged 1:1 to fiat currency, most commonly the U.S. dollar. They resemble “digital cash,” in contrast to Bitcoin’s “digital gold” framing.
2-2. Structure: Issuer → Reserves (cash, T-bills, Treasuries) → Users
Issuers such as Tether (USDT) and Circle (USDC) mint stablecoins in exchange for dollars and maintain reserves primarily in cash-equivalents and short-duration government securities. Reserve quality and transparency are central to market confidence.
2-3. Four Stablecoin Types (Ranked by Relevance)
(1) Fiat-collateralized: USDT, USDC, PYUSD
(2) Crypto-collateralized: overcollateralized with assets such as ETH; vulnerable in severe drawdowns
(3) Real-asset-collateralized: gold, real estate; smaller today, potentially supported by tokenization trends
(4) Algorithmic: credibility materially impaired since the Terra/Luna collapse; structurally disadvantaged under regulation
3) Why Stablecoins Are Used: Fees, Speed, and Accessibility
3-1. Traditional Cross-Border Transfers: Complex, Expensive, Slow
Legacy remittance rails involve multiple intermediaries, leading to cumulative fees and settlement times that can reach 3–5 days. Effective costs near 6% on a USD 100 transfer are common in many corridors.
3-2. Stablecoins: ~0.1% Fees, Near-Real-Time, 24/7
Stablecoin transfers are closer to direct wallet-to-wallet settlement. Costs typically compress, settlement is often minutes rather than days, and operations run continuously. This implies infrastructure substitution, not merely convenience.
4) The Primary Growth Engine: Emerging-Market Demand for “Dollar 2.0”
4-1. Why Emerging Markets Over-Index on Stablecoin Usage
Where local currencies face chronic inflation and credibility issues, demand shifts toward dollar exposure. Stablecoins provide a mobile-first mechanism to access dollar-denominated value.
4-2. Examples: Argentina, Venezuela, Turkey, Nigeria
In high-inflation economies, holding local cash can imply rapid real-value erosion. Accessing dollars via banking channels can be costly or constrained by regulation. Stablecoins increasingly fill this gap, including reported use in commodity-linked transactions in certain markets.
5) Why the U.S. Supports Stablecoins: Upgrading Dollar Dominance
5-1. Pressures on Dollar Leadership: RMB Settlement, De-Dollarization Efforts, U.S. Debt
While alternative settlement initiatives exist, the most material structural issue is the U.S. fiscal deficit and government debt, including the interest-cost burden.
5-2. The Institutionalization Mechanism: Linking Reserves to U.S. Treasuries
A central regulatory direction is to require or incentivize stablecoin reserves to be held in U.S. Treasuries and similar instruments.
Mechanics:stablecoin growth → reserve growth → increased Treasury demand
This can structurally expand the buyer base for U.S. government debt while reinforcing global dollar usage through private-sector rails.
5-3. Why Private Stablecoins May Be Preferred Over CBDCs
CBDCs concentrate issuance and control within the central bank, raising political and policy sensitivities. A private stablecoin model can shift Treasury demand creation to regulated private issuers that accumulate government securities as reserves, potentially broadening demand without direct central-bank balance-sheet expansion.
6) Friction With Banks: Deposit Outflows and Margin Compression
6-1. Bank Earnings Model: Net Interest Margin
Banks fund with deposits and lend at higher rates, capturing the spread.
6-2. Stablecoin Issuers: Low-Cost Funding Without Paying Depositor Yield
Stablecoins can attract balances for transactional utility rather than yield. Issuers may deploy reserves into short-duration government securities, monetizing the spread. This can increase competitive pressure on bank deposits.
6-3. Bank Response: Adoption or Integration
Banks may respond via tokenized deposits, proprietary networks, or partnerships with stablecoin and blockchain infrastructure providers, similar to initiatives observed among large global banks.
7) Link to AI: The Payment Layer for an “AI Agent Economy”
As AI agents increasingly transact autonomously (procurement bots, automated settlement, subscription management), payment rails must support:
- continuous availability (24/7)
- programmatic control (API-native)
- rapid settlement
- automation via smart contracts
Card networks and bank APIs face constraints across borders, settlement timing, permissions, and fee structures. Stablecoin rails are structurally aligned with automated, machine-driven payments, suggesting a potential tailwind if agentic commerce scales.
8) Beneficiary Map: Where Value Accrues
8-1. Issuers: Circle (USDC)
Issuer economics are driven primarily by reserve income tied to government-security yields and distribution arrangements. Market expectations can introduce valuation volatility.
8-2. Exchanges/Brokers: Coinbase, Robinhood
As stablecoin usage expands, on/off-ramps (fiat ↔ stablecoin) become strategic. Platforms can bundle liquidity, wallets, merchant/payment integrations, and institutional services.
8-3. Custody, Security, and Wallet Infrastructure
As stablecoins function as money-like instruments, custody and security requirements converge with financial-infrastructure standards. Institutional adoption increases demand for compliance, auditability, and risk controls.
8-4. Payment and Settlement Infrastructure (Blockchain Rails)
As volumes scale, the underlying settlement networks, integrations, and enterprise connectivity become increasingly important. This layer is likely to remain sensitive to macro variables including liquidity conditions, rates, and FX dynamics.
9) Top 3 Points to Monitor
TOP1. Stablecoins as a Potential Structural Engine of U.S. Treasury Demand
Beyond cheaper remittances, the strategic link is: stablecoin growth → reserve growth → incremental demand for short-duration Treasuries. If formalized, stablecoins may reinforce both fiscal financing mechanics and dollar dominance.
TOP2. Emerging Markets Are Shifting How They Hold Dollars
Dollar exposure is increasingly obtained via mobile stablecoins rather than banks, cash markets, or informal channels, implying structural changes in capital flows and monetary sovereignty constraints.
TOP3. AI-Agent Payments May Favor Wallet + Stablecoin Rails Over Cards
Autonomous commerce requires always-on, programmable settlement. Stablecoins are structurally compatible with machine-to-machine payments, potentially aligning AI, fintech, and digital-asset adoption into a single infrastructure theme.
10) Key Risks
Regulatory risk: stronger reserve, disclosure, and audit requirements may accelerate consolidation.
De-pegging events: credibility is central; a loss of confidence can propagate quickly.
Security risk: hacks and wallet failures can slow mainstream adoption.
Rate sensitivity: reserve income depends on interest-rate cycles, affecting issuer profitability.
< Summary >
Stablecoins are scaling as “digital dollar” payment rails rather than volatility-driven assets. Core adoption drivers include lower remittance costs, faster settlement, 24/7 operation, and strong emerging-market demand for dollar exposure. The U.S. policy trajectory aims to institutionalize stablecoins while steering reserves toward Treasuries, potentially reinforcing both Treasury demand and global dollar usage. If AI-agent commerce expands, stablecoins may benefit as programmable, always-on settlement instruments. Potential beneficiaries include issuers (Circle), on/off-ramps (exchanges/brokers), custody/security providers, and broader payment/settlement infrastructure.
[Related]
- Stablecoin institutionalization and the evolving global payments landscape (NextGenInsight.net?s=stablecoin)
- Dollar dominance 2.0: new mechanisms for creating Treasury demand (NextGenInsight.net?s=dollar)
*Source: [ 월텍남 – 월스트리트 테크남 ]
– 결제액 10배 상승, 절대 놓치면 안되는 “이것” TOP3
● Jobs Crash, Shadow Liquidity Surge, S P 500 6900 Showdown, Big Tech Layoff Shock, Bitcoin Ethereum Range Trap
2026 U.S. Market “Major Reversal” Signals: Key Takeaways in One View — Labor Deterioration, Off-Balance Liquidity Channels, S&P 500 6,900 Inflection, Big Tech Layoffs, and BTC/ETH Range-Trading Framework
This report covers:
- Why U.S. labor indicators are signaling elevated downside risk, with key figures.
- Why the S&P 500 and Dow are holding up despite cooling activity: (i) Fed rate-cut expectations, (ii) fiscal spending, (iii) inflation-hedge flows.
- Why markets are increasingly focused on “unofficial liquidity” rather than the policy rate.
- Actionable levels: S&P 500 futures 6,900; Tesla 435/470; Bitcoin 70k/60k; Ethereum 2,000/2,500.
- The most critical single-line risk statement.
1) News Briefing: In 2026, U.S. Real Economy Weakness Appears First in Labor
The central message is that deterioration in employment can precede broader real-economy weakness, while asset prices may reprice earlier.
1-1. ADP Employment: “22,000” Jobs, Below Expectations
Private payroll growth (ADP) is referenced at 22,000 for January. Relative to the 200,000–300,000 monthly pace seen 2–3 years ago, the deceleration is material and consistent with rising recession sensitivity.
1-2. Challenger Job Cuts: 108,435 (+118% YoY) Reflect Slowing Activity and Restructuring
Headline layoffs more than doubled year-over-year. Sector signals:
- Transportation/logistics: 30,000 cuts, consistent with weakening freight volumes.
- Technology: 20,000 cuts, aligned with AI adoption and capex/prioritization shifts.
- Healthcare: 17,000 cuts, consistent with fiscal pressure transmitting into provider operations.
1-3. JOLTS/Openings: Hiring Pauses, Then Headcount Reductions
A decline in job openings typically feeds through to slower wage growth and softer consumption, which can pressure earnings over time. The persistence of equity strength is addressed below.
2) “Why Are Stocks Rising When the Economy Is Weak?” The 2026 Market Logic: Learned Policy Reaction Function
The prevailing mechanism is: weaker real-economy data increases expectations of incremental liquidity support, lifting risk assets via discount-rate repricing rather than fundamentals.
2-1. Market Baseline: Growth Cooling → Fed Rate-Cut Expectations → Asset Prices Front-Run
Rate-cut probabilities are monitored continuously, and sensitivity to Fed communications is elevated into the next FOMC window (referenced around March 18).
2-2. Why the Fed May Delay: Inflation Not Fully Contained
Premature easing could reaccelerate inflation. As a result, the policy rate may remain constrained while markets price alternative channels of liquidity provision.
3) Three Engines Supporting Risk Assets: Rate-Cut Expectations + Fiscal Outlays + Inflation-Driven Cash Avoidance
3-1. Engine 1: Rate-Cut Expectations Reinforce Buyback Capacity
Lower funding costs increase the incentive for share repurchases and retirements, supporting EPS mechanics even if real-economy spillovers are limited. This has functioned as a recurring downside buffer for the S&P 500.
3-2. Engine 2: Fiscal Spending Persistence: Deficits Translate Into Revenues
The framing indicates spending exceeds tax receipts by approximately USD 2 trillion. The key market implication is flow-through into defense, construction, and pharmaceuticals via contracts and demand, supporting top-line stability and limiting equity downside in the near term.
3-3. Engine 3: Inflation Fear Encourages Capital Rotation Out of Cash
As real-return anxiety rises, flows shift toward risk assets (equities, real estate, crypto). This is primarily positioning behavior rather than valuation-based allocation, increasing the probability of overshoot dynamics.
4) Level-Based Checklist: S&P 500 / Tesla / Bitcoin / Ethereum
4-1. S&P 500 E-mini Futures (/ES): 6,900 as the Key “Stamina Line”
After support near 6,751 and a rebound, a recapture of 6,900 is the critical pivot. The signal is not only whether price is above/below 6,900, but whether breakdown frequency below 6,900 increases, indicating weakening bid support.
Monitoring /ES can provide faster trend confirmation than cash indices. Common retail platforms cited include Yahoo, TD, and Robinhood.
4-2. Tesla (TSLA): 435 as Initial Confirmation; >470 as Higher-Confidence Zone
The framework emphasizes confirmation over prediction. The 430–435 area is treated as an initial resistance/validation zone, while sustained trade above 470 is presented as a more reliable recovery threshold.
An “island” gap configuration is cited as an ongoing technical risk, implying prolonged overhead supply if the structure persists.
4-3. Bitcoin (BTC): Break Below 78k → Approach to 60k Range Floor; 70k Reclaim as Key
The preferred approach is range-based execution: avoid entries in ambiguous mid-zones (e.g., 68k, 65k) and focus on structurally defined levels such as the ~60k range floor. Current focus is on reclaiming and holding 70k.
4-4. Ethereum (ETH): Below 2,800 Shifts Focus to the 2,500 Range; 2,000 as Major Support
Given crypto volatility, support is treated as a zone rather than a single price. The 2,500 area is framed as a broader support range for staged entries, with 2,000 identified as the next critical support.
5) Most Material Risk Statement (Single-Line)
The market is not rallying on strong growth; it is pricing discount-rate and liquidity support on the assumption that policy intervention increases as conditions weaken.
The primary tail risk is not further data deterioration, but a regime in which the Fed/Treasury does not or cannot stabilize financial conditions despite weaker data. In that scenario, reversal magnitude in either direction can increase materially.
Operationally, monitoring the durability of liquidity channels and the risk of abrupt tightening in financial conditions is as important as tracking labor and inflation releases.
6) Practical Investment Framework for 2026: “Policy–Liquidity–Levels” Rather Than “Fear vs. Greed”
- Rate-cut expectations can support assets, but renewed inflation pressure can rapidly reverse those expectations.
- Fiscal deficits face long-term sustainability debate, but near-term they can support corporate revenues and equity downside resilience.
- AI investment is a dual driver: a growth catalyst and a labor-cost optimization force that can depress employment.
- Outcomes are increasingly determined at key levels:
- S&P 500 futures: 6,900
- Tesla: 435 / 470
- Bitcoin: 70k / 60k
- Ethereum: 2,000 / 2,500
A range-based framework is emphasized.
For search-intent alignment, high-traffic topic clusters include U.S. rate cuts, inflation, U.S. economic outlook, the S&P 500, and AI investment.
< Summary >
In 2026, labor and hiring indicators are weakening, while risk assets remain supported by Fed rate-cut expectations, fiscal spending, and inflation-driven rotation out of cash. The core risk is not weaker data per se, but a failure of liquidity support despite deteriorating conditions. Key levels are S&P 500 futures 6,900; Tesla 435/470; Bitcoin 70k/60k; Ethereum 2,000/2,500, with a range-based execution approach.
[Related Articles…]
- https://NextGenInsight.net?s=rate
Signals that typically appear first in asset markets when the U.S. rate path shifts - https://NextGenInsight.net?s=inflation
Early signs of inflation reacceleration and portfolio responses when living costs and asset prices diverge
*Source: [ 미국주식은 훌륭하다-미국주식대장 ]
– 2026년 미국시장 대반전 상황이 시작됩니다.