● Tesla Shock, Wall Street Miss, FSD Boom
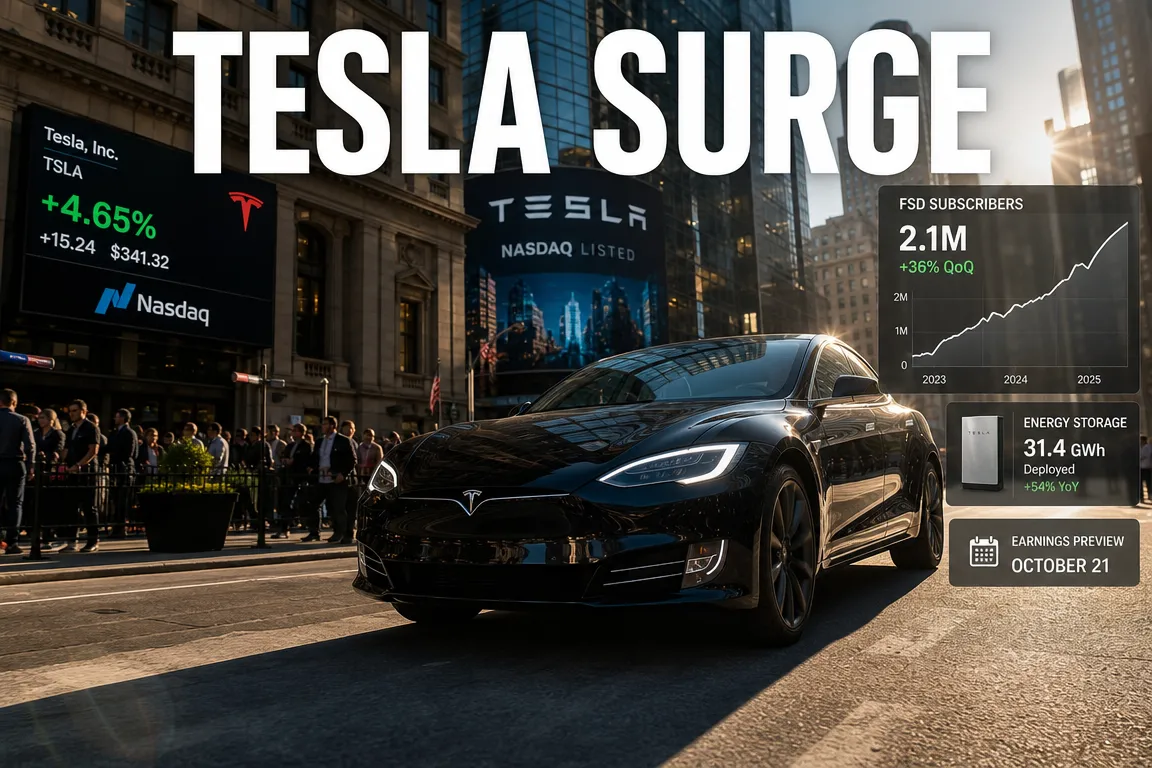
Tesla Surges 4.65% as Wall Street Misses Again: The Key Figure to Watch Before 3Q Deliveries Is FSD Subscriber Count
The main point of this Tesla development is not simply that vehicle sales were strong.
Wall Street again underestimated Tesla’s third-quarter deliveries, and the actual result materially exceeded expectations.
This earnings cycle, however, the more important metrics are FSD subscriber count, operating margin, and energy storage growth.
With Tesla shares already trading near $370, investors should focus less on units delivered and more on how much recurring revenue is generated from each vehicle sold.
In the source material, Tesla reached $370.5, rising 4.65% in one day.
By comparison, the Nasdaq rose 1.19% on the same day, meaning Tesla significantly outperformed the broader market.
The move was driven by the 3Q delivery surprise, Wall Street forecast misses, and renewed expectations for FSD and autonomous driving revenue.
1. Market backdrop: U.S. equities rose, but Tesla was stronger
In the source material, U.S. equities closed higher across the board.
The S&P 500 rose 0.74%, the Nasdaq gained 1.19%, and the Dow Jones Industrial Average advanced 0.49%.
Although all three major indices rose, Tesla climbed 4.65%, nearly four times the Nasdaq’s gain.
- S&P 500: +0.74%
- Nasdaq: +1.19%
- Dow Jones: +0.49%
- Tesla share price: $370.5, +4.65%
Tesla’s strength was not solely the result of a broader technology rebound.
The company’s third-quarter deliveries came in well above expectations, prompting investors to revise earnings assumptions upward.
While the broader market was firm, Tesla’s move reflected company-specific momentum.
2. Rates and oil: a difficult environment for auto purchases, but supportive for EV demand
The source material cited the U.S. 10-year Treasury yield at 5.28%.
This rate is a key benchmark for mortgage borrowing costs, auto financing, and corporate funding.
Higher rates increase the burden on consumers financing vehicle purchases.
In other words, this is not an ideal environment for buying a car.
Even so, Tesla delivered more vehicles than expected, which is significant.
It suggests demand for EVs remained resilient despite the elevated rate environment.
Meanwhile, international oil prices remained high at around $91 per barrel.
Higher fuel prices increase the cost of ownership for internal combustion vehicles and improve the relative appeal of EVs.
Rates are a headwind for vehicle affordability, while oil prices continue to strengthen the rationale for EV adoption.
3. Third-quarter Tesla deliveries: more than 24,000 units above Wall Street expectations
Tesla delivered 486,532 vehicles in the third quarter.
That figure was approximately 24,000 units above the Street average estimate, or more than 5% above expectations.
- 3Q Tesla deliveries: 486,532 units
- Above Wall Street consensus: about 24,000 units
- Beat versus expectations: about 5%+
- Year-over-year change: about -2%
The modest year-over-year decline should not be viewed as purely negative.
Last year’s third quarter was Tesla’s strongest on record.
At the time, demand was pulled forward by the expiration of the $7,500 U.S. EV tax credit.
The $7,500 credit represents a substantial effective discount.
Despite the loss of that policy support this year, deliveries remained only slightly below last year’s record level.
That indicates demand held up even without the incentive tailwind.
4. Why Wall Street missed again
According to the source material, Wall Street repeatedly lowered its third-quarter delivery estimates for Tesla.
Goldman Sachs projected 435,000 units, while JPMorgan estimated 482,000 units after cutting its target price.
Actual deliveries came in at 486,532 units.
- Goldman Sachs estimate: 435,000 units
- JPMorgan estimate: 482,000 units
- Actual deliveries: 486,532 units
Relative to the most conservative forecast, Tesla delivered more than 50,000 additional units, and it also exceeded the higher estimate.
A similar pattern occurred in the second quarter, when Tesla also beat Wall Street expectations by more than 18%.
The market is therefore treating this as a second consecutive quarter in which consensus underestimated Tesla’s demand.
Investor reaction was also shaped by the fact that JPMorgan and Goldman Sachs had lowered targets shortly before the delivery release.
The stronger-than-expected result raised concerns that Wall Street has been too conservative on Tesla demand.
5. Inventory declined: Tesla delivered more vehicles than it produced
One notable point in the third quarter is that Tesla delivered roughly 22,000 more vehicles than it produced.
In practical terms, this implies that inventory built up earlier in the year was drawn down quickly.
In the first quarter, there were concerns that about 50,000 unsold vehicles had accumulated.
At that time, the market focused on slowing demand, peak EV concerns, and pricing pressure.
By the end of September, much of that inventory appears to have been converted into deliveries.
On a year-to-date basis through September, the gap between production and deliveries was reportedly only 146 units.
That suggests the inventory burden created earlier in the year has been largely normalized.
6. Energy storage was weaker than expected
While vehicle deliveries beat estimates, Tesla’s energy storage figure fell short of expectations.
Third-quarter energy storage deployments were reported at 13.7 GWh.
That was still the second-highest quarterly level on record, but about 14% below the Street estimate of 15.9 GWh.
- 3Q energy storage deployments: 13.7 GWh
- Wall Street estimate: 15.9 GWh
- Shortfall versus expectations: about 14%
- Assessment: second-highest on record, but below consensus
The key question is directionally important.
AI data center expansion, grid investment, and renewable energy growth have led investors to expect faster growth in Tesla’s energy business than in automotive sales.
However, the actual numbers missed expectations in two of the past three quarters.
Tesla has not yet provided a detailed explanation, so the upcoming earnings call should clarify whether the shortfall reflects temporary installation delays, production limits, or regulatory bottlenecks.
That distinction matters for valuation.
7. Two possible explanations for weaker energy performance: regulation and production capacity
The first possibility is regulation.
The source material referenced tighter approval conditions for data centers and large-scale battery installations in states such as New York, Texas, Illinois, Chicago, and Oregon.
AI data centers require substantial power capacity.
As a result, approvals can be slowed by grid constraints, higher electricity costs, and environmental concerns.
If Tesla’s Megapack deployments are being delayed by such issues, the problem may be administrative rather than demand-related.
The second possibility is production capacity.
Based on Tesla’s disclosed factory capacity, combined Megapack output appears to be roughly 15 GWh per quarter.
However, the Street was expecting 15.9 GWh.
If Tesla has not yet reached that level of output, then consensus may have been too aggressive.
Tesla also indicated that its Houston Megapack factory may begin production later this year, but a facility does not reach full utilization immediately.
Ramp-up takes time.
Accordingly, the core issue is not simply demand, but whether production and installation can keep pace.
8. The most important figure for this earnings release: FSD subscriber count
The most important number in this quarter’s release is not deliveries, but FSD subscriber count.
The reason is that investors increasingly view Tesla not only as an automaker, but also as a software and autonomous driving platform company.
Each vehicle Tesla delivers is a potential FSD hardware base.
Accordingly, the 486,532 vehicles delivered in the third quarter represent a future pool of customers who may subscribe to FSD.
According to the source material, Tesla’s FSD subscriber base rose from about 1.28 million in the first quarter to about 1.48 million in the second quarter.
That implies a quarterly increase of roughly 200,000 subscriptions.
The figure was also described as about 56% higher than a year earlier.
- 1Q FSD subscriptions: about 1.28 million
- 2Q FSD subscriptions: about 1.48 million
- Quarterly increase: about 200,000
- Year-over-year increase: about 56%
It is also important that Tesla’s reporting is based on paying subscribers rather than promotional users.
That makes the figure more representative of actual monetization.
9. Why FSD subscriber growth matters for Tesla’s valuation
Vehicle sales are cyclical and sensitive to interest rates.
When rates are high, financing becomes more expensive and consumers may delay purchases.
By contrast, FSD subscriptions generate recurring revenue from an installed vehicle base.
This matters for Tesla’s valuation because a recurring software model can command a much higher multiple than a one-time vehicle sale.
It supports a re-rating from an EV manufacturer to an AI-enabled autonomous driving platform.
The source material noted that Elon Musk’s compensation framework reportedly includes a target of 10 million active FSD subscriptions.
At roughly 1.48 million today, Tesla remains well below that threshold.
As a result, the pace of subscriber growth over the next several quarters will be a critical metric.
If third-quarter FSD additions exceed 200,000 by a meaningful margin, the market may further revalue Tesla as a software growth story.
If subscriber growth lags even as deliveries rise, the delivery beat may be interpreted mainly as a traditional auto sales result.
10. Expansion in Korea, Japan, Taiwan, Hong Kong, and Europe could reshape FSD trends
This quarter is also important because Tesla’s FSD distribution model and geographic footprint are expanding at the same time.
The source material stated that from June, Taiwan, Japan, and Hong Kong shifted from lifetime FSD purchases toward subscriptions.
It also noted that Korea introduced FSD Lite in July, while Europe expanded FSD approval to seven countries.
This is not merely a regional rollout.
If Tesla shifts FSD from one-time purchases to monthly subscriptions, revenue becomes more recurring and more stable.
That could materially affect long-term earnings and cash flow.
As a result, investors should check whether third-quarter FSD subscriptions rise materially above 1.68 million.
Given the second-quarter base of 1.48 million, that would be a natural continuation of the current trend.
A much larger increase would be an early sign that geographic expansion is translating into measurable adoption.
11. What Tesla shareholders near $370 should focus on
With Tesla trading near $370, short-term price moves can distract from the underlying operating data.
For this earnings release, the following four items are the most important.
- First, FSD subscriber count
This is the key metric for assessing Tesla as an AI autonomous driving platform. - Second, automotive operating margin
Higher delivery volume is less meaningful if it comes with deep discounting. - Third, whether inventory reduction improves cash flow
Converting vehicle inventory into deliveries can support near-term cash generation. - Fourth, the cause of energy storage weakness
The implications differ materially depending on whether the issue is demand, regulation, or capacity.
The source material noted that Tesla’s second-quarter operating margin was 1.4%.
That is a very low level by historical standards.
If third-quarter deliveries improved but margins weakened further, the delivery beat would carry less weight.
By contrast, if Tesla reduced inventory without excessive discounting, the result would be more constructive.
That would imply that previously tied-up vehicles were converted into cash, improving near-term liquidity.
This matters because Tesla continues to invest heavily in AI, manufacturing, robotics, and energy infrastructure.
12. The key issue is not deliveries, but recurring revenue conversion
Many headlines focus on Tesla’s stronger-than-expected deliveries.
That figure is important, but the central question is how many of the 486,532 delivered vehicles will later convert into FSD revenue.
Tesla’s long-term value depends less on vehicle sales alone and more on monetizing the installed base through software, insurance, energy, and autonomous services.
Like Apple’s ecosystem model, Tesla is trying to build a structure where hardware sales create a recurring revenue platform.
The key question is therefore whether Tesla is primarily an automaker, or an AI-driven subscription platform with a rapidly expanding user base.
The third-quarter release should help clarify that distinction.
13. Tesla third-quarter earnings release schedule
According to the source material, Tesla’s third-quarter earnings release is scheduled for after the U.S. market close on October 21.
In Korea, the release would be available around 6:30 a.m. on October 22.
The market’s focus in the release will be on earnings quality rather than delivery volume alone.
FSD subscriber count, automotive margins, energy storage deployments, cash flow, and AI investment spending all matter.
14. Investment view: whether Tesla should be valued as an automaker or an AI platform
If Tesla is viewed as an automaker, the delivery beat is positive, but margin pressure remains a concern.
High rates, intense EV competition, and pricing pressure continue to shape the sector.
If Tesla is viewed as an AI platform, the key variables are FSD subscriber growth and the potential for robotaxi commercialization.
Vehicle deliveries then become a leading indicator of the addressable FSD customer base.
In that framework, the main driver of valuation is recurring autonomous software revenue rather than near-term vehicle sales.
This third-quarter release will help determine which of those two views the market is more willing to support.
For shareholders near $370, the more important focus is on structural operating data rather than one-day price moves.
< Summary >
Tesla delivered 486,532 vehicles in the third quarter, exceeding Wall Street expectations by roughly 24,000 units.
Year over year, deliveries were down about 2%, but last year’s third quarter benefited from a temporary surge ahead of the expiration of the $7,500 U.S. EV tax credit.
Inventory declined meaningfully, and the market responded positively, pushing Tesla shares up 4.65%.
However, energy storage deployments came in at 13.7 GWh, below the Street estimate of 15.9 GWh.
The most important figure in this earnings release is not deliveries, but FSD subscriber count.
The market will be watching whether third-quarter subscriber additions rise well above the 200,000 pace implied by the second-quarter base of 1.48 million.
[Related Articles…]
*Source: [ 오늘의 테슬라 뉴스 ]
– 테슬라 +4.65%, 월가가 두 번 연속 틀렸다 — 이번 어닝에서 차보다 먼저 봐야 할 숫자, $370 주주는?
● Liquidity Boom, Munger Filter, Sell Signal
Why Liquidity Cycles Become More Risky: Charlie Munger’s 4-Step Framework for Screening Stocks and Knowing When to Sell
The key point is not simply that a liquidity-driven market means investors should buy equities indiscriminately.
In this environment, investors should evaluate interest rates, fiscal policy, the U.S. equity market, the semiconductor cycle, and long-term investment principles together.
This report summarizes why a liquidity-driven move was seen as more likely in late September and October, which asset classes tend to attract capital in such periods, and why Charlie Munger and Warren Buffett argued against buying anything without discipline.
A point often missed in other reports and video commentary is that liquidity can lift the market as a whole, but long-term returns are determined by a company’s moat and by the discipline applied to selling.
In other words, even in a strong market, companies that are unfamiliar, lack a durable moat, or are run by management that misallocates capital should be avoided.
1. Market Context: Why Late September and October Were Seen as Potential Liquidity Windows
Professor Kim Kwang-seok had previously described June and July as correction phases, August as a range-bound market, and the period after mid-September as one with increased potential for a liquidity-driven rally.
In the source material, June and July are characterized as volatile correction periods, while August is described as a sideways market.
The view is that market sentiment could shift back toward risk assets from late September into October.
This is based on two main factors.
-
First, expectations of easing geopolitical tensions.
A sequence including a U.S.-China summit, the midterm elections, and the APEC summit could support a “manageable peace” or a reduction in tensions.
When geopolitical risk declines, investors generally favor risk assets over defensive assets.
-
Second, the separation between monetary and fiscal policy.
In the past, lower rates typically signaled easing and higher rates signaled tightening.
More recently, central bank policy has remained restrictive while government fiscal policy has turned expansionary.
As a result, it is no longer sufficient to assess the market using interest rates alone.
This point is critical.
Market direction is not determined solely by policy rates.
Government spending, industrial subsidies, infrastructure investment, defense spending, and power-grid investment tied to AI data centers can inject liquidity into specific sectors even when rates remain elevated.
2. Asset Classes That Typically Attract Capital in a Liquidity-Driven Market
When geopolitical tensions ease and liquidity increases, capital typically rotates into risk assets first.
The main categories mentioned are as follows.
-
U.S. equities
This is the first market global capital tends to monitor.
In particular, the Nasdaq and large-cap technology stocks serve as a barometer for risk appetite.
-
Technology and AI-related stocks
AI infrastructure, data centers, cloud platforms, power grids, and semiconductor equipment often draw strong interest in liquidity-driven markets.
-
Semiconductors
DRAM, HBM, AI accelerators, foundry services, and memory-cycle conditions are influenced by both liquidity and earnings cycles.
-
Digital assets
These are among the most sensitive to extreme risk-on sentiment.
However, one should not assume that liquidity automatically improves the fundamentals of every company.
That is why a Munger-style screening framework is necessary.
3. The Core Principle of Charlie Munger and Warren Buffett: Preserving Capital Comes First
Warren Buffett’s best-known investment principle is straightforward.
-
Rule No. 1: Do not lose money.
-
Rule No. 2: Never forget Rule No. 1.
This may sound like a joke, but it is central to the investment process.
A large loss requires a disproportionately large gain to recover.
For example, a 30% loss requires a gain of roughly 43% to break even.
In a liquidity-driven market, the key question is not which stock will rise fastest, but how much downside risk exists if the investment thesis proves wrong.
4. Charlie Munger’s 4-Step Investment Framework
Charlie Munger did not analyze every company available in the market.
He placed great emphasis on screening and exclusion.
Step 1: Invest only in areas you understand
Munger and Buffett placed businesses they did not understand into the “too hard” category.
They did not try to value every company with precision.
Instead, they started with businesses they could understand clearly.
Buffett described this as choosing a 30-centimeter hurdle instead of trying to clear a 2-meter one.
Sectors such as semiconductors, AI, quantum computing, biotech, and power infrastructure may appear attractive, but they may still fall outside an investor’s competence if the underlying structure is not understood.
AI semiconductors in particular require an understanding of technology structure, customer relationships, supply chains, pricing power, and the pace of competitive catch-up.
Step 2: Combine quantitative analysis with qualitative assessment and management review
Company analysis is not limited to financial metrics.
Revenue, operating profit, cash flow, and leverage ratios matter, but management quality also matters.
Munger evaluated management based on competence, trustworthiness, and ownership mindset.
He paid close attention to how management used capital.
Strong management teams allocate capital prudently on behalf of shareholders.
Weak management teams may pursue aggressive acquisitions, excessive capital spending, or expansion for appearance rather than value.
In a liquidity-driven market, capital allocation discipline becomes even more important because funding is easier to obtain.
Step 3: Confirm whether a durable economic moat exists
One of the concepts Munger and Buffett focused on most was the economic moat.
A moat is the defensive barrier that makes it difficult for competitors to enter or displace an incumbent.
In corporate terms, this may include technology leadership, brand strength, network effects, cost advantages, regulatory barriers, or customer lock-in.
For example, Samsung Electronics’ moat in DRAM and HBM depends on maintaining a technical advantage that is not easily replicated by late entrants such as Micron or CXMT.
However, moats are not permanent.
In technology industries, competitive advantage can erode quickly.
The source material cites Velodyne as an example.
It was once a leading lidar company in autonomous driving, but its moat weakened as Chinese firms began producing much cheaper products at scale.
This example is highly relevant for AI-era investing.
The current leader is not necessarily the future leader.
Step 4: Compare intrinsic value with market price
Even if a company is attractive, it should not be purchased at any price.
Munger calculated intrinsic value and compared it with the market price.
The essence of investing is assessing the difference between what is paid and what is received.
One of the key ideas is this:
It is better to buy a great company at a fair price than a decent company at a very cheap price.
In a liquidity-driven market, investors often overstate growth prospects and push prices higher first.
As a result, even strong companies may offer limited upside if valuation becomes excessive.
5. Diversification vs. Concentration: Why Munger and Buffett Referred to Five Holdings
Charlie Munger believed that exceptional opportunities are not frequent.
He therefore preferred concentrating on a small number of businesses he understood well rather than spreading capital too widely.
Berkshire Hathaway’s portfolio reflects this approach.
In the source material, Apple is cited as accounting for 22.6% of the portfolio.
The top four holdings, including Apple, American Express, Bank of America, and Coca-Cola, are described as representing more than 60% of the total portfolio.
This is a clear example of concentrated investing.
However, this should not be mistaken for concentration in a single stock.
Munger and Buffett accepted concentration as a way to improve returns, but they also recognized that at least four to five holdings are needed to reduce single-company risk.
For most investors, using leverage to concentrate 100% or more into one stock is highly risky.
In a liquidity-driven market, leverage may amplify gains, but it can also lead to irreversible losses.
6. Doing Nothing Is Also an Investment Decision: Frequent Trading Lowers Returns
Munger argued that investors have a bias toward action.
When markets move, many investors feel compelled to buy or sell to remain comfortable.
In reality, doing nothing is often the better decision.
The source material cites a Korea Capital Market Institute report on mobile trading systems.
It found that mobile trading investors tended to achieve lower returns than home-trading investors.
The main reasons were higher turnover, more frequent trading, and a larger share of same-day trading.
As trading frequency rises, taxes and transaction costs increase, and impulsive decisions become more likely.
For that reason, one of the most important risks in a liquidity-driven market is continuously rotating into stocks that merely appear attractive.
7. FOMO and JOMO: Why Investors Must Think Against the Crowd
Buffett’s well-known advice is as follows:
Be fearful when others are greedy, and greedy when others are fearful.
This is especially important in a liquidity-driven market.
When stocks rally sharply and everyone appears to be talking about equities, investors experience FOMO.
FOMO is the fear of missing out.
The source material argues that strong FOMO may actually be a signal to consider selling.
By contrast, periods when markets correct sharply and people say they are glad they stayed out of stocks may reflect JOMO.
JOMO is the joy of missing out.
That can often coincide with a market bottom.
Investors therefore need to think in a way that is independent of crowd psychology.
8. Why Investors Fail to Sell: Confirmation Bias
Many investors find selling more difficult than buying.
The reason is confirmation bias.
Before buying a stock, investors are more likely to evaluate it objectively.
Once they own it, however, they tend to search for information that supports their position.
Even when a stock declines, they may continue believing it will recover and ignore negative signals.
Only after losses become severe do they acknowledge the mistake.
The source material refers to the 2023 boom in secondary battery stocks and the subsequent shift in market leadership.
It notes that investors found it difficult to accept negative views on the battery sector at the time.
The same applies to semiconductors.
Investors holding Samsung Electronics or SK Hynix may be reluctant to listen to negative semiconductor data.
However, market share shifts, Chinese competition, pricing pressure, and the pace of technological transition must be monitored closely.
Strong investors consider both favorable and unfavorable information.
9. How to Define a Selling Discipline
From a Munger-style perspective, selling should be guided by logic rather than emotion.
Investors should first be clear about why they bought the stock.
They should then determine whether that original thesis has changed.
-
Has the moat assumed at purchase remained intact?
-
Is management still allocating capital rationally?
-
Has industry growth slowed?
-
Is competitive pressure increasing faster than expected?
-
Has the share price become excessive relative to intrinsic value?
If an opposing view can be logically rebutted, the position may still be held.
If it cannot, then selling should be considered.
That is the framework for deciding when to exit.
10. Why Buffett and Munger Were Effective: They Kept a Devil’s Advocate Nearby
One of the most important concepts in the source material is the idea of a devil’s advocate.
A devil’s advocate is someone who deliberately presents the opposing view.
For Buffett, Charlie Munger played that role.
Munger was able to say no to Buffett.
Buffett, in turn, valued that challenge.
The same principle applies to investing.
If an investor believes semiconductors are attractive, they should also study the arguments that identify risks in semiconductors.
If an investor expects AI stocks to continue rising, they should also consider warnings about overheating.
Reducing confirmation bias requires engaging with information that contradicts one’s own view.
Buffett even invited a hedge fund manager who had shorted Berkshire Hathaway to the annual meeting to ask difficult questions.
That shows how seriously he treated opposing views.
11. The Most Important Point Often Missed in Other Coverage
The most important point in this material is not simply that a liquidity-driven market may be forming.
The real issue is that in an era where monetary and fiscal policy move separately, liquidity flows differently across industries.
Assessing the market only through interest rates will miss part of the picture.
Even with high policy rates, government fiscal support can drive liquidity into specific sectors.
Examples include AI data centers, power grids, semiconductors, defense, infrastructure, and energy transition industries.
At the same time, these industries can also face rapid competitive disruption.
As Velodyne showed in lidar, today’s market leader can become tomorrow’s loser.
In a liquidity-driven market, investors should focus not on “growth sectors” alone, but on companies capable of defending a durable moat.
Investors who understand this distinction are likely to achieve materially different outcomes from those who do not.
12. Checklist Investors Should Review Immediately
-
Do I truly understand the company I own?
Business model, revenue drivers, competitors, technology trends, and customers should all be explainable.
-
Can management be trusted?
Capital allocation, shareholder orientation, and long-term strategy matter.
-
Is the moat still intact?
Determine whether the defense is based on technology, brand, cost, network effects, or regulation.
-
Is the valuation reasonable relative to intrinsic value?
Even good companies can be poor investments if purchased too expensively.
-
Do I have a mechanism to reduce confirmation bias?
Investors should regularly review opposing arguments and test whether their thesis has broken down.
-
Is the portfolio too concentrated or too fragmented?
Less experienced investors may need diversification, while more experienced investors may consider a concentrated portfolio of four to five core holdings.
-
Am I using leverage?
Leverage can increase returns in a liquidity-driven market, but it can also create unrecoverable losses.
13. Conclusion: A Liquidity-Driven Market Is an Opportunity, Not a License to Buy Anything
A liquidity-driven market can create opportunities for investors.
In particular, capital may flow strongly into areas such as the U.S. equity market, AI, semiconductors, technology stocks, and infrastructure-related industries.
However, liquidity can lift both strong and weak companies in the early stages.
Over time, only companies with durable moats, strong management, robust cash flow, and valuations supported by intrinsic value are likely to remain resilient.
Charlie Munger’s 4-step framework is therefore especially relevant.
Investors should first confirm that they understand the business, then evaluate the company and management, assess moat durability, and finally compare intrinsic value with price.
Above all, they must be willing to admit when they are wrong.
Investing is less a contest of knowing the most and more a process of surviving by recognizing one’s own mistakes.
< Summary >
Expectations for a late-September and October liquidity-driven market were based on easing geopolitical tensions and expansionary fiscal policy.
However, in an environment where monetary and fiscal policy move separately, investors must monitor sector-level liquidity rather than the market as a whole.
Charlie Munger’s 4-step framework consists of understanding the business, combining qualitative and quantitative analysis, identifying a durable moat, and comparing intrinsic value with price.
Concentration can be appropriate, but a single-stock bet is risky, and four to five core holdings is a more practical benchmark for most investors.
Frequent trading reduces returns, and investors should be cautious of FOMO and JOMO-driven behavior.
Failure to sell often reflects confirmation bias, and if opposing arguments cannot be rebutted, selling should be considered.
A liquidity-driven market is an opportunity, but it is not a market in which anything should be bought indiscriminately.
[Related Articles…]
*Source: [ 경제 읽어주는 남자(김광석TV) ]
– [풀버전] 유동성 장세 왔다고 아무거나 사면 안 됩니다… 찰리 멍거가 남긴 ‘4단계 투자법’ | 김광석의 북리뷰 | 찰리 멍거 바이블 완결판