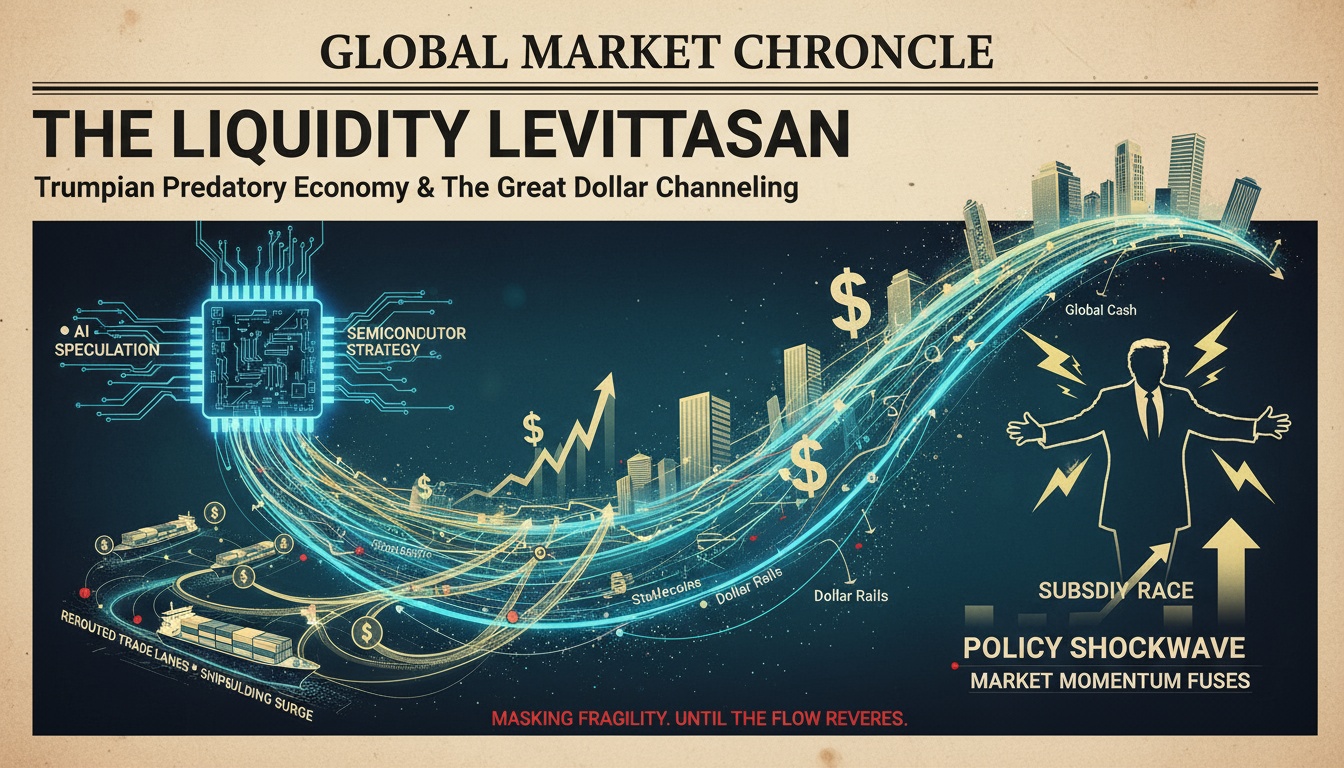
● 2026 Fragmentation Shock, Real Slump, Liquidity Surge
2026 Turning Point: Trump’s “Predatory Economy,” the Stablecoin War, European Fiscal Instability, China’s Liquidity Trap, Employment Shock and the Irony of Capital Markets
Key Takeaways from This Article
It summarizes the signals of a turning point in the global economic outlook like a news brief.
It explains why stocks and Bitcoin rally despite a real-economy slowdown and the trigger for a rate cut.
It discusses the geopolitical segmentation created by Trump-style tariffs and reshoring, and the mega-cycle of defense spending.
It outlines European “steepening” (widening of the long-term and short-term yield curve) following France’s credit rating downgrade and the ECB’s backstop.
It details the polarization in China’s old economy/new economy, the liquidity trap triggered by real estate, and deflationary pressures.
It covers the “mixed monetary policies” of the US and Japan after Jackson Hole and the risks of unwinding the yen carry trade.
It explains how the stablecoin war is becoming the “invisible infrastructure” of the 2026 liquidity market.
It provides a checklist for portfolio adjustments and risk dashboards that domestic investors and businesses need to update immediately.
News Summary: “The Real Economy Wobbles While Capital Dances”
-
Headline 1|Bad is Good, Renewed Expectations for Rate Cuts.
The US employment shock is bad for the economy but fuels expectations of rate cuts in the market, connecting to a rally in risk assets.
The simultaneous rise of stocks and Bitcoin confirms the “real slowdown → accommodative monetary/fiscal policy → liquidity market” formula. -
Headline 2|Geopolitical Risks Intensify, Shifting from Globalization to Segmentation.
Trump-style tariffs, retaliatory tariffs, pressures for investment attraction among allies, and reduced trade between blocs are becoming structural.
An upward revision in NATO defense spending (discussing a target from 2% to 5% of GDP) signals a long-term expansion in global demand for defense, energy, and cybersecurity. -
Headline 3|Europe’s Fiscal Instability Causes the Yield Curve to “Steepen.”
Following France’s credit rating downgrade, long-term government bond yields have plateaued.
The ECB’s TPI, which allows for unlimited purchase of member state bonds in the event of severe market disorder, serves as a final defense. -
Headline 4|China: The Old Economy Faces Excessive Debt and a Real Estate Slump; the New Economy Confronts Overproduction.
In the old economy, rising NPLs, tighter lending attitudes, and prolonged declines in real estate prices create a “liquidity trap.”
The new economy (electric vehicles, batteries, solar power) is challenged by oversupply and tariff barriers, squeezing profit margins and exporting deflation. -
Headline 5|Structural Changes in the Labor Market: AI Boosts Productivity vs. Changes in Job Quality.
The US Beveridge Curve signals a sharp drop in job vacancies with a gradual rise in unemployment.
In Japan, a “normalization” of wages and prices suggests potential for gradual rate hikes, with close attention to the risks of unwinding yen carry trades.
Geopolitical Segmentation: 2026 is the ‘Turning Point’
-
Key Points
The engine of globalization—the ratio of trade to GDP—is slowing.
Tariffs, protection of national champions, and supply chain reconfigurations are increasing intra-bloc trade concentration while constant friction persists between blocs.
Geopolitics, entwined with defense, energy, and data regulations, will influence growth and capital flows. -
Investment/Industrial Implications
Defense, energy security (gas storage, nuclear power, LNG), semiconductor equipment, cybersecurity, and border taxes (carbon border adjustments) are likely to benefit.
For South Korea, which is highly reliant on exports, diversifying markets and supply chains is a survival strategy for growth.
The Return Scenario of Trump-Style “Predatory Economy”
-
Mechanism
Imposition of high tariffs → conditional tariff reductions to spur domestic investment and employment in the US → hardline application to allied countries.
As the binding power of WTO/FTA rules weakens, realignment based on practical alliances will accelerate. -
Checkpoints
The expansion of US tariff schedules and scope of products, direct investment conditions imposed on allies, and provisions for subsidy recoupment.
For South Korea, localizing assembly/components/materials in North America and optimizing tax and IRA/CHIPS linkages are defensive measures.
Europe: Fiscal Instability as “Slow Sinking” Rather Than a ‘Crisis’
-
Current Position
France has maintained expansionary fiscal policies even after the pandemic, with a persistent rise in its debt-to-GDP ratio.
The downgrade has led to a widening long-term yield premium, increased borrowing costs for companies and households, and diminished growth potential. -
Why a Crisis Transition is Limited
A strong backstop exists in the form of the ECB’s TPI.
The Eurozone has already established a political and institutional framework of solidarity. -
Nonetheless
The widening “growth–interest rate” gap stemming from low growth, high debt, and high borrowing costs remains.
There is increased political uncertainty within Europe over “austerity vs. expansion.”
China: ‘Liquidity Trap’ and Industrial Polarization
-
Old Economy
Long-term declines in real estate prices, burdens from PF and local government bonds, and tighter bank lending attitudes.
Despite expansion of the money supply and rate cuts, weak real economic recovery exemplifies a typical liquidity trap. -
New Economy
A surge in the number of companies in electric vehicles, batteries, solar power, and telecom equipment is leading to oversupply and global margin compression due to tariff barriers.
Should exports to the US be blocked, a shift towards the EU and global South is expected, though tariff and regulatory barriers remain constant. -
Prices and Growth
Negative PPI and tepid CPI indicate ongoing deflationary pressures.
Growth is nearing a “stalemate of low growth.”
Labor Market and Monetary Policy: Easing in the US, Normalization in Japan
-
United States
Cooling employment feeds into expectations for rate cuts (or accommodative policies), stimulating a liquidity-driven market.
AI adoption boosts total factor productivity (TFP), which partially offsets the downward shift in potential growth. -
Japan
Rising participation rates among women and seniors, along with a recovery in wage-price alignment, suggest room for gradual rate normalization.
A narrowing US-Japan interest rate differential increases volatility risks associated with unwinding the yen carry trade. -
Eurozone
Economic sluggishness, inter-industry imbalances in wage increases, and a slowdown in total working hours.
While easing may resume quickly, fiscal constraints limit the pace of the recovery.
The Stablecoin War: The ‘Invisible Piping’ of the 2026 Liquidity Market
-
Why It Matters
Stablecoins connect dollar yields and US Treasury returns to on-chain activities, serving as a global “quasi-settlement rail.”
An increase in supply (market capitalization) acts as a leading indicator for dollar liquidity, stimulating beta in risk assets. -
Policy and Regulatory Developments
US stablecoin legislation, EU MiCA, and Asian payment regulations are expected to solidify the rules for an “institution-grade on-chain money market.”
The roles of CBDCs and private stablecoins are crossing paths and expanding concurrently. -
Practical Points
Key indicators to monitor include stablecoin market capitalization, the scale of on-chain T-bill tokens (asset tokenization), and growth in exchange off-chain holdings as the “shadow of liquidity.”
In a rate cut phase, a decline in on-chain money market yields can lead to a rapid flow of funds into risk assets.
Market and Business Strategies: The Checklist You Must Update Now
-
Portfolio
Gradually increase exposure to defense, cybersecurity, energy infrastructure, and strategic resources (uranium/copper).
Focus on AI infrastructure (data center power, cooling, optical modules, HPC components) and software subscription-based cash flows.
Manage exposure to yen carry trade volatility by hedging with a mix of dollars and yen and managing duration (a blend of long and short-term). -
Strategies for Korean Companies
Diversify revenue channels across the US, EU, India, and ASEAN.
Localize operations in North America (assembly/components) and optimize costs and taxation based on FTA/IRA/CBAM rules.
For SMEs, internalizing generative AI reduces labor and time investment, improving per-unit economics. -
Risk Dashboard (Bookmark Recommendations)
The NATO defense spending roadmap and various national budget amendments.
Timelines for US tariff, subsidy hearings/administrative orders.
The spread on French OATs, the degree of yield curve steepening in the Eurozone.
China’s PPI–CPI gap, real estate price index, and lending attitude index.
US JOLTS, the Beveridge Curve, stablecoin market capitalization, and on-chain T-bill scale.
The Most Important Point Often Overlooked Elsewhere
-
The triple combination of “tariff war x defense spending cycle x stablecoin rails” will ultimately determine the direction of 2026’s liquidity.
Although tariffs slow down the real economy and trade, defense spending, subsidies, and tax credits supply fiscal liquidity.
As this capital circulates simultaneously through government bonds, banks, and on-chain rails, it creates a “detour inflow” into risk assets.
Stablecoins/asset tokenization increase the perceived speed at which liquidity moves outside the central banks’ balance sheets. -
“Crises are Slow”: With measures like the ECB’s TPI, US fiscal policies, and Japan’s normalization, a “hard crash” is unlikely; instead, a scenario of long-term low growth and high volatility prevails.
Thus, asset allocation centered on “resilience” and “cash flow” becomes more decisive than timing.
Timeline Guide (Summary)
- Second Half of 2025: Confirmation of softening US employment and inflation strengthens the base case for rate cuts, with stablecoin market capitalization exhibiting sensitive reactions.
- 2025~2026: Expansion of tariffs and reshoring policies, upward revisions in defense budgets, and increased volatility during European rating event seasons.
- 2026: A coexistence of a liquidity rally driven by accommodative policies and regulatory clashes between blocs, with sector and regional diversification being key risk factors.
Conclusion
- 2026 is the year when the “halt of globalization” paradoxically accelerates capital flows.
- Structural growth deceleration is more profound than inflation, and rate cuts will direct liquidity.
- In an era of segmentation, the answer is to monitor both defense, energy, and AI infrastructure alongside on-chain liquidity indicators while managing export, policy, and exchange rate risks on all fronts.
< Summary >
- The real economy slows while expectations for rate cuts trigger a rally in risk assets.
- Trump-style tariffs and pressure for investment within alliances deepen segmentation, expanding demand in defense and energy.
- Europe continues its “steepening” due to fiscal instability, with the ECB backstop limiting rapid shifts.
- China faces a liquidity trap sparked by a real estate slump alongside oversupply in the new economy, exerting deflationary pressure.
- Divergent trends with US accommodative policy versus Japan’s normalization increase risks related to unwinding the yen carry trade.
- Stablecoins/asset tokenization serve as the invisible conduit of 2026’s liquidity, making them essential indicators to monitor.
[Related Articles…]
- Investment Strategy in the Age of Segmentation: Rebalancing with Defense, Energy, and AI
- The Timing of the Next Rally Indicated by Stablecoin Market Capitalization
*Source: [ 경제 읽어주는 남자(김광석TV) ]
– [모아보기] “실물은 무너지고 자본은 흥청댄다” 트럼프식 약탈경제의 귀환, 세계경제 분절점에 도달한다
● IMF Shock, AI Supercycle, Volatility Flashpoint
IMF Warning vs. Ives’s ‘96 Phase Diagnosis|The Reality of the AI Rally, Volatility Triggers, and a Complete Guide to Investment Strategies
This article includes the following: the market-moving triggers from the IMF Financial Stability Report (Chapter 1), the volatility mechanism of VIX and CTA algorithmic trading, the core meaning behind Ives’s ‘1996’ analogy, the signals that AI infrastructure, power, and HBM bottlenecks send to the semiconductor supercycle, the actual pathways through which tariffs, interest rates, and inflation affect the US stock market, and even a practical position guide that can be used immediately.
It is arranged in a sequence of news-style summaries → in-depth explanations → strategies so that you can see the key points all at once and respond quickly.
It also reflects SEO optimization centered on keywords such as the US stock market, interest rates, inflation, recession, and the semiconductor supercycle.
News Briefing: Fact-Checking the Market-Moving Events This Week
- The IMF Managing Director has reiterated the warning that “valuations are heading towards the level of the dot-com bubble (about 25 years ago),” and the IMF Financial Stability Report (FSR) is scheduled for release next Tuesday.
- In particular, when Chapter 1 (Challenges to Financial Market Stability) is published, expressions such as “liquidity crunch” and “transfer of emerging market foreign currency debt” could trigger mechanical selling by VIX and CTA algorithms.
- Recently, with short-term volatility rising due to confusion over employment and inflation data and uncertainty regarding tariff policies, there is also talk that the short side might use the IMF as a trigger.
- On the other hand, bull proponent Dan Ives stated, “We are not in the immediate collapse of 1999 but rather in 1996, the early phase of internet spread,” forecasting further gains led by AI and big tech.
- Ives has identified winners such as Nvidia, Microsoft, Alphabet, Amazon, Meta, and Palantir, interpreting the simultaneous investment by Nvidia and AMD in OpenAI as a signal of an “acceleration in AI infrastructure investment.”
In-Depth Explanation 1: ‘96 vs. ‘99 – The Quality of This Rally Is Different
- Change in the Quality of Earnings
In 1999, user traffic and revenue expectations drove valuations, but now, real CAPEX including AI infrastructure, cloud, optical, and power equipment accompanies the trend.
The fact that the cash flows and operating profits of major tech companies actually support AI investments makes the difference. - Cost of Capital and Interest Rate Environment
As interest rates rise, weak growth stocks are being avoided, and there is a stronger focus on earnings and cash generation.
Although the premium must be reduced under the current interest rate regime, expectations of productivity improvements cushion the multiple downturn. - Infrastructure Bottlenecks and Realistic Constraints
There exist bottlenecks in power (Power Purchase Agreements and transmission), memory (HBM), packaging (CoWoS), and optics (800G/1.6T), which create an “investment sequence” rather than unbridled overheating.
These constraints could prolong the cycle and enhance the sustainability of the semiconductor supercycle.
In-Depth Explanation 2: The Sentences in the IMF Financial Stability Report That the Market Will Actually Be Watching
- Liquidity and Shadow Banking (NBFI) Risks
If mentions of money market funds, prime brokers, or hedge fund credit and leverage become stronger, algorithmic de-risking based on CTA and VaR could occur. - Dollar and Emerging Market Transmission Pathways
When phrases like “a stronger dollar and maturing foreign currency debt” become pronounced, it may lead to an expansion of EM spreads → a global risk-off situation. - Systemic Risk Trigger Words
If expressions such as “rapid liquidity crunch” or “potential evolution into systemic risk” appear, they could trigger algorithmic selling purely based on the headline. - Market Defense Lines
If the VIX remains above 25, accompanied by a sharp widening of HY OAS and a jump in the dollar index, it can be interpreted as a signal of a transition to a volatility regime.
Macro Five Levers: Interest Rates, Inflation, the Dollar, Tariffs, and Credit
- Interest Rates
If the peak of interest rates is recognized in advance, the duration pressure on growth stocks will ease.
However, during the process of unwinding the inversion of the short-long rate spread, credit re-pricing could accompany volatility. - Inflation
If wages, housing costs, energy, and tariffs stimulate a re-rising trend, the timing for the Fed’s easing could be delayed.
Sticky service sector inflation can also curb multiple expansions. - Dollar Liquidity
A stronger dollar tightens liquidity in emerging markets as well as in commodities and crypto assets.
A shift to a weaker dollar is a prerequisite for a risk-on recovery. - Tariffs and Policy Uncertainty
Tariff hikes lead not just to an increase in import prices → CPI → interest rate impact, but also exert dual pressure on real economic and stock market valuations. - Credit Spreads
An expansion of HY and BBB spreads acts as a “confirmation” signal for stock declines, while stable spreads can help confirm the bottom.
Deep Dive into the AI Trend: The Actual Flow of Money from Infrastructure to Models to Applications
- Infrastructure Side
CAPEX is at the forefront with investments in GPU/HBM packaging, expanding high-bandwidth memory, 800G/1.6T optical modules and switching, and new construction of data centers for power conversion and cooling.
Power and transmission bottlenecks determine the pace of AI data center expansion, and securing power contracts (PPAs) is crucial for success. - Models and Platforms
OpenAI’s investment in both Nvidia and AMD indicates a dual-sourced compute stack that diversifies procurement risks and ensures supply resilience.
Multisourcing the engine enhances bargaining power over pricing and drives down future TCO. - Applications and Monetization
RAG, agent-based, and copilot-style productivity tools are increasing enterprise penetration, boosting subscription ARPU and promoting workload shifts.
As the inference cost curve steepens downwards, the adoption of edge AI and AI PCs accelerates, accompanied by a surge in demand for security and data governance.
Seven Key Points Often Not Mentioned Elsewhere
- Power bottlenecks dictate the top end of multiples. Securing PPAs and transmission capacity is essentially the condition for a valuation premium.
- HBM expansion is directly linked to process miniaturization and yield, meaning that the equipment and material chain has greater leverage than memory price elasticity.
- Packaging (CoWoS/Foveros) capacity becomes the true ceiling for AI server shipments.
- The downward curve of inference TCO breaks the “bigger model = skyrocketing costs” formula, accelerating the mass adoption of smaller, domain-specific models.
- Data quality, governance, and security are the bottlenecks for AI ROI. Compliance costs can determine competitive advantages.
- Tariffs do not only raise basic costs but also stimulate service inflation through supply chain reconfiguration and the pass-through of intermediate goods prices.
- The Russell 2000 is sensitive to real interest rates, wages, and borrowing costs, making it an effective “early warning” indicator for cyclical domestic demand.
Scenarios and Strategies: What to Do Amidst Volatility
- Scenario A: Continued Expansion in the Style of ‘96
If the tone of the IMF is neutral, inflation gradually eases, and big tech earnings remain robust, a trend recovery centered on technology and the semiconductor supercycle is expected.
Strategy: Increase the weight of leaders (Nvidia/top semiconductor equipment/cloud) during corrections, and include power, optics, and the HBM chain simultaneously. - Scenario B: A Volatile Range Market
If the IMF adopts a conservative tone with tariff noise, resulting in a VIX box in the 22–28 range.
Strategy: Maintain a core long position + hedge with call/put spreads, take incremental positions in oversold items, and rebalance away from non-core growth stocks that are overvalued or lack earnings clarity. - Scenario C: Short-Term Risk Off
If a strong tone of “systemic risk” is coupled with a rapid widening of the HY OAS, leading to de-risking.
Strategy: Increase cash positions, hold short-term government bonds, protect on the downside by buying volatility (VIX calls), and retain only big tech companies with high-quality credits and strong cash flows.
Trading Checklist: 9 Signals to Check This Week
- The intensity of phrases related to “liquidity” and “leverage” in Chapter 1 of the IMF Financial Stability Report.
- Whether the VIX remains above 25 and if the futures curve switches to backwardation.
- The simultaneous rise of HY OAS and the dollar index.
- Order book updates for the semiconductor equipment, HBM, and optical chains.
- The AI revenue proportion and CAPEX guidance in mega-cap earnings releases.
- Updates on CAPEX/transmission investment plans for power companies.
- The frequency of policy headlines related to tariffs and trade risks.
- Changes in the relative strength trends between the Russell 2000 and the Nasdaq.
- The correlation changes between Bitcoin/Ethereum and liquidity indicators (dollar/real interest rates).
Position Guide: Tangible Actions
- Core: Maintain core positions in big tech and the semiconductor supercycle (design companies, HBM, packaging, optics, power infrastructure) proven by productivity.
- Satellite: For data security, governance, RAG solutions, and AI PC/edge-related stocks, a staggered approach is effective.
- Hedge: When the VIX falls below 20, protection costs are low, and when it exceeds 25, manage through rolling; around key events, optimize costs with put spreads and call calendars.
- Risk Management: Reduce exposure to weak-growth stocks with uncertain earnings and fragile cash flows during recoveries, and increase cash and short-term bonds when credit spreads widen.
One-Line Conclusion
- The essence of this correction is less about a “bubble collapse” and more about a re-pricing that reflects policy, power, and component bottlenecks.
- Although a few sentences in the IMF report may significantly amplify short-term volatility, the structurally supported AI-centric rally underpinned by earnings and CAPEX remains valid.
- It is rational to systematically widen opportunities in the winner-heavy phase by managing risks with numbers and checklists.
< Summary >
- The intensity of the language in the IMF Financial Stability Report (Chapter 1) could serve as a switch for short-term volatility.
- Ives’s ‘96 argument emphasizes a rally based on AI infrastructure CAPEX and cash flows.
- Volatility increases when tariffs, interest rates, the dollar, and credit move in tandem, so keep an eye on VIX, HY OAS, and the dollar index as key indicators.
- Power, HBM, packaging, and optical bottlenecks could turn the semiconductor supercycle into a “long and resilient” cycle.
- A combined strategy of core long positions (big tech and semiconductor chains) with low-cost hedging currently forms an optimized base strategy.
[Related Articles…]
5 Volatility Scenarios That Could Be Triggered by the IMF Financial Stability Report
Semiconductor Supercycle and AI Capex: The Investment Checklist for 2025
*Source: [ Maeil Business Newspaper ]
– [홍장원의 불앤베어] 강세론자 아이브스 “지금은 99년 아닌 96년 국면”
● Korea Shipbuilding Supercycle – US Reliance, Green Order Boom, AI Supercharge
“If You Have 100 Million Won, Start with This Sector” South Korea’s Shipbuilding and Defense Transformation: US Dependence, Eco-Friendly Replacement Cycle, and Shipbuilding Redefined by AI
Why will South Korean shipbuilding produce the strongest beta in the current global economic cycle?
Why is it that the United States ultimately has no choice but to rely on South Korea?
How will the October earnings season and the 2025 eco-friendly vessel order peak create earnings surprises?
What is the real significance behind the discussions of the HD Hyundai Heavy Industries–Mipo merger and the review of US shipyard hubs?
And why are “replacement demand” and “AI shipbuilding” the final puzzles for the stock repricing that conventional news outlets are missing?
A concise news-style summary of the essentials, with distinct points that others do not cover separately.
[Today’s Key Briefing] Four Focus Areas in Shipbuilding & Defense
- Point 1. The gap in US shipbuilding capability is widening, and Korea’s dependency in defense, repair, and design is structurally increasing.
- Point 2. The simultaneous momentum created by the October earnings season (performance) and the 2025 eco-friendly vessel orders is expected to accelerate a virtuous cycle from orders → sales → profit.
- Point 3. Discussions of the HD Hyundai Heavy Industries–Mipo merger and review of US production hubs are strategic moves to reduce cost, delivery, and political risks simultaneously.
- Point 4. The essence of the next cycle is ‘replacement demand.’ The large-scale replacement of warships, tankers, and LNG carriers will upgrade the revenue structure.
US Shipbuilding Capabilities and South Korea’s Role: Why “Borrowing a Hand” Is Structural
- Workforce and Facility Shortages. The United States has lost its competitiveness in the newbuilding commercial vessel market over decades, and even military logistics and repairs are often delayed.
- Institutional Constraints. Regulations such as the Jones Act limit the introduction of foreign-built vessels, necessitating the establishment of local bases in the US.
- South Korea’s Strengths. South Korea is overwhelmingly superior in high-value vessel design, sea trials, quality, and delivery management.
- Practical Solution. Korean shipbuilders are well-positioned to lead with a hybrid model where they supply design, critical blocks, and systems, while final assembly and delivery are handled at a local US shipyard (or through acquisition/joint ventures).
October Earnings Season and 2025 Eco-Friendly Orders: A Structure Where Performance Truly Improves
- Price and Mix Effects. Contract prices for high-value LNG, large container, product tankers, and crude oil carriers have structurally increased since the pandemic.
- Upgraded Order Backlog. With average backlogs spanning 2.5 to 3.5 years, the price increases will be sequentially reflected in sales and profits.
- Eco-Friendly Regulations. With IMO 2030/2050 decarbonization, EU ETS (2024), and FuelEU Maritime (2025), orders for dual-fuel (methanol, ammonia, LNG) vessels are expanding.
- Financial Environment. Even with higher interest rates, essential replacement and regulatory response demand are not very sensitive, being absorbed by national projects, long-term borrowings, and lease structures.
- Conclusion. The October performance season is a period to verify the reflection of order wins and price increases, while 2025 holds potential upsides as eco-friendly ships ramp up.
HD Hyundai Heavy Industries–Mipo Merger Discussions and US Hub Review: Why They Are Flagship Stock Logic
- Merger Synergy. Integrating the medium-sized (Mipo) and large-sized (Hyundai Heavy Industries) portfolios improves efficiency in docks, workforce, and material procurement.
- Cost Structure. Standardizing platforms, engines, and equipment reduces production lead time and defect rates, thereby improving operating margins.
- Order Responsiveness. Simultaneous handling of large tankers/gas carriers and medium-sized MR/chemical tankers reduces cycle volatility.
- US Hub. Processing some local MRO and newbuilding activities in the US reduces regulatory and political risks while practically accessing US Navy, Coast Guard, and commercial vessel demand.
- Checkpoint. The key is whether inefficiencies such as labor costs and low-efficiency facilities can be offset through technological standardization and modularization.
The Essence of New Revenue Momentum: The Big Cycle of ‘Replacement Demand’
- Warships and Auxiliary Vessels. Fleet modernization and the alleviation of maintenance backlogs are expected to drive simultaneous growth in both new orders and MRO.
- Tankers. Due to sanctions, aging, and carbon regulations, replacement orders are increasing, and strong price support is evident in segments where allied carriers’ finances have improved.
- LNG Carriers. Energy security coupled with the energy transition leads to capacity expansion, and technological barriers give South Korea a high market share.
- Container and Bulk Carriers. There is a high possibility that selective orders will continue, driven by eco-friendly replacement demand.
China May Be 20% Cheaper, But South Korea Still Wins in High-Value
- Price Competition. Although China has lower costs, South Korea is ahead in areas such as dual-fuel (methanol, ammonia, LNG), low vibration/noise, and autonomous navigation.
- Delivery Reliability. In ultra-large, high-specification projects, adherence to delivery schedules and quality assurance are the most valued by ship owners.
- Strategic Position. South Korea maintains a premium in high-value, eco-friendly, defense, and MRO sectors, whereas China focuses mostly on bulk and standard commercial vessels.
Portfolio Strategy Scenarios: Approach and Checklist
- Approach. A strategy that constructs a basket comprising large-cap shipbuilders (integrated platform) + specialized medium-sized vessels + equipment (engines, tanks, valves, ammonia/methanol solutions) is effective.
- Timing. Consider a phased-in approach during the October performance confirmation period, and then increase allocation with the 2025 eco-friendly order news flow.
- Checklist. Regularly monitor the price index, order backlog, exchange rate (KRW to USD), steel prices, shipping company FCF, defense budgets, and IMO/EU regulatory calendars.
- Caution. This is sector-focused information rather than individual stock buy recommendations. Risk management and diversification are fundamental.
Risk Map: High Interest Rates, Costs, and Political Risks
- Interest Rates. Rising ship financing costs may delay orders; however, the impact on regulatory response and replacement demand is expected to be limited.
- Raw Materials & Steel. Fluctuating input costs affect margins, so it is important to check for hedging and long-term contract arrangements.
- Exchange Rate. Although a weaker KRW is positive for short-term performance, it is accompanied by risks of increased import costs for equipment and a slowdown in the shipping market.
- Political & Regulatory. Factors such as the US presidential election, Chinese sanctions, US-China competition, and changes in the pace of the energy transition can impact the order mix.
AI and the Fourth Industrial Revolution Trends: “AI Shipbuilding” Rewrites Valuation
- Automated Design. AI accelerates linear design, layout optimization, and fluid dynamics simulations to reduce costs and lead times.
- Smart Yard. Digital twins, robotic welding, computer vision quality inspections, and predictive maintenance decrease defect rates and rework.
- Navigation and Operational Optimization. Edge AI enables real-time fuel consumption management, optimal route planning, and vessel condition monitoring, reducing total cost of ownership for ship owners.
- Eco-Friendly Fuel Stack. Sensor and control AI integrated with methanol/ammonia propulsion systems enhance safety and efficiency.
- Investment Focus. The value chain for equipment and software—including AI, digital twins, autonomous navigation, DF engines, and fuel supply systems—is entering a leverage phase.
[Two Truly Important Points Others Rarely Cover]
- Key 1. What moves stock prices is not just the orders, but the margin structure changes driven by order mix shifts. Even with a single vessel, an increased proportion of DF, LNG, defense, or MRO segments boosts both EBIT margins and valuation multiples.
- Key 2. A US hub is not merely a political option to secure orders, but an operational solution that simultaneously reduces risks related to delivery, quality, and regulations. By splitting design and key blocks in Korea and final delivery in the US, cost increases can be offset through standardization and modularization.
Timeline & Checkpoints: From Now Until the First Half of Next Year
- October. Verify the reflection of price increases and margin recovery in the earnings season.
- Q4. Visibility of the 2025 eco-friendly orders and updates to shipping companies’ CapEx plans.
- First Half 2025. A rush in orders by ship owners ahead of the full implementation of EU FuelEU, and tightening supply of DF equipment.
- Ongoing. Monitor defense budget approvals, US shipyard partnerships/investment news, and trends in exchange rates and steel prices.
Macro Context: Global Economy, Interest Rates, Inflation, US-China Competition, Energy Transition
- Even in a phase of global economic slowdown, energy security and regulatory response demand remain resilient.
- Persistently high interest rates (“Higher for longer”) adjust order timing, but national projects and long-term lease structures provide cushioning.
- In an inflationary environment, escalation clauses or raw material-linked pricing are key rather than long-term fixed-price contracts.
- US-China competition reinforces supply chain decoupling, strengthening South Korea’s position as a “trusted high-value partner.”
- The energy transition provides structural demand for LNG, methanol, and ammonia-based eco-friendly vessels and related equipment.
Conclusion: The Simultaneous Operation of Sector Beta and Quality Premium
- Replacement demand, eco-friendly regulations, US reliance, and AI-based smart yards are all converging simultaneously.
- A basket approach incorporating large-sized shipbuilders + specialized medium-sized vessels + the equipment value chain is efficient in terms of risk versus reward.
- Verify the dual-track momentum of performance (October) and regulatory drivers (2025), while continuously monitoring risks in exchange rates, steel prices, and interest rates.
< Summary >
- South Korean shipbuilding strengthens its structural advantage in high-value, eco-friendly, defense, and MRO sectors.
- The October earnings season and 2025 eco-friendly orders will serve as checkpoints for profit level upgrades.
- The US hub strategy is a core card for both winning orders and managing risks.
- The next cycle’s essence is ‘replacement demand’ and ‘AI shipbuilding,’ offering significant potential for valuation repricing.
- Approach with a basket strategy while monitoring macro variables such as interest rates, inflation, US-China competition, and the energy transition.
[Related Articles…]
- South Korea’s Dual Momentum in Defense & Eco-Friendly Amid Growing US Dependence
- IMO and EU Regulations Pave the Way for a Grand Outlook on Methanol/Ammonia Vessels
*Source: [ 달란트투자 ]
– 1억 있다면 ‘이 주식부터’ 사라. 곧 상상 이상의 일 벌어진다 | 엄경아 연구위원 풀버전