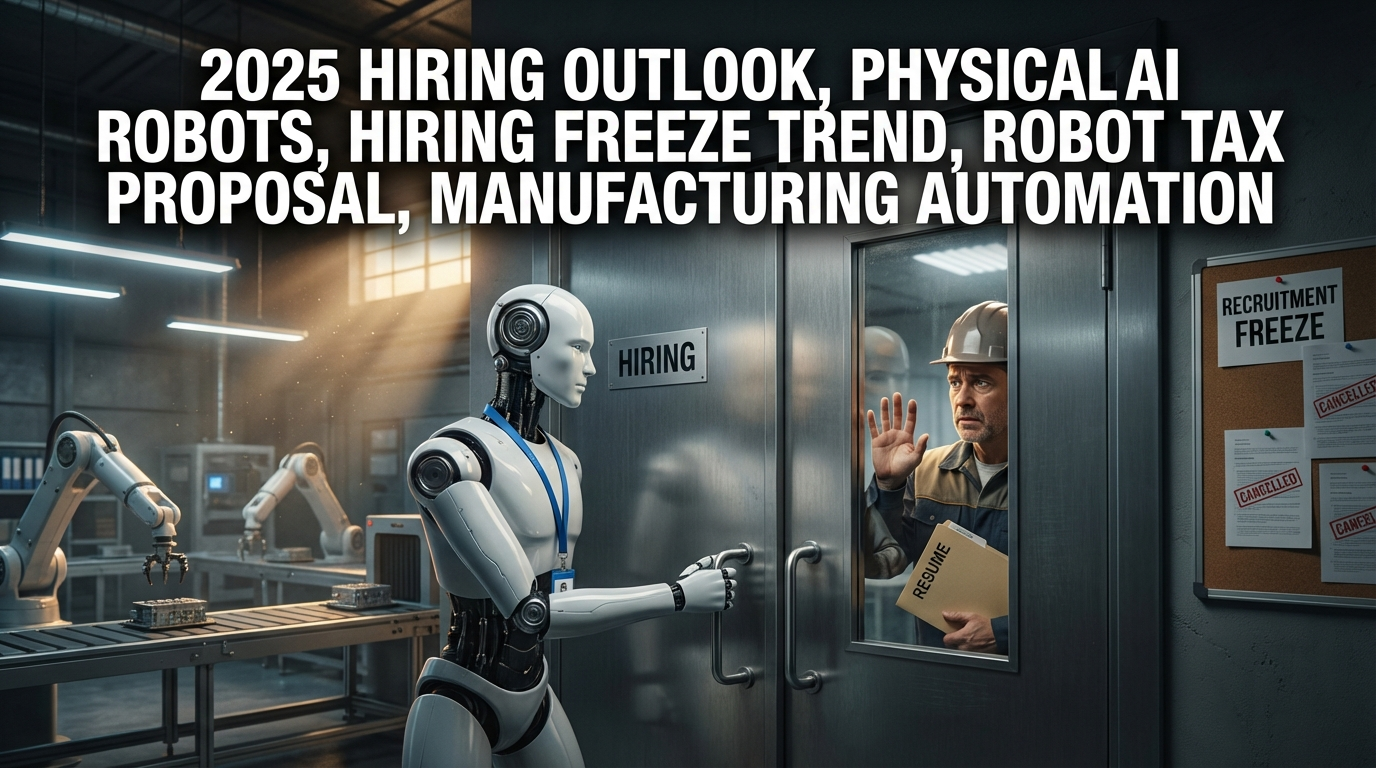
● Altmans Fox Strategy Sparks 30GW AI Data Center Arms Race, 1 Trillion Gamble
The Truth about AI Big Deals: 30GW Data Centers, Trillion-Dollar Capital, and an Analysis of Sam Altman’s ‘Fox Strategy’
This article contains exactly three things.
1) The actual structure and numbers behind the 30GW data center deals in just six months.
2) The ‘real’ bottlenecks such as power/grid/interest rate variables and HBM bottlenecks that are rarely covered elsewhere.
3) A timeline summarizing in a news-style format who pressured whom and expanded the deal, revealing Sam Altman’s negotiation playbook.
It provides an all-in-one overview of how the AI infrastructure race, within the context of the global economic flow, is impacting inflation, interest rates, semiconductors, and the entire data center industry.
[Breaking News] 30GW Data Center Deal in 6 Months… The Chain Reaction Sparked by Altman’s ‘Fox Strategy’
The mega data center contracts surrounding OpenAI have accelerated dramatically within the past six months.
In terms of power, the deal amounts to approximately 30GW, with the estimated investment ranging from $600 billion to $800 billion (roughly 1,000 trillion Won).
According to reports from the Wall Street Journal (WSJ) and The Information, Sam Altman focused on maximizing computing power by inducing a ‘competitive alternative’ negotiation tactic with major tech companies and semiconductor partners.
Microsoft, Oracle, Nvidia, AMD, Broadcom, SoftBank, TSMC, and even Google TPU were used as ‘cards’, creating a competitive scenario where each party raced to promise large-scale data centers and chip supplies first.
OpenAI is said to have set an aggressive internal goal of 250GW computing capacity by 2033.
However, many agreements remain at the non-binding letter of intent/framework stage, and uncertainties about cash flow and profitability still persist.
Key Timeline: Who, When, and How Moved
In 2019, Altman’s ‘Theory of Success’ blog revealed an unwavering self-confidence combined with the ability to persuade others—a conviction that now underpins the current strategy.
After the launch of ChatGPT, OpenAI persuaded large-scale infrastructure investments with the narrative, “AI is the revenue source for breakthroughs in cancer treatment, personalized education, and corporate productivity.”
They proposed a mega investment akin to ‘Stargate’ to Microsoft, which initially responded cautiously.
By simultaneously contacting TSMC, Google, Oracle, SoftBank, and others, they emphasized the ‘alternative options.’
After mentioning a massive backlog order with Oracle, Microsoft reappeared by showcasing a “world’s most powerful AI data center” card at locations like Wisconsin in the USA.
Following The Information’s report on “Google TPU leasing,” Nvidia quickly reactivated its renegotiation channel, according to observations.
Nvidia, AMD, and Broadcom all aggressively proposed conditions to secure a ‘priority partnership’ status with OpenAI.
Most contracts remain mixed in terms of reservations, letters of intent, or framework agreements, and concrete execution depends on bottlenecks such as power, grid, packaging, and HBM.
Breaking Down the Numbers: The Identity of 30GW and $600-800 Billion
A 30GW data center power supply is comparable to that of dozens of massive gigafactories, and the total project cost for such data centers can vary greatly depending on wholesale power rates, PUE, cooling methods, land, and transmission conditions.
The oft-quoted $600-800 billion includes estimates that span the entire lifecycle—from land, power infrastructure, construction, power purchase agreements (PPA), networking, GPUs/ASICs, storage, HBM/packaging, to software.
The long-term goal of 250GW is on a scale comparable to the national power consumption of Germany, making it physically impossible without concurrent expansion of power markets and grids.
Some reports mention vendor financing in the form of discussions about the leasing of millions of GPUs, investment options, or loan guarantees.
This structure can be understood as the chip suppliers assisting with project financing while the customers repay via long-term usage fees.
However, if the suppliers guarantee the customers’ financing, their risk increases exponentially in the event of a demand downturn.
The Invisible Limits of Power and Grid: It’s Not a Data Center, It’s a ‘Power Project’
During periods of rising interest rates, the WACC for data center projects increases, causing a sharp rise in the total cost of ownership (TCO).
Inflation can extend lead times for transformers, switchgears, HV cables, and circuit breakers to between 80 and 120 weeks.
The interconnection queue for the grid is already near saturation in North America and Europe, and permits, environmental approvals, and reinforcement of transmission lines can take years.
Cooling shifts rapidly from air-cooling to immersion or liquid-cooling due to the limits of air-cooled systems, with water resource constraints and urban heat island regulations serving as key variables.
The practical solution is a combination of gas/renewable energy PPAs, SMRs (small modular reactors), energy storage systems (including long-duration storage), and on-site power generation, with regional tariff structures and regulatory flexibility ultimately determining profitability.
In short, achieving 250GW is not an ‘IT project’ but rather a ‘power infrastructure reorganization.’
The Real Bottleneck in the Supply Chain: It’s Not GPUs, It’s HBM and Packaging
The bottleneck lies more in advanced packaging capabilities like TSV-based HBM and CoWoS rather than the GPUs themselves.
HBM supply is controlled by the expansion speed, yield, and power efficiency improvements of companies like SK Hynix, Samsung Electronics, and Micron.
For CoWoS/packaging, capacity expansion by TSMC, increased substrate (substrate) production, and next-generation glass cores and advanced lithography are all interconnected.
This bottleneck upends the pricing, lead times, and performance roadmaps, directly pushing up both the total project cost of data centers and the cost per unit of model training and inference.
Therefore, the profit leverage in the semiconductor cycle reacts more sensitively to ‘HBM/packaging’ than to wafers.
The Real Issue of Profitability: Inference Cost Over Training
Large-scale model training is akin to an episodic CAPEX expense, but inference is a recurring cost that determines the margin structure.
Costs per token, latency (SLA), model size, compression, serving optimizations, and caching/kv-memory techniques all play a part in determining per-unit costs.
The adoption of enterprise solutions is slowed due to issues related to security, privacy, on-premises setups, and siloed data integration.
The profit curve hinges on the preemption of “high value-added workloads” and the cost innovation in “narrow or lightweight models.”
In other words, even if traffic increases, if cost per unit does not drop, cash flow will not follow suit.
Macro Variables: The Intersection of the Global Economy, Interest Rates, Inflation, and Industrial Policies
In a global economic slowdown, high interest rates delay the start and completion of data center projects and put upward pressure on PPA prices.
Inflation simultaneously drives up construction, equipment, and labor costs, prompting upward revisions of CAPEX.
Industrial policies (such as CHIPS, IRA, and European IPCEI) and tax credits create significant regional cost differences.
Reshoring of supply chains and geopolitical risks increase uncertainties in procuring semiconductor and power-related equipment.
Exchange rates and dollar liquidity directly affect global vendor financing and the costs of issuing project bonds.
Risk Checklist: 7 Things to Verify Immediately
1) Nature of the contract: Whether it is a binding commitment or merely a letter of intent/reservation.
2) Power source: How power risks are mitigated, whether through a specific PPA or on-site generation.
3) Grid permits: The schedule for interconnection and transmission permits and lead times for bottleneck equipment.
4) HBM/packaging: Supply contracts, expansion timelines, and long-term unit pricing.
5) Financial structure: The cyclical structure and liquidity risks associated with vendor financing or loan guarantees.
6) Technical roadmap: The cost curves of next-generation GPUs/ASICs and lightweight models.
7) Customer mix: The proportion of high value-added inference workloads and the stability of recurring revenues.
Investment Outlook: ‘Who Really Makes Money’
Power and Transmission: Transformers, cables, switchgears, HVDC, and distributed generation facilities.
Thermal and Cooling: Liquid/immersion cooling solutions, heat exchangers, cooling towers, and high-density racks.
Upstream Semiconductors: HBM, advanced packaging (CoWoS/FC-BGA), and substrates.
Foundries/OSAT: Beneficiaries of expanded packaging capacities.
Cloud/Colocation: Large data center REITs/leasing companies and businesses with high asset turnover.
From a Korean perspective: Leverage expansion for companies in semiconductors (HBM/packaging), power equipment, and communications infrastructure.
[Separate] ‘Really Important Points’ That Other Media Rarely Address
1) 250GW is impossible without a power grid overhaul.
It is not a data center, but a grid project.
2) HBM/packaging is the true bottleneck.
The schedule is determined more by packaging and substrates than by wafer expansion.
3) The double-edged sword of vendor financing.
If suppliers guarantee customer credit, their losses can multiply exponentially when the cycle reverses.
4) The decline in inference unit cost is key to profitability.
The competition in lightweight model and serving optimizations is pivotal to generating cash flow.
5) Sensitivity to interest rates and inflation.
Even a 100bp increase in WACC can add tens of billions of dollars to the TCO.
6) Regional disparities.
Success depends on power rates, policies, and the speed of obtaining transmission permits.
7) Water and heat regulations.
Restrictions on cooling water and heat dissipation can structurally change site selection.
Altman’s Negotiation Playbook: Forcing ‘Alternatives’ into Reality to Exert Pressure
The strategy fundamentally consists of three stages.
1) Overexpansion of Vision: Envisioning 250GW and mega data centers to stimulate imagination.
2) Multi-Party Pressure: Exposing ‘alternative possibilities’ simultaneously to Microsoft, Oracle, Nvidia, AMD, Broadcom, SoftBank, Google, and others.
3) Tangible Execution: Sending irreversible signals such as confirmed orders, secured land, power, and packaging reservations.
In this process, pride and FOMO on all sides act as catalysts accelerating capital procurement.
However, it should be remembered that most agreements remain at the letter of intent/reservation stage.
Disclaimer and Notice
This summary is an interpretation based on public reports, corporate announcements, and market rumors, and some figures and conditions may pertain only to letters of intent or framework stages rather than binding commitments.
Investment decisions are the responsibility of the individual, and this document is intended to assist in understanding global economic, semiconductor, and data center industry trends.
< Summary >
Altman induced a 30GW class data center deal through ‘competitive alternatives’ and expanded the play with a long-term goal of 250GW.
The real bottlenecks are the power grid, HBM, and packaging, while interest rates and inflation significantly impact the TCO.
Vendor financing and the potential for reduced inference unit costs will be the inflection points for future profitability.
Even though current stock prices have priced in expectations, the speed of actual project commencement, power, and packaging expansion will be crucial for turning around actual performance.
[Related Articles…]
The Winner of the HBM Frenzy: The 2025 Semiconductor Supply Chain Scenario
Data Center Power Wars: How Grid Expansion Will Dictate AI Growth
*Source: [ 내일은 투자왕 – 김단테 ]
– AI 대폭등장은 바로 여우짓에서 시작됐습니다.
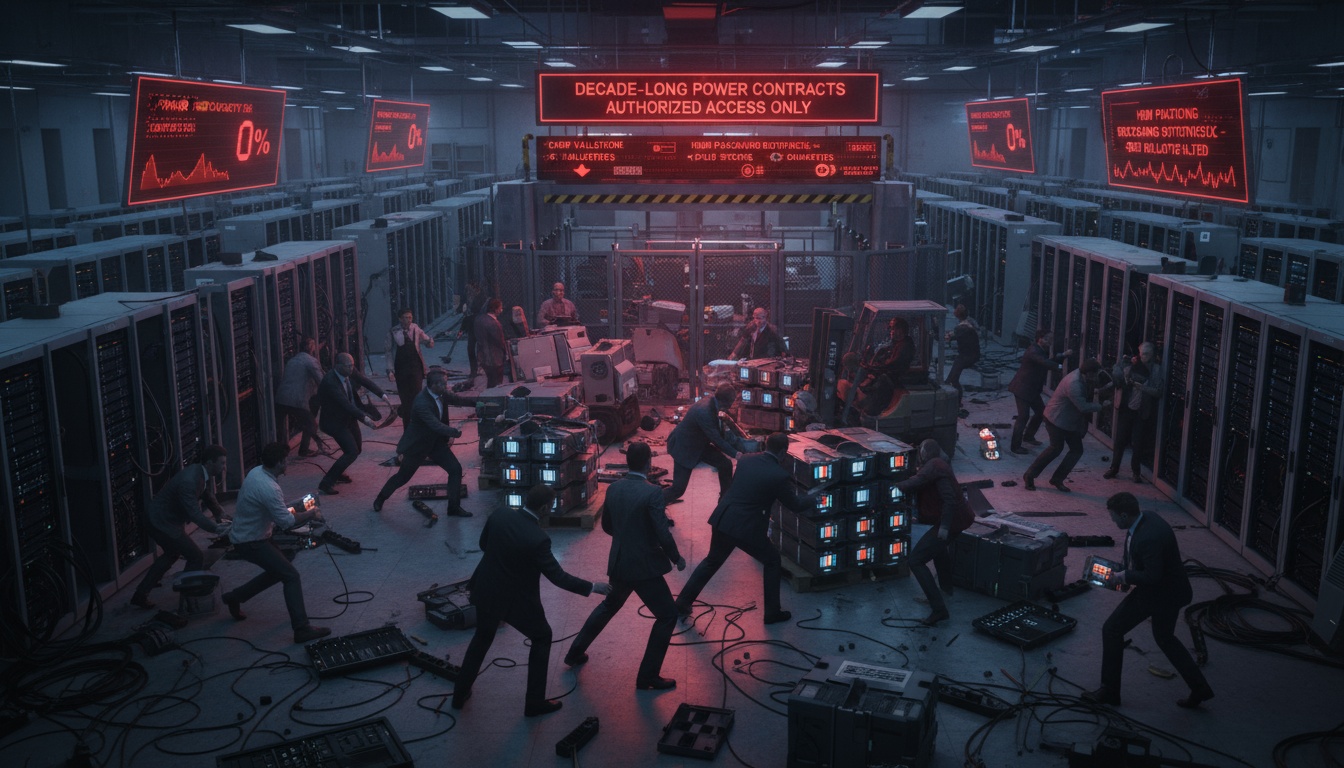
● Wall Street Panic-Buys Ignite AI Power War, Market Ticking Bomb
Wall Street’s “Panic Buying” Signal? A Comprehensive Review of the AI Infrastructure War and Power Battle, 2025 U.S. Market Checkpoint
This article covers the flow of funds from BlackRock and Goldman Sachs on Wall Street, the Trump administration’s “3% growth” narrative, the structure of the BlackRock coalition versus the OpenAI coalition, data center power bottlenecks and the alternative energy roadmap, as well as a practical investment checklist all in one.
It extracts only the core elements essential for viewing the global economic outlook and the U.S. market, and also includes separate summaries of often overlooked topics such as “bubble management strategies” and “the true battleground of power procurement.”
Key News Briefing: Flow of Money and Policy Signals
– Reports indicate that Wall Street’s money movement is accelerating rapidly toward AI investment infrastructure.
– According to market reports, BlackRock has embarked on acquiring a large portfolio of data centers, and some big tech companies are increasing their data center CAPEX through record capital raises via Wall Street.
– Goldman Sachs has reportedly established a dedicated team connecting VIP individual clients and private equity to AI infrastructure deals.
– On the policy front, the Treasury and the White House’s economic team are reiterating the message of maintaining “3% growth driven by AI productivity,” emphasizing a stance to counteract economic slowdown with “AI investments.”
– In short, policy is managing growth, capital is going all-in on infrastructure, and companies are responding by securing power and semiconductors.
Key Points Exclusive to This Article (Less mainstream but important observations)
– It appears plausible that policies are not aimed at avoiding a bubble altogether but rather at tolerating a “manageable bubble” to absorb fiscal and economic stresses.
– The ROI of a data center is determined not by GPU prices, but by “the unit price and timing of power contracts.”
– Direct channels for wealthy individual capital (private credit/structured deals) are opening up, thereby strengthening the alliance between institutions and ultra-high-net-worth individuals.
– In the power sector, dual tracks are being established with nuclear power plants requiring a 5-10 year lead time and fuel cells/ESS requiring a 3-12 month lead time.
– The structure has become highly interconnected: if “AI investments” slow down, both U.S. market momentum and growth rates might simultaneously waver.
Wall Street’s Almost Panic Buying Trend: A Full-Fledged Capital Battle
– Funds from asset management, investment banking, and private equity are simultaneously flowing into data centers, optical communications, cooling, and power assets (PPA, generators, transmission and distribution).
– BlackRock’s acquisition of a large data center portfolio and the record capital raises by major tech companies signal that we should view this as a “long-term CAPEX battle.”
– The report on Goldman Sachs establishing a dedicated desk signifies that the pipeline for ultra-wealthy client funds to flow directly into infrastructure deals has opened.
– This is likely to influence the style of the U.S. market as well.
Within growth stocks, platform/infrastructure plays that exhibit “cash flow + CAPEX leverage” are likely to command a premium.
Washington’s 3% Growth Narrative: Walking the Tightrope Between Inflation and Interest Rates
– The policy message is clear.
It is an approach aimed at elevating potential growth through “AI productivity” to allay market concerns over fiscal deficits.
– In this scenario, the trajectories of inflation and interest rates are key.
If productivity is indeed improved, it can help with disinflation, but initially, increased demand for power, construction, and equipment may pressure prices.
– If 10-year yields remain stable, maintaining multiples is possible; however, a rebound in interest rates may increase volatility in high-value sectors.
– In conclusion, while “AI investments” serve as a safeguard for the U.S. market and global economic outlook, balancing the price and interest rate cycles will be a key variable in 2025.
Realignment of Power: The BlackRock Coalition versus the OpenAI Coalition
– The market is discussing a dual-power structure comprising the BlackRock–Big Tech–Middle Eastern capital–power companies coalition and the OpenAI–foundry/capital pipeline coalition.
– In reality, it is a competitive yet cooperative “co-opetition” structure, where the battle comes down to who can secure financing, chips, power, land, and regulatory approvals faster and cheaper.
– The main takeaway is clear.
It requires a team play that integrates capital, chips, power, land, and regulations, and no single company can expand on its own.
Data Center Power Battle: Timeline of Bottlenecks and Solutions
– Immediate solutions (3-12 months): Fuel cells, industrial generators, ESS (battery energy storage), and on-site power generation without grid expansion are key.
– Mid-term solutions (1-3 years): Renewable energy PPAs, reinforcement of transmission networks, repowering of gas plants, and expansion of demand response (DR) contracts.
– Long-term solutions (5-10 years): Small modular reactors (SMRs), large-scale transmission and distribution investments, and new-generation cooling and water resource infrastructure.
– Some big tech and cloud companies are diversifying their “power portfolios” by expanding contracts with fuel cell and ESS firms.
– The key point is availability rather than cost.
Companies that secure fixed power at the required time will capture market share.
Semiconductor and Manufacturing Signals: Resetting U.S. Production and Supply Chains
– Expansions in cutting-edge chip production within the U.S., secured foundry orders, and increased backlogs for equipment companies are fundamental hints of the AI infrastructure cycle.
– Monitor whether foundries resume production in North America, whether fabless companies expand custom AI chip design, and whether equipment companies (e.g., lithography and inspection firms) continue to secure orders.
– The key is managing the triangle of “power + supply chain + lead time” rather than the chips themselves.
Sector Map and Investment Checklist (For Information)
– Semiconductors: Consider the chain comprising GPUs, accelerators, HBM, packaging, power semiconductors (SiC/GaN), equipment, testing, and materials.
– Data Centers: Co-location REITs, networking, optical communications, cooling, DC construction EPC, and rack/power equipment are beneficiaries, with power contracts being the alpha determinant.
– Power Infrastructure: The CAPEX cycles of PPAs, fuel cells, ESS, distributed generation, transmission and distribution assets, generator OEMs, and utilities are key.
– Software/Cloud: While models, agents, and RAG are important, the actual usage of cloud/AI workloads in the first half of 2025 will drive performance.
– Checklist: Track power procurement disclosures, CAPEX guidance, data center lease rate pass-through, semiconductor order volumes and lead times, interest rate trajectories, credit spreads, and land/permit progress.
– Reference ETFs (for diversification purposes, not a recommendation): Representative semiconductor ETFs such as SMH and SOXX can provide exposure to the AI investment cycle while mitigating individual risks.
Risk Scenario: “Growth Without AI” Remains Fragile
– Some academic analyses suggest that if the gap in AI investment widens, growth rates could sharply decelerate.
– Risks such as a rebound in interest rates, exacerbation of power and land bottlenecks, regulatory delays, recurrences of regional bank/credit events, and escalated U.S.-China tech tensions could trigger valuation deteriorations.
– Conversely, if power contracts are unlocked and productivity indicators actually improve, the probability of a “goldilocks” scenario with subdued inflation alongside growth is higher.
– If volatility increases, it is crucial to distinguish whether it is eroding the structural cycle or merely adjusting power/component lead times.
Practical Watch Points: 3 Numbers and 3 Events
– 3 Numbers: Power unit price (PPA/kWh), data center lease rate (rate adjustment on lease re-pricing), and HBM/packaging lead time (from order to delivery).
– 3 Events: Big tech CAPEX guidance, announcements of large-scale power contracts/on-site power generation, and fluctuations in semiconductor equipment company backlogs/orders.
– If this combination remains consistent, the AI investment cycle will continue to be a core driver of the U.S. market in 2025.
One-Line Summary: Why This Issue Is Critical Right Now
– Policies are effectively using AI infrastructure as an economic stabilization tool to maintain “3% growth,” and capital is responding by moving into physical infrastructure.
– The game’s victory will be determined not by chips but by “power + time,” where power contracts safeguard performance and performance defends valuations.
– Hence, the key term that connects the global economic outlook, the U.S. market, inflation, interest rates, and AI investments is “secured power.”
Disclaimer
– This document is for informational purposes only and is not investment advice.
– The mentioned companies and ETFs are provided as examples and are not recommendations to buy or sell any particular stock.
– Some content is based on recent reports and market opinions, and it is recommended that individuals conduct further research to verify the final details.
< Summary >
- Wall Street funds are shifting toward AI infrastructure, and policy focus is on maintaining “3% growth through AI.”
- The decisive factor is power rather than chips, with dual tracks favoring short lead-time fuel cells/ESS and long-term nuclear power.
- Key investment checkpoints include power contracts, CAPEX guidance, equipment backlogs, and interest rate/credit dynamics.
- Risks include a rebound in interest rates, power bottlenecks, and regulatory delays, while momentum remains closely tied to “AI investments.”
[Related Articles…]
- Comprehensive Review of AI Infrastructure Bubble Management Strategies
- Data Center Power Battle: ESS, Fuel Cells, and Nuclear Roadmaps
*Source: [ 소수몽키 ]
– 거물들마저 패닉 바잉 시작? 트럼프 최측근이 준 강력한 힌트
● Market Frenzy – GM Surges, Coke Energized, Rare Earths Explode, Pickup Reign
New York Open Key Points: GM’s Guidance Beats Expectations, Coca-Cola Expands Non-Alcoholic (Energy) Market Share, Rare Earth Supercycle Kicks Off, and America’s Best Seller is Still the ‘Pickup Truck’
Today’s article compresses four key points.
1) The implications for the automotive sector and the US stock market of GM’s raised guidance and signals of easing tariff burdens.
2) How Coca-Cola overcame global demand slowdown and inflation with its non-alcoholic/energy drink (Monster) strategy.
3) The real driving force behind the rare earth rally amid US-China tensions, criteria for distinguishing a bubble, and its impact on supply chains in AI, defense, and electric vehicles.
4) Why the best-selling vehicle in the US is a pickup truck, supported by numbers on taxation, depreciation, and margin structures.
Today’s Market Briefing: Mixed Start, Strong Earnings, Rotating Themes
The US stock market started mixed with a prevailing wait-and-see sentiment.
The Nasdaq dipped slightly, while the S&P 500 and Dow opened with strong consolidation as a stamina check period.
Expectations to end the US federal government shutdown have supported risk asset sentiment, and the Volatility Index (VIX) has stabilized at low levels.
Large tech stocks showed divergent performances by company.
Amazon was strong, while Nvidia and Tesla started weak, showing distinct differences.
GM surged on earnings surprise, and Coca-Cola was strong thanks to its robust non-alcoholic segment.
In contrast, Philip Morris showed weakness due to disappointing updates.
Gold prices began to catch their breath following reports of short-term overheating, and crypto is in a corrective phase after a recent rally.
Macro keywords such as the interest rate peak debate, the path to easing inflation, and supply chain restructuring continue to determine the market’s risk premium.
Corporate Focus: GM and Coca-Cola, “Earnings Overcome Debate”
GM: Both revenue and profit exceeded consensus, and the company raised its guidance for this year.
In management comments, a signal of “easing tariff burdens” was noted, which is significant from a macro perspective.
Non-US-China tariffs have diluted their impact on earnings, leaving US-China conflict management as the key issue.
However, risks remain from rising US auto loan delinquencies and demand slowdown, which could be downside factors for the 2025 sales outlook.
Coca-Cola: The robust growth in the energy drink segment (through its collaboration with Monster distribution and sales) in the non-alcoholic category drove earnings.
Even in an environment of global economic slowdown and inflation, it protected margins through its price-mix strategy and diversified portfolio.
With maintained annual guidance, there is confirmation of qualitative improvements in demand and margins.
RTX (defense) surged double digits on strong earnings, reaffirming the structural long-term trends of defense, aerospace, and engine demand.
Netflix is scheduled to report earnings after the market close, and it will be a checkpoint to see how the crackdown on ad and password sharing will affect subscriptions and ARPU.
Rare Earths: The Real Reason for the Rally, Sustainability, and Its Link to AI
What happened: China strengthened its export review of rare earth magnets, causing external shipments to plummet, while the US and Australia bolstered their mineral alliance, sparking explosive expectations for diversification of the supply chain in the West.
As a result, US- and Australia-listed rare earth-related stocks have soared in October, with some recording increases of several hundred percent year-to-date.
Why it matters: Rare earths are the “DNA” of modern technology.
They are widely used in high-performance magnets for EV motors, wind turbines, the F-35, radar, guidance systems, petroleum catalysts, semiconductor process equipment, MRI contrast agents, drones, space, and high-performance cooling fans and servomotors in AI data centers.
In other words, as the AI trend grows, the demand for power, heat management, and drive components increases, further elevating the strategic resource value of rare earths.
Structural Constraint: In every stage from mining, refining, alloying, magnet manufacturing, components to finished products, China’s dominance remains overwhelming.
It is difficult to replace 40 years of technological, environmental, and scale accumulation in a short time.
Policy Momentum: The US is expanding subsidies, off-take agreements, and loan guarantees for national defense and energy security reasons, and the financial sector is also backing project financing.
Investment Checklist: In the short term, the thematic market may continue to react sensitively to headline subsidy news and geopolitical issues.
However, for supply diversification, it is valid to focus on verifying the physical lead times along with vertical integration up to refining and magnets, as well as the speed of environmental permits and capex execution, especially in cases where some mining stocks appear overvalued relative to earnings (cash flow).
Automotive Sector: ‘Easing Tariff’ Signal vs. ‘Demand Slowdown’ Reality
Tariff Variable: GM’s comments indicate that the impact of tariff burdens on earnings has weakened, which is news that could partially resolve the sector’s multiple discount.
Demand Variable: The US auto loan delinquency rate is surging near cycle peaks, increasing the likelihood of demand adjustment by 2025.
Combined with resumed student loan repayments, pressures on disposable income are mounting, cumulatively increasing fatigue in durable goods demand.
Electric Vehicles: With reduced tax credits and stricter conditions, the elasticity of demand in North America could weaken, making price cuts and cost reduction efforts key.
AI/Autonomous Driving: While the value of software is rising, in the short term, performance still depends on “cars being sold” to generate numbers.
It is essential to check orders, incentives, and risk costs such as residual value of used cars as a complete package.
The Best-Selling Car in the US: Numbers Behind Pickup Trucks (Taxation, Depreciation, and Margins)
Sales Ranking: In the first half of the year, the top two sellers were Ford F-Series and Chevrolet Silverado, indicating that pickup trucks have maintained their throne.
Margin Structure: These representative models yield higher operating profits per unit compared to sedans, with some manufacturers generating about 70% of their operating profit from trucks.
Quality of Demand: The majority of purchases are by individuals, and pickup trucks have expanded into a “lifestyle platform” encompassing leisure, camping, and family vehicles.
Taxation (Section 179): Tax benefits such as expensing costs if used more than 50% for business purposes effectively support genuine demand.
Depreciation: The residual values after 5 years are superior to those of sedans, making them attractive from an investor asset perspective.
Electric Pickups: New models like the Cybertruck are incorporating the trend towards electrification in the pickup category, simultaneously expanding testing in commercial and government procurement markets.
Market and Macro Check: Interest Rates, Inflation, and Sector Rotation
Interest Rates: The stalemate between the Federal Reserve’s prolonged period of high rates and signs of economic slowdown continues.
Inflation: Although service price stickiness persists, headlines are subdued by product disinflation and supply chain normalization.
US Stocks: Earnings are supporting the index from below, and there was a rotation in supply from AI cores (semiconductors and cloud) into sectors such as defense, beverages, and automobiles today.
Commodities and Precious Metals: Gold is catching its breath after signals of overheating, while energy and utilities showed mixed performances due to individual issues.
Crypto: Although it has entered a short-term correction phase, it is necessary to observe whether institutional liquidity and physical ETF inflows can support a mid-term bottom.
Points Other Channels Missed: The Combination of ‘Easing Tariffs’ and ‘Pickup Truck Economics’
First, GM’s “easing tariff burdens” comment is a signal that could alleviate the multi-valuation discount of the automotive sector.
The logic of considering tariff fears as a delaying factor has weakened, meaning that going forward, the sector’s value will be realigned around the fundamental variables of demand, delinquencies, and incentives.
Second, pickup trucks represent a “structural demand” created by US households through tax benefits, depreciation, and lifestyle routes.
In other words, even if the automotive sector experiences a downturn, improvements in the truck mix can support margins and cash flow.
Viewed together, the risk-reward dynamics in the US automotive segment can be summarized as a tug-of-war between “reduced tariff risks vs. demand slowdown,” suggesting a portfolio approach that prioritizes models and OEMs with clear advantages in mix and tax benefits.
Investment Checklist: Actionable Observation Points
– Rare Earths: Prioritize verifying the vertical integration from refining to magnets, government off-take agreements, and the timeline for environmental permits.
– Automotive: Track auto loan delinquencies, incentive rates, residual values of used cars, lease proportions, and pickup mix trends on a quarterly basis.
– Coca-Cola/Beverages: Monitor the growth rate and price-mix of the energy category, the impact of exchange rates by region, and the sensitivity of costs such as per ton aluminum.
– Defense: Check for multi-valuation re-rating points through the lens of backlog, government budget execution pace, and the rising share of engine and MRO (maintenance, repair, and overhaul) revenues.
– Macro: Adjust sector rotation timing by watching the interest rate peak-out, the trajectory of inflation, and the speed of supply chain restructuring.
< Summary >
GM sent a signal for easing automotive sector discounts with raised earnings guidance and references to “easing tariff burdens.”
Coca-Cola defended its margins even in an inflationary phase, driven by strong performance in the non-alcoholic/energy drink segment.
Rare earths continue their rally amid US-China tensions and Western subsidy momentum, but caution is warranted due to bottlenecks in refining and magnet production and long lead times.
America’s best seller remains the pickup truck, with tax, depreciation, and margin structures supporting demand.
The market is rotating towards sectors with strong earnings amid issues such as interest rates, inflation, and supply chain challenges, making a strategy based on a data-driven checklist effective.
[Related Posts…]
Impact of US-China Rare Earth Supply Chain Restructuring on the Global Economy
Pickup Truck Demand and Outlook for the US Automotive Sector
*Source: [ Maeil Business Newspaper ]
– [LIVE] GM 예상치 상회 실적에 8% 급등ㅣ코카콜라 비알콜 점유율 상승ㅣ미국 최다 판매 차 1위는 픽업트럭ㅣ홍키자의 매일뉴욕