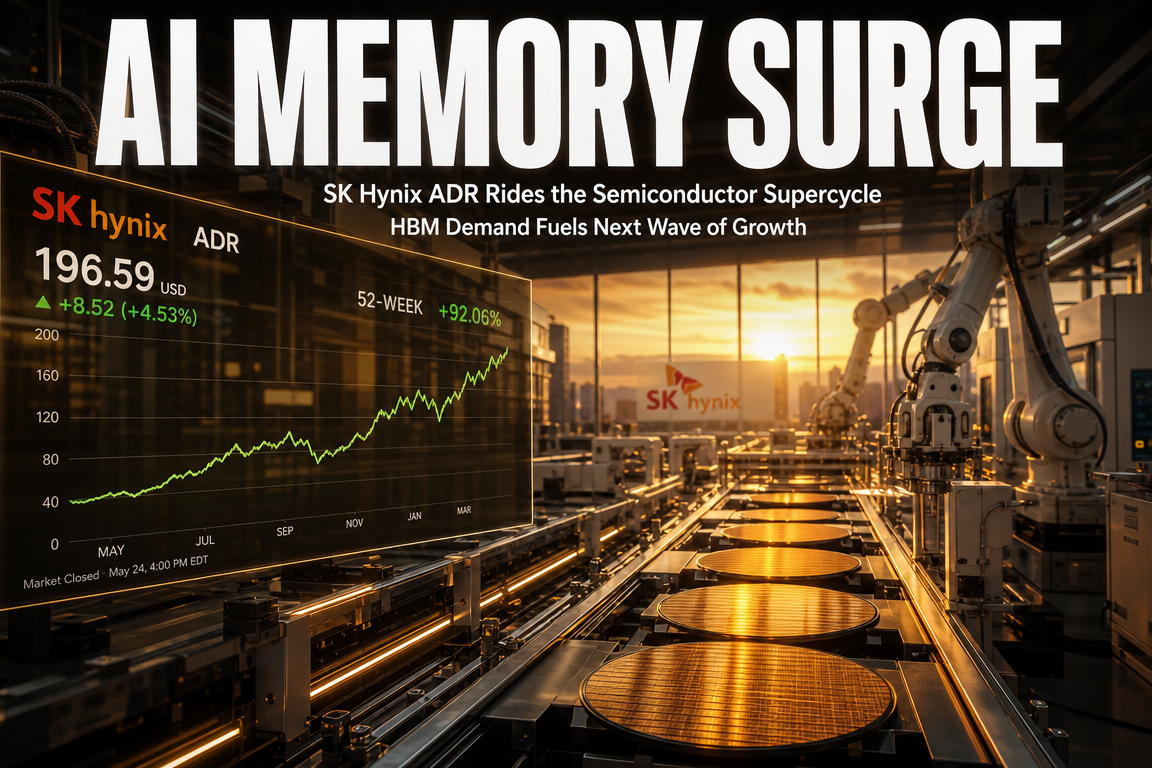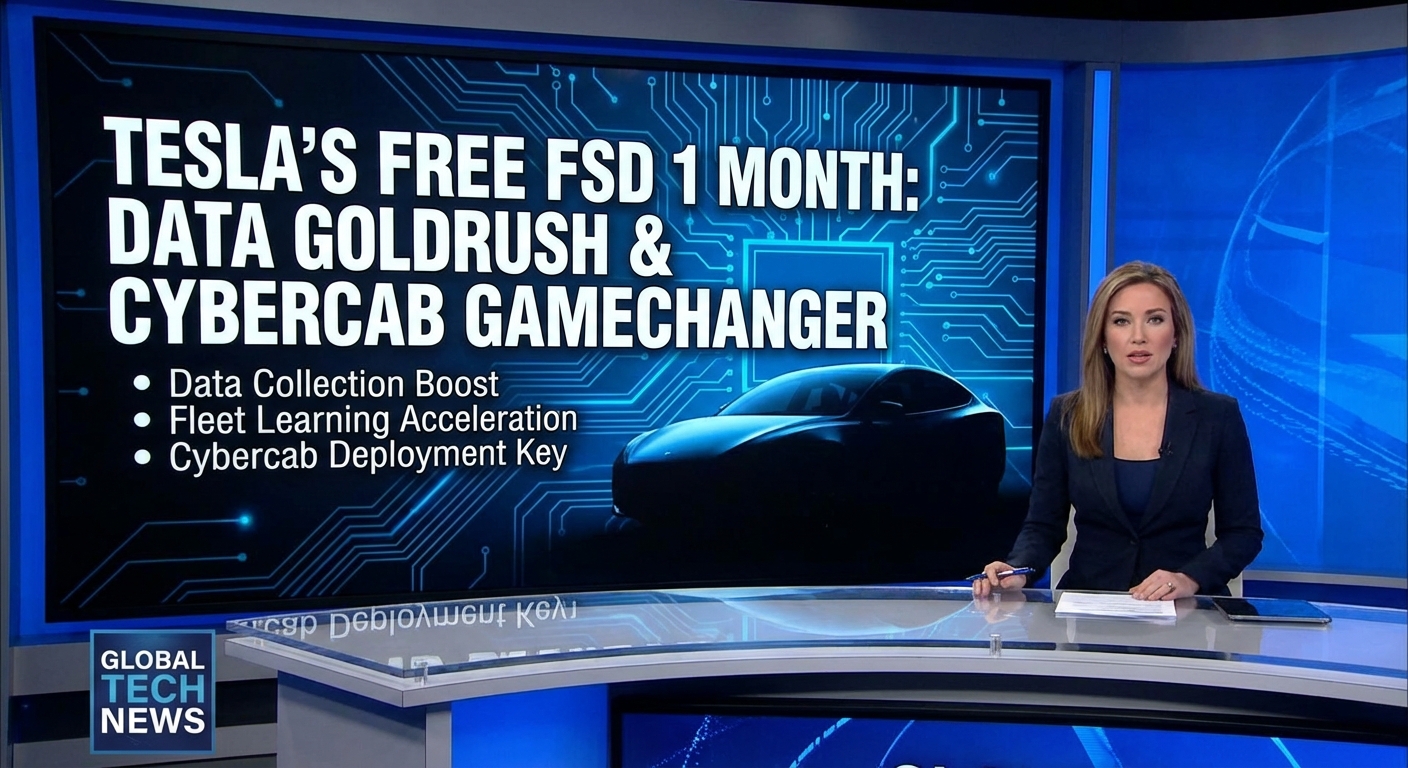
● Tesla’s Free FSD 1 month, Data Goldrush, Cybercap Gamechanger
Tesla FSD’s Real Intent Behind Free Rollout to 1.5 Million Users, Key Points of Update v14.2.1, Reversal in the Lidar Debate, and a Comprehensive Overview of the ‘Cybercap’ Roadmap and Global Sales
This article covers the revenue impact of offering FSD for free to 1.5 million users over 30 days, the key points of the v14.2.1 update, and the reason why Tesla confidently shifted its advertising target from “car” to “FSD.”
It summarizes the lessons left in the market by the lidar phase-out trend and the Mark Rover issue, the production signal for the “Cybercap” in 2026 and the cost revolution in robo-taxi per mile, as well as the significance of Giga Berlin’s two-shift operation and the launch of Cybertruck and FSD in Korea.
In particular, it condenses in a separate section the often overlooked impacts on accounting (deferred revenue), insurance, electricity grids, and the labor market.
News Summary 1) Free FSD to 1.5 Million Users: Promotion Objectives and Economic Effects
According to the original text, Tesla rolled out FSD v14 free for 30 days to HW4 vehicle owners who had not purchased it.
The target group is estimated to be about 1.5 million people.
The goals are to maximize conversion through hands-on experience, acquire additional autonomous driving data, and shift the marketing focus fully to “software” rather than “car.”
The price is set at $8,000.
Assuming a 10% conversion rate, the short-term cash inflow is estimated to be about $1.2 billion.
This amount is close to the net profit of some quarters, and it represents a meaningful inflow in terms of operating cash flow.
If subscription conversion is simultaneously pursued, monthly subscription ARR layered on can increase the software sales share and productivity.
From a global economic perspective, this supports Tesla’s tech premium and serves as a card to strengthen its multiple defensibility even in an environment with persistent interest rates.
News Summary 2) v14 → v14.2 → v14.2.1: Simultaneous Enhancement of “Safety” and “Ride Comfort”
FSD v14 is introduced with a tone that significantly reduces safety concerns.
It is also mentioned that in some regions by year-end, pilot programs for unmanned robo-taxi services will commence by removing safety drivers.
In v14.2, ride comfort and responses to irregular situations have been improved, and it is reported that v14.2.1 was additionally deployed during Thanksgiving.
Although instances of harsh braking in situations like leaves scattering at night were observed, the update has reduced both the frequency and intensity of such events.
The key point is Tesla’s improvement cycle—“after ensuring safety thresholds, quickly adjust ride comfort and naturalness.”
News Summary 3) Tesla’s Autonomous Driving Edge: 6.5 Billion Miles of Data and Real-World Testimonials
The accumulated driving data of 6.5 billion miles forms the basis for statistical safety and performance learning.
Unlike competitors who showcase individual features, Tesla pushes “full-stack driving for entire metropolitan areas” via regular updates, which makes a huge difference.
The original text includes a testimonial of FSD taking a driver to the hospital just before a cardiac arrest.
There is also mention of FSD discussions at the Czech parliamentary transport committee, indicating a trend towards regulatory discussions on a national scale.
News Summary 4) The Current State of the Lidar Debate: Volvo–Lumina Split and the Lessons from the Mark Rover Issue
The original text states that Volvo terminated its contract with Lumina, interpreting this as an increasing perception that lidar in a multi-sensor stack can be more of a hindrance than a help.
Mark Rover’s remarks on lidar initially triggered short-term stock movements, but in the end, Lumina experienced a significant drop.
The takeaways are twofold.
First, increased BOM components and system complexity represent a trade-off with software learning scalability and network effects.
Second, long-term data and actual deployment are ultimately more critical to a company’s value than a single viral narrative on YouTube or in the news.
News Summary 5) Expanding Cybercap Recruitment and the Robo-Taxi Cost Game Changer
The original text mentions that Musk stated the full-scale production of the “Cybercap” will begin in April 2026, and recruitment is rapidly underway in line with this.
Initially, robo-taxis will utilize the Model Y, but once converted to Cybercap, the production cost per vehicle and cost per mile are expected to drop significantly.
The reduction in cost per mile can alleviate the inflationary pressure on urban mobility through enhanced overall robo-taxi productivity.
Even in periods of high interest rates, cost competitiveness plays a role in supporting demand.
News Summary 6) Production and Sales Updates: Giga Berlin’s Two-Shift Operation, Rising European Deliveries, and Korea’s Emerging Presence
Giga Berlin has increased its production hours by operating on two shifts, and European deliveries have been rising steeply.
Some sourcing channels in Canada have been redirected to Berlin, indicating changes in the global mix.
Norway boasts a very high adoption rate per capita, and Korea is notable for being the first market outside the U.S. to officially sell the Cybertruck, as well as quickly implement the latest FSD.
Korea’s high adoption rate strengthens its status as a reference country for “technology acceptance” within Asia.
News Summary 7) Tesla as a Police Car in the U.S.: Demonstrating TCO in the Public Sector
Initially skeptical, field police expressed satisfaction with the performance and efficiency after operating the vehicles.
Efficiency in energy consumption, maintenance, and improvements through OTA upgrades are key factors in lowering the total cost of ownership (TCO) in the public sector.
In addition, from a brand and ESG perspective, additional points are awarded, potentially paving the way for its expansion as tolerance vehicles or supplementary systems for public transportation in the future.
Economic Interpretation: Sales, Cash Flow, and Accounting Treatment Points
Assuming a 10% conversion rate equates to a $1.2 billion cash inflow; 5% would be $600 million, and 20% would be $2.4 billion.
Before full autonomy is achieved, a portion of the FSD revenue is recorded as deferred revenue, with recognition increasing as performance and regulatory milestones are met.
Expanding the software revenue share favors overall margin expansion and supports the valuation multiples of tech companies.
Once subscription conversions accumulate, a defensive ARR-based structure will be built that can withstand economic slowdowns and interest rate fluctuations.
Ultimately, the business logic is realigned from “sell the car so that FSD is used” to “spread the car in order to sell FSD.”
Key Points Often Overlooked by Other Media
- Structural changes in insurance premiums and loss ratios.
FSD enhances Tesla Insurance’s real-time risk pricing, and a reduction in loss ratios can immediately lead to lower premiums and higher vehicle demand.
This becomes a micro-mechanism for reducing inflationary pressures. - Power grids and pricing structures.
The proliferation of robo-taxi and FSD increases nighttime charging demand, encouraging load leveling.
Major cities may redesign kWh tariffs and expand the demand response (DR) market, thereby reshaping power inflation risks. - The labor market and productivity.
Some urban driving jobs are replaced by software, leading to an overall increase in productivity.
While short-term costs for job transitions may occur, service accessibility improves in the long term. - A qualitative shift in semiconductor demand.
With a higher proportion of in-vehicle inference and driving data feeding the learning pipeline, the AI semiconductor cycle might extend.
The sensitivity of CAPEX for training and inference is directly tied to interest rate variables. - Urban real estate and parking.
The adoption of robo-taxis structurally reduces the demand for urban parking, triggering reallocation in commercial real estate.
Risks and Checklist
- Safety long tail.
Irregular cases such as falling leaves, snowstorms, backlighting, and work zones require ongoing learning. - Regulations and accountability.
It is necessary to tailor responsibility, insurance, and data governance structures for each country when transitioning to unmanned operation. - Supply chain and macro variables.
Tightening in batteries and semiconductors, persistent high interest rates, and economic slowdowns can all impact demand flexibly. - It is premature to assume the complete phase-out of lidar.
In specialized areas (such as low-speed robotics and precise mapping), its parallel use remains a possibility.
Investment Perspective: What to Look For
- Conversion rates and subscription rates.
The proportion of paid users after the free trial ends at 30, 60, and 90 days. - Safety and quality indicators.
Disengagement frequency, instances of hard braking/acceleration, and the speed of recall/OTA improvements. - Trends in insurance loss ratios and premiums.
Monitoring whether the impact of FSD is reflected in the numbers. - Production cycles.
The speed of production increases at Giga Berlin, recruitment for Cybercap, and the pace of facility integration. - Regulatory momentum.
Acquisition of unmanned robo-taxi operating rights through country-specific sandbox initiatives.
These five key variables are critical in assessing the simultaneous re-rating of tech stock multiples and cash flow.
Key Points on the Korean Market
Korea is likely to enhance its status as an “Asian testbed” with the official sale of the Cybertruck and rapid adoption of FSD.
If electricity rates, insurance, and parking infrastructure policies are aligned, the total cost of urban mobility can be rapidly reduced.
The high consumer acceptance makes Korea a market where global economic changes and tech trends are easily experienced.
< Summary >
- The free FSD for 1.5 million users is a big move aimed at experience-to-paid conversion, additional data accumulation, and a shift to a software-centric model.
- Updates up to v14.2.1 reflect a trend of accelerating ride comfort adjustments after ensuring safety thresholds.
- The lidar debate is not merely about whether the sensor is good or bad but a battle over BOM, scalability, and the network effects of data.
- Cybercap is a card to support demand even in inflationary and high-interest rate environments by reducing the per-mile cost of robo-taxis and enhancing overall productivity.
- From an accounting perspective, the recognition of deferred revenue is critical, with spillover effects on insurance, power grids, the labor market, and real estate.
- The checklist includes conversion rates, safety indicators, insurance loss ratios, the pace of production increases, and regulatory momentum.
[Related Articles…]
- Robo-Taxi Unit Economics: The Moment When Cost per Mile Changes the Rules of Mobility
- The Dynamics of AI and Interest Rates: A New Standard for Tech Valuations
*Source: [ 허니잼의 테슬라와 일론 ]
– 테슬라가 던진 승부수! 150만명에게 FSD를 푼 이유는? / 본격 사이버캡 생산 채용 진행 중! / 초대형 유튜버 마크 로버가 추천한 라이다의 충격적 현실
● Tech-Crypto Split, GPU Lockdown, Burry Endgame
Key Report Covering Nasdaq-Bitcoin Decoupling, Google TPU vs Nvidia, and Michael Burry’s Year-End Strategy All at Once
This article contains three sections.
First, it explains the meaning of the decoupling between Nasdaq and Bitcoin, presents three possible future scenarios, and provides a ready-to-use checklist.
Second, it breaks down the real variables behind Google TPU’s public sale and the momentum of Nvidia’s ecosystem driven not by cost-effectiveness but by switching costs, with supporting figures.
Third, it covers Michael Burry’s short and long positions, detailing his year-end market tactics and practical points for window dressing and tax-loss harvesting plays.
It naturally reflects key keywords such as the US stock market, Nasdaq, interest rates, inflation, and the dollar.
[News Summary] Three Key Lines Moving the Market Now
Nasdaq and Bitcoin have diverged more than they have in the past three years, and historically they have generally reconverged through mean reversion.
Net buying of US stocks by foreign funds has accelerated since April, supporting the momentum of AI and big tech.
External sales of Google TPU have started, but in terms of the current generation’s performance/cost ratio, Nvidia remains superior, with Google’s V7 pricing policy being the biggest variable.
1) Nasdaq vs Bitcoin: Interpretation of Decoupling with Three Scenarios
The key point of observation is “mean reversion.”
Over the past three years, the two assets have reconverged several times after divergences, and each reconvergence path has differed.
This time, whether they reconverge or the correlation breaks will depend on liquidity and risk appetite.
– Scenario A: Nasdaq Support → Upward Reversion of Bitcoin.
The background is the expansion of net foreign inflows into US stocks and the sustained AI momentum.
In this case, the additional resilience of Bitcoin depends on the strength of the dollar and a slowdown in real interest rates.
– Scenario B: Bitcoin Weakens → Downward Reversion of Nasdaq.
This scenario emerges when the AI bubble narrative strengthens and profit-taking increases.
It can occur quickly if interest rate volatility expands and inflation reignites.
– Scenario C: Breakdown of Correlation (Structural Decoupling).
This is possible if crypto-specific factors such as ETF/spot supply and demand, regulatory events, or halving expectations dominate.
In this event, on-chain data and ETF flows become more important triggers than Bitcoin beta.
[Checklist: Conditions for Reversion]
1) Trends of the Dollar Index (DXY) and 10-year real yields.
A weak dollar and declining real yields are favorable for risk assets.
2) Global liquidity (e.g., US reverse repo and TGA balances).
If net liquidity inflows continue, simultaneous upward movement is more likely.
3) Continuation of net buying of US stocks by foreign investors.
If the trend persists, Nasdaq’s downside remains gradual.
4) Trends in crypto ETF net inflows/outflows and funding rates.
If overheating occurs, increased volatility should be anticipated.
2) Google TPU vs Nvidia: ‘Switching Costs’ Over ‘Cost-Effectiveness’
According to the report, Nvidia’s performance/cost advantage in the current generation is confirmed.
For example, the cost for generating 1 million tokens is approximately $1.06 for the H100, $2.24 for the MI300X, and $5.13 for the TPU V6.
Estimated hourly rental fees are also similar, with about $2.7 for TPU V6e, $2.7 for H700, and around $2 for MI300X.
The issue lies in the “total cost of ownership (TCO)” rather than just the “price tag.”
Nvidia’s CUDA, cuDNN, TensorRT, and ecosystem optimization result in higher utilization rates and shorter tuning times for the same model.
In other words, even with the same rental fee, the actual productivity is often higher with Nvidia.
[Google TPU’s Counterattack Points]
1) V7 performance leap + aggressive pricing policy.
Utilizing GCP credits, committed spending discounts, and model hosting bundling can create a tangible cost-effectiveness beyond the listed rental fee.
2) Workload-specific optimizations.
If TPUs demonstrate strengths in certain architectures during training/inference, they can gradually capture niche markets.
3) Vertically integrated packages.
Offering a complete solution from data pipelines to training, deployment, and monitoring on GCP can reduce operational complexity and lower TCO.
[Remaining Key Risks: Switching Costs]
1) Software lock-in.
The CUDA ecosystem spans developer tools, communities, sample codes, and kernel optimizations.
Even if performance is equivalent, switching and retraining costs play a significant role.
2) Customer dependency structure.
Adopting TPUs often requires long-term, almost exclusive contracts, increasing vendor dependency risks.
3) Conflict with multi-cloud strategies.
Major customers maintain negotiating power by using multiple vendors.
The greater the reliance on TPUs, the lower the strategic flexibility.
[Investment Perspective Summary]
Short-term stock sensitivity depends on the pricing policy for the V7 and the pace of acquiring reference customers.
Mid-term competitiveness hinges on the “development and operations ecosystem” and “incentives that offset switching costs” rather than just core performance.
Ultimately, the AI semiconductor battle is moving from a contest of chip benchmarks to a fight over TCO, ecosystems, and contract structures.
3) Michael Burry: Year-End Market Tactics Talking Through Short and Long Positions
Burry mentioned shorts on Palantir and Nvidia, and suggested holding shares of Lululemon, Molina Healthcare, Shift4 Payments, and PennyMey for 3 to 5 years.
The common denominator is the substantial drawdown over the past 6 months, mid-cap range, and oversold issues relative to fundamentals.
He believes that now is an opportune time to take advantage of window dressing and tax-loss harvesting.
[Techniques for Year-End Seasonal Plays]
1) Tax-loss Harvesting (TLH).
Selling losing positions during the year, replacing them with similar but different stocks, and returning after the 31-day rule is beneficial from an accounting perspective.
2) Window Dressing.
Institutions tidy up their holdings at year-end appearances.
They maintain high-performing stocks and reduce loss-making ones, which creates distortions.
3) Style/Factor Rotation.
There may be short-term inflows into mid-cap stocks with strong quality and cash flows, as well as sectors like healthcare, fintech, and mortgage that are non-AI.
[Caveats]
Burry’s past successes (e.g., GameStop) are only reference points, and replicating the same risks/timing is impossible.
The disclosure of short positions might be part of a hedging or expressive strategy and should not be viewed as an absolute signal of market direction.
4) Positioning Framework to Apply Right Now
1) Core AI Basket.
The ecosystem momentum centered on Nvidia remains strong.
As long as interest rates and the dollar do not change abruptly, demand is inelastic on the downside.
2) Alternative/Complementary AI Basket.
Beneficiaries of AMD and Google TPU will see increased beta when “pricing policies, reference cases, and toolchains” are confirmed.
Instead of relying solely on news momentum, it is more reasonable to wait for actual TCO improvement signals.
3) Crypto Beta Basket.
If reconvergence with Nasdaq is expected, a segmented approach is valid when improvements in supply and demand accompanied by a declining dollar and real rates are observed.
Indicators such as ETF inflows and overheated funding rates are key to risk management.
[Key Points Not Frequently Mentioned Elsewhere]
1) Nvidia’s real competitive edge is not the chip but “time.”
CUDA optimization reduces trial and error across the development and deployment processes, compressing the development calendar.
This productivity premium justifies the price premium.
2) Cloud pricing is determined not by cost but by “bundling.”
The displayed compute rental fee is only a starting point; bundled discounts on storage, networking, serving, and monitoring, along with committed spending contracts, drive TCO.
3) The key variable in the Nasdaq-Bitcoin correlation is the real interest rate.
The direction of real interest rates, which subtract inflation expectations from nominal rates, acts as the switch for crypto-tech synchronization.
4) Year-end performance distortions are concentrated in small and mid-cap stocks.
The combined effects of TLH and window dressing are significant in volatile sectors such as the Russell 2000 and biotech.
5) Checkpoints for This Week
1) Price and interest rate expectations.
CPI/PCE and the direction of real interest rates influence risk appetite.
2) The Dollar.
Easing of the dollar’s strength is favorable for a simultaneous rise in Nasdaq and Bitcoin.
3) AI-related events/guidance.
Comments on orders from cloud and semiconductor companies, as well as the release of new reference cases, mark a turning point.
Conclusion: View Decoupling as an ‘Opportunity’ and Focus on TCO Rather Than Just the Price Tag
If foreign inflows continue and US market risks from interest rates/inflation stabilize, the probability of upward reversion in Bitcoin is high based on mean reversion logic.
However, if the dollar and real interest rates rebound, the Nasdaq downward reversion scenario may accelerate.
The AI semiconductor battle is shifting from a contest of benchmark specifications to a competition over ecosystems, switching costs, and contract structures.
The key to victory is whether Google TPU’s pricing policy and toolchain can offset switching costs effectively.
< Summary >
The divergence between Nasdaq and Bitcoin will take different reversion paths depending on liquidity and the direction of real interest rates.
If foreign inflows continue, there is a high possibility of upward reversion for Bitcoin, but the opposite occurs if the dollar strengthens or rates rebound.
Google TPU’s success will be determined by the V7 pricing and ecosystem incentives, while Nvidia currently maintains an edge in TCO and switching costs.
Michael Burry’s year-end strategy utilizes TLH and window dressing in mid-cap reversals, and disclosed short positions might only serve as a hedge rather than an absolute directional signal.
[Related Articles…]
Nvidia vs Google TPU: The Turning Point in AI Semiconductor Leadership
Nasdaq-Bitcoin Decoupling: The Pitfall of Mean Reversion
*Source: [ Maeil Business Newspaper ]
– [홍장원의 불앤베어] 나스닥 폭락 차트인가, 비트코인 폭등 차트인가. 구글 TPU는 엔비디아 넘어설까