● Crypto Bloodbath, Liquidity Implosion, DeFi Panic
Bitcoin Plummets, Is This Really the End of the Season? Summarizing Liquidity Shock, Yearn Finance Issues, and BOJ Factors All at Once
Bitcoin broke a psychological support level and plunged, and this article covers all the key points that connect the stock market and AI trends, along with the background of its drop and the conditions for a rebound.
It summarizes issues such as evaporating liquidity, MSCI/passive funds, Japanese interest rates and yen carry trades, DeFi (Yearn Finance) smart contract risks, as well as short-term trading strategies and mid-to-long term perspectives—all in one piece today.
There is also a separate section that explains “liquidity plumbing, passive inclusion criteria, and the chain mechanism of an unwind in yen carry,” which is rarely mentioned in other YouTube channels or news.
Let’s coldly review the current position of the digital asset market, focused on keywords like macroeconomics, interest rates, liquidity, inflation, and global economic outlook.
Market Summary: Despite a Short-Term Rebound, the Trend Remains Downward
Bitcoin experienced a technical rebound after a sudden plunge, but its momentum is still tilted downward.
Major altcoins such as Ethereum, Ripple, BNB, and Solana are also showing weakness with an even greater beta effect.
For the time being, volatility is increasing, and chasing the falling knife is very risky.
The Four Pillars Behind This Decline: Liquidity · Passive · Interest Rates · DeFi
- Disappearing Liquidity Issue
After a recent large-scale forced liquidation event, the order book has thinned and spreads have widened, amplifying the plunge through shallow price levels.
The slowdown in new stablecoin issuance, combined with a reduction in open interest in the derivatives market, has left the buying power nearly empty. - MSCI, Passive Funds, and the ‘Bitcoin Leveraged Companies’ Debate
Controversy is growing over the eligibility of certain companies that hold large amounts of Bitcoin and influence stock prices for index inclusion, increasing uncertainty regarding the inflow/outflow of passive funds.
Given the market structure with a high proportion of passive indexing, even a single line in the index criteria can create a pathway that shakes cash flow, valuation, and cryptocurrency sentiment. - Uncertainty in Interest Rate Paths from the US FOMC and Japan’s BOJ
With the FOMC and BOJ meetings scheduled for mid-December, there is unclear guidance on interest rates and the path of liquidity.
Around macroeconomic events, risk assets tend to reduce positions, adding further downward pressure on digital assets. - Yearn Finance (DeFi) Issue
Suspicion has arisen over abnormal fund flows in Ethereum-based vaults/pools, highlighting risks in smart contracts.
As there was a delay in the protocol’s official communication regarding the scale of losses and remedial measures, de-risking flows were triggered starting from the weakest link.
Why the Yearn Issue Triggered a Broad Market Plunge
Because DeFi operates under the principle of “code is law,” even a small vulnerability can transmit trust risks across the entire chain.
When abnormal signs appear in deposit products, leverage-related positions and collateral can be shaken in a chain reaction, leading to cascading liquidations.
When combined with an already thin liquidity environment, this often causes excessive amplification of the decline through “price gaps.”
BOJ Interest Rates and Yen Carry Unwind: Why Cryptocurrencies Are Directly Hit
Japan has long served as a gateway for global liquidity with its ultra-low interest rates.
In an environment where low-interest yen borrowing to purchase dollar assets is significant, signals of rising Japanese interest rates trigger a reverse flow.
Once a yen carry unwind begins, sell pressure tends to concentrate first on highly volatile assets, and cryptocurrencies are often among the first baskets to be sold.
From a Passive/Index Perspective: Why Is a Single MSCI Line So Important?
Large funds such as pensions, foundations, and ETFs often follow index criteria due to internal regulations.
Index inclusion/exclusion is not just news but a “cash flow event” that mechanically triggers buying or selling.
The debate over the index eligibility of companies holding large amounts of Bitcoin can indirectly exert pressure on Bitcoin’s supply and demand.
Short-Term Trading Checklist: Play Defensively, Follow Signals When They Appear
- Volatility: When option implied volatility spikes, be aware of the discrepancies between spot and futures, as well as widening slippage.
- Momentum: When the trend is downward, it’s better to wait for trend reversal signals (such as rising lows/higher highs and recovering trading volumes) rather than chasing rebounds.
- Liquidity: Check whether improvements in net stablecoin issuance, exchange reserves, and order book depth accompany the move.
- DeFi Risk: Verify whether Yearn’s official announcement (detailing loss range, compensation, or upgrade plans) resolves the uncertainty.
This content is general information and does not constitute investment advice.
Mid-to-Long Term Outlook: The Digital Gold Logic and Macro Cycle
From a perspective of three years or more, Bitcoin’s scarcity, network effects, and increasing institutional adoption support its investment rationale.
However, one must manage risk on the premise that valuations can fluctuate significantly according to macroeconomic cycles, interest rates, inflation, and changes in liquidity.
Three Reversal Scenarios: What Could Reignite a ‘Risk-On’ Environment?
- Easing of Central Bank Communication
If the FOMC or BOJ signals a relaxation in tightening, dollar liquidity could improve and risk appetite might return. - Limited Resolution of the Yearn Risk
If the scale of losses is limited and the compensation/upgrade roadmap restores confidence, the DeFi risk premium may shrink. - Alleviation of Passive Uncertainty
If the debate over index inclusion/exclusion calms down, the volatility of related assets could decrease, and the indirect pressure on Bitcoin’s supply-demand may ease.
Link to the Stock Market: How the Crypto Shock Moves Stock Prices
During the liquidation of leveraged positions, stocks with high liquidity may be sold first to raise cash due to the “cross margin” effect.
Sectors with high co-movement with crypto (semiconductors, GPUs, fintech, exchanges, and miners) tend to exhibit greater beta movement.
Ultimately, crypto volatility often serves as a leading indicator for stock market volatility.
AI Trend Points: How Agents and Models Are Changing Trading and Risk Management
- Spread of AI Trading Agents
Multi-agent systems are increasingly analyzing integrated on-chain and off-chain data to capture ultra-short liquidity gaps, contributing to rising volatility. - AI in On-Chain Security
With the aid of large language models and graph AIs, the detection of abnormal smart contract patterns has accelerated, leading to rapid alert and avoidance trading. - GPU Cycle and Digital Asset Beta
As investment cycles in AI infrastructure align with a preference for risk assets, the strength of the “GPU and data center momentum” indirectly influences crypto beta.
Five Key Points Not Mentioned Elsewhere
- Order of Liquidity Plumbing
RRP balances, TGA fluctuations, and government bond issuance schedules determine the flow of liquidity from the banking system to money market funds and risk assets.
When this channel narrows, crypto is the first to be shocked. - Yen Carry and the Dollar Basis
When a yen carry unwind occurs, the expansion of the dollar basis and a sharp increase in hedging costs accelerate deleveraging.
Crypto derivatives are particularly sensitive to this pressure. - Weekend and Late-Night Microstructure
During weekends and late nights, order book depth can suddenly thin, causing even the same news to result in exaggerated declines.
Risk should be managed in consideration of the time of day. - Technical Criteria for Index Eligibility
Regulations such as liquidity ratios, revenue diversification, and limits on similar asset exposures can mechanically trigger passive fund trading.
Often, the “regulatory text” is more critical to market microstructure than the direction of the news. - Option Gamma Transition
When dealers’ gamma positions in spot, futures, and options markets shift to shorts, automated flows that further amplify declines in bearish markets are strengthened.
Trigger Event Calendar to Watch
- FOMC meeting along with dot plots and keynote speeches
- BOJ meeting with YCC and policy rate guidance
- Updates on US inflation indicators such as CPI and PCE
- Official audit and compensation plan announcement from Yearn Finance
It is necessary to watch for position reductions and increased volatility surrounding these events.
Risk Management Guide: Based on Scenarios
- Base Case
Volatility remains high but does not escalate into systemic risk, entering a period of gradual bottom confirmation. - Upside Case
If there is a signal of policy easing combined with the resolution of the DeFi issue, the quality of the rebound rally will be confirmed by trading volume and net stablecoin inflows. - Downside Case
If the variables of index, DeFi, and interest rates worsen simultaneously, deleveraging and collateral liquidations could further intensify.
Approach this with individual judgment and responsibility; this article does not constitute investment advice.
Conclusion: Maintain Short-Term ‘De-risk’ and Long-Term ‘Digital Gold’ Logic
Currently, we are in a phase where macro events, liquidity gaps, and DeFi uncertainties overlap, making a short-term defensive strategy advantageous.
However, over a three-year or longer frame, the network value and institutional adoption continue to enhance digital assets.
Wait for the moment when changes in macroeconomics, interest rates, liquidity, and inflation flip the switch—and once signals confirm, it won’t be too late to follow.
< Summary >Bitcoin’s plunge is the result of combined factors including deteriorating liquidity, uncertainty from MSCI/passive funds, interest rate variables (especially from the BOJ), and the Yearn DeFi issue.
In the short term, de-risking and following confirmed signals should be prioritized, while in the long term, the digital gold logic remains intact.
The reversal keys include signals of policy easing, resolution of the DeFi issue, and alleviation of uncertainty from passive factors, while the spread of AI trading and on-chain security methods are changing the structure of volatility.
[Related Articles…]
3 Shocks the Yen Carry Unwind Exerts on Bitcoin
Signals from Passive Funds and Index Inclusion on Digital Assets
*Source: [ 내일은 투자왕 – 김단테 ]
– 비트코인 급락. 결국 시즌 종료인가?
● Google Ignites AI Rally 2.0, Tech Stocks Explode
AI Rally Season 2, Google Ignites the Fire: A Comprehensive Summary of December US Market Liquidity, Rate Cut Variables and Beneficiary Landscape
The Essentials to Check in This Post
This post provides a detailed summary of the triggering factors for AI Rally Season 2 and the beneficiary landscape of Google’s allied stocks.
It explains why my account did not appreciate as much amidst the November volatility and outlines the structural reasons behind the rotation.
It discusses how December’s US market liquidity and expectations for a rate cut are reflected in stock prices.
It clarifies the hidden effects on valuation from the resolution of antitrust risks for Meta and Google.
It additionally provides distinct perspectives on the “change in AI infrastructure TCO structure” and the “100-day AI rotation” that are seldom discussed elsewhere.
It is organized as an actual investment checklist incorporating global economic factors, the US market, inflation, rate cuts, and a strong dollar.
Market Briefing: November Volatility, December Ingredients
The S&P 500 experienced repeated sharp declines and surges in November, leaving the index flat while the actual returns varied greatly by stock.
The rebound was led by large-cap stocks, while small-cap and liquidity-sensitive stocks saw limited recovery.
The period when fear indices fell into extreme levels eventually served as an opportunity for dollar-cost averaging.
In December, expectations for rate cuts, the possibility of liquidity re-infusion, and major AI events are again stimulating a preference for risk assets.
Global economic factors are heavily watched, including the pace of inflation moderation, whether the strong dollar will ease, and the likelihood of a year-end “Santa Rally” in the US market.
AI Rally Season 2: Momentum Launched by Google and Beneficiary Landscape
Google’s GeminAI upgrade and the expansion of the AI chip ecosystem have re-ignited the rally.
Within Big Tech, leadership is partially shifting from being centered on NVIDIA and Microsoft to including Google and Broadcom.
The key stock landscape is as follows:
- Google Alliance Core: Alphabet (Google), Broadcom (design/accelerator), Marvell Technology (custom accelerator/DPU), Micron (memory).
- Optical Communications Chain: Lumentum, Coherent, and Sienna benefit directly or indirectly from the demand for data center optical links and modules.
- Servers/ODMs: Companies like Celestica, which integrate server assembly and rack systems, benefit on the order side.
- Korean Semiconductors: Samsung Electronics and SK Hynix continue to gain structurally from demand for HBM, DDR5, and CXL.
Reports that Meta may expand its adoption of Google’s AI chips are interpreted as hyperscalers reducing TCO and strengthening multi-vendor strategies.
This indicates a shift away from a single dependency on NVIDIA to a mixed use of TPU and GPU, thereby dispersing costs and risks.
Mitigation of Regulatory Risks: Resolution of Antitrust Uncertainty for Meta and Google Lifts Valuation Discounts
Meta has reduced the uncertainty of antitrust disputes by widening the definition of the SNS market in its ruling.
Similarly, following the easing of concerns over browser separation, Google has seen a reduction in its psychological discount, increasing the potential for a normalization of multiples.
Regulatory risks had been a factor in the structural undervaluation of Big Tech, and their mitigation acts as a catalyst that heightens stock sensitivity.
A Point Rarely Mentioned Elsewhere: AI Infrastructure TCO and Cash Flow
The biggest costs in AI investment remain the purchase of accelerators and addressing the bottlenecks in data center power and optical communications.
Meta’s adoption of a multi-vendor strategy and Google’s expansion of its own accelerators lower the hyperscaler’s TCO and contribute to protecting free cash flow (FCF).
The margin of AI infrastructure improves structurally when factors such as ‘stabilization of lower GPU prices’, ‘improvements in optical module pricing and performance’, and ‘enhanced power efficiency (W/token)’ all come together.
This change will appear in financial statements one or two quarters after the stock price, so it is effective to check leading indicators such as optical module orders, lead times, and data center power expansion plans.
A Balanced Perspective: 100-Day AI Rotation and Competitors’ Counterattacks
Historical data indicates that AI leaders tend to experience accumulation selling roughly every three months, often resulting in a change of leaders.
Even in a phase of strengthened Google momentum, the next-generation Rubin accelerator from NVIDIA, new features from Microsoft/OpenAI, and momentum derived from Amazon’s Reinvent can trigger reversals.
In other words, rather than concentrating on a specific winning stock, it is reasonable to follow a diversified strategy by periodically monitoring valuation, momentum, and supply chain news flow.
Policy & Liquidity: The Path from December Rate Cut Expectations to the US Market
Market participants are reflecting a high probability of a rate cut in December or in the short term.
If inflation decelerates, real interest rates could fall, and risk asset appetite could increase simultaneously.
From a liquidity perspective, the US Treasury issuance schedule, reserve balances, and TGA fluctuations influence the inflows and outflows in the market.
Year-end rebalancing demand in 401(k) retirement accounts introduces seasonal rigidity on the downside.
If the strong dollar subsides, commodities, emerging markets, and Big Tech multiples will be favored; conversely, if the strong dollar resumes, the discount rates for growth stocks might rise again.
Style & Sector Rotation: Why My Account Didn’t Gain as Much
The November rebound was led by relatively less expensive Big Tech and defensive stocks with value characteristics among large-cap growth stocks.
Liquidity-sensitive stocks, high-premium growth stocks, and some policy-favored themes experienced a stagnant flow.
Depending on political and policy framing, healthcare and pharmaceuticals received inflows from defensive funds, and some AI infrastructure stocks showed significant differences in momentum and earnings visibility.
In short, even within the same US market upswing, factor selection widened the gap in returns.
Strategy: Positioning and Risk Management
Core Holdings: Maintain high-quality AI infrastructure stocks such as Alphabet, Broadcom, Marvell, and Meta, along with the HBM/optical communications chain as the core, and use phased buying during overheated events.
Rotation Strategy: Keep potential next triggers such as NVIDIA, Microsoft, and Amazon on a watchlist, and mechanically rebalance a portion of the weight if accumulation selling signals emerge within the 100-day period.
Cash Management & Dollar Operations: In a strong dollar environment, secure cash returns with ultra-short-term Treasury ETFs (such as SGOV), and consider gradual stock conversion when fear widens.
Diversification & Discipline: Given the amplified volatility before and after event calendars, preset trailing stops and target weight rebalancing rules across profit and loss zones.
ETF & Asset Class Check
AI/Cloud ETFs have recorded excess returns relative to volatility, and commodities (gold, silver, copper) rebounded on expectations of a weakening strong dollar.
Bio/Healthcare, combining defensive characteristics with policy expectations, attempted a gradual recovery.
From a long-term accumulation perspective, a strategy of automated dollar-cost averaging in NASDAQ and S&P 500 index funds experiences lower stress.
For dollars, receiving monthly distribution interest via ultra-short-term cash instruments like SGOV is recommended, though distributions might be gradually adjusted as rate cuts accelerate.
December Calendar: Key Events
- AI/Cloud Conferences: Attention is focused on follow-up news after Amazon’s Reinvent, year-end Big Tech developer events, and semiconductor supply chain conferences.
- Tech Earnings & Guidance: Comments on orders and lead times from Broadcom, Micron, and some data center chain companies will be important.
- FOMC & Macro: Sensitivity to the tone of rate cut guidance, updates on the inflation trajectory, and the directional movement of the dollar index will be significant.
News at a Glance: Key Takeaways
- Expectations for AI Rally Season 2 ignited by Google have strengthened Alphabet, Broadcom, and the optical communications chain.
- Reports of Meta potentially adopting Google’s chips reinforce the story of cost reduction in AI infrastructure.
- The easing of antitrust uncertainties for Meta and Google acts as a catalyst for the normalization of Big Tech multiples.
- November’s market was characterized by a rebound led by large caps and clear factor rotation, while small-caps and high-premium growth stocks showed limited recovery.
- In December, with the simultaneous unfolding of rate cut expectations, liquidity factors, and AI events, a recovery in risk appetite in the US market is observed.
Key Insights Unique to This Post
- The real variable in AI infrastructure TCO is not just the GPU price but also the performance of optical modules, power efficiency, and the speed of data center power expansion.
- The pattern of accumulation selling around the 100-day mark in AI stocks supports a strategy based on diversification and disciplined rebalancing rules.
- The resolution of regulatory risks removes the structural discount on Big Tech, paving the way for an upward adjustment in multiples even with similar earnings.
- Liquidity permeates stock prices through the interplay of TGA, reserve balances, and issuance schedules, and a short-term easing of a strong dollar benefits multiple expansions.
Risk Checklist
- If the pace of rate cuts fails to meet expectations, there is a risk of recurring adjustments in growth stock multiples.
- Short-term overheating and dual orders in the AI server/HBM supply chain could amplify volatility during earnings seasons.
- A reemergence of a strong dollar could impose a triple pressure on commodities, emerging markets, and tech stocks.
- Geopolitical and policy variables may widen return dispersion due to varying sector impacts.
Position Ideas (For Learning Purposes)
- Core: Alphabet, Broadcom, Marvell, Meta, and the HBM/optical communications chain (Lumentum, Coherent, Sienna).
- Trigger Watch: NVIDIA’s Rubin roadmap, new features from Microsoft/OpenAI, and Amazon’s AI workload pipeline.
- Hedge & Cash: Operate dollar cash using ultra-short-term Treasuries like SGOV and gradually convert around events.
- Accumulation: For long-term accumulation, a strategy of automated, phased buying in NASDAQ and S&P 500 index funds minimizes stress.
< Summary >
Google-driven AI Rally Season 2 has been ignited, strengthening the AI infrastructure, optical communications, and memory chains.
The resolution of antitrust risks by Meta and Google is favorable for the normalization of multiples, while multi-vendor strategies lower AI infrastructure TCO and protect FCF.
November was dominated by a rotation in large-cap stocks, and December is set for the simultaneous development of rate cut expectations, liquidity, and AI events.
A strategy that takes into account the 100-day accumulation selling pattern in AI stocks and emphasizes diversification, rebalancing, and disciplined cash management is reasonable.
Global economic factors such as the trajectory of inflation and the direction of the strong dollar are key to US market multiples.
[Related Posts…]
- AI Rally Season 2, A Comprehensive Summary of Google’s GeminAI Strategy
- December FOMC and Rate Cut Scenario Checklist
*Source: [ 소수몽키 ]
– 살얼음판 증시, 구글이 살려낼까? AI랠리 시즌2 수혜주들
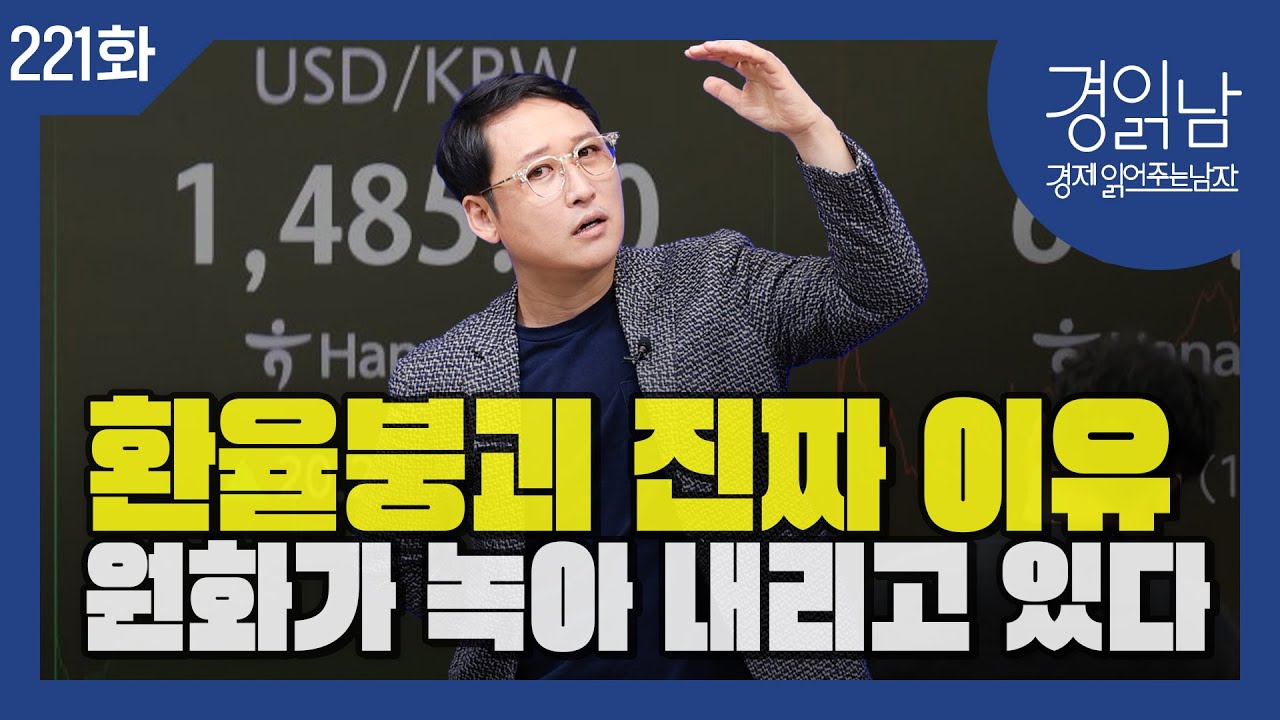
● Won Meltdown, Excess M2 and Dollar Frenzy Fuel Currency Collapse
‘KRW Weakness’ The Real Reasons Behind Currency Uncertainty: A Comprehensive Overview|Why the Dollar Index Remains Calm While the USD/KRW Jumps|Read All at Once on M2 Liquidity Supply Speed, National Pension, Overseas Investment, and Export Remittance Suspensions
This article precisely covers three points.
First, the structural reasons why the USD/KRW exchange rate remains high despite the dollar index not being strong.
Second, the gap in M2 liquidity supply speed that must be examined before blaming the National Pension or overseas retail investors.
Third, the 2026 exchange rate scenario triggers and response strategies, and the linkage between the AI investment cycle, exchange rates, and liquidity.
1) Market Briefing|KRW Weakness Is Not Due to a ‘Strong Dollar’ but to ‘Solely a Weak KRW’
Recently, the USD/KRW exchange rate has been maintaining high levels near historical peaks.
However, the Dollar Index (DXY) remains within a range around 100, indicating that this is not a typical phase of a ‘globally strong dollar.’
In other words, this phase is more accurately described as a ‘weak KRW’ rather than a ‘strong dollar.’
Based on the Real Effective Exchange Rate (REER), Korea ranks in the lower tier among major countries, showing that the real value of the KRW is significantly depressed.
From an economic outlook perspective, it is more appropriate to interpret this situation as a phase where the KRW weakness is persisting, rather than a normalization of a strong dollar.
2) True Reason 1|The Gap in M2 Liquidity Supply Speed Has Changed the Exchange Rate Level
The key is the “velocity of money.”
Although the United States has also increased liquidity, recent data indicates that Korea’s M2 growth rate is moving faster than that of the United States.
As a result, the “dilution speed” of the KRW’s value has accelerated compared to the dollar, meaning that more KRW is required to purchase one dollar.
Remember that the exchange rate is not just the price of supply and demand but also a contest of relative currency value speeds.
From a policy perspective, managing the exchange rate is not just about monitoring interest rates and inflation; it is crucial to control how much slower domestic M2 growth is compared to that of the United States.
3) True Reason 2|Why the KRW Remains Weak Despite a Surplus in External Transactions
Both the trade balance and the current account have been in surplus.
However, the reason the exchange rate remains high is due to a structure in which dollars entering the country are not supplied to the market.
Exporting conglomerates tend to hold onto and deposit the dollars earned in a strong dollar environment instead of immediately converting them.
Meanwhile, small and domestic companies bear the full brunt of rising costs, and consumers experience inflationary pressure through increased import prices.
4) True Reason 3|The Asymmetrical Effect of Expanded Overseas Investment and the National Pension Portfolio
The net buying of overseas stocks by individuals and institutions creates a structural demand for dollars.
When combined with net selling of KOSPI shares by foreigners, there is a prolonged flow of foreign currency out rather than in.
The National Pension has been expanding its exposure to overseas assets to enhance long-term returns according to the law and its mandate.
According to recently disclosed portfolio data, the overseas allocation is larger than that of domestic assets, and it is designed to continue reducing the proportion of domestic stocks while increasing that of overseas stocks in the future.
The important point is that the National Pension is not an institution for stabilizing the exchange rate but one for maximizing retirement fund returns.
Therefore, while the pension strategy can shake exchange rates, it cannot do so in a way that compromises its objectives for exchange rate stability.
What is feasible is a “fine-tuning” within a framework that avoids conflicting goals, such as central bank-government currency swap lines, hedge guidelines, exchange rate fluctuation insurance, and tax incentives.
5) Data Reading Points|The Three-Link Chain of ‘Liquidity – Transactions – Demand’
Liquidity: If Korea’s M2 growth rate is faster than that of the United States, the KRW’s value dilution accelerates.
Transactions: Even in the presence of export surpluses, if companies continue to delay converting export proceeds, the supply of dollars in the foreign exchange market tightens.
Demand: The net buying of overseas stocks by individuals and institutions continuously draws in dollars.
If these three links work simultaneously, the USD/KRW remains fixed at a high level even if the Dollar Index stays calm.
6) 2026 Exchange Rate Scenario|Approaching 1600 vs. Approaching 1350, Which Factors Dictate the Direction?
Upper Trigger (Approaching 1600): Domestic M2 growth rate remains high relative to the United States, interest rate cuts widen the interest rate differential, a global risk-off scenario reemerges, companies continue to delay converting export proceeds, and there is a surge in net buying of overseas stocks.
Lower Trigger (Approaching 1350): Korea manages to keep its M2 growth rate below that of the United States, the Bank of Korea maintains a hawkish stance with liquidity management, incentives are provided for the conversion of export proceeds, foreigners switch to net buying of physical assets, and policy-driven swap lines are expanded.
In conclusion, the exchange rate is sensitive not only to “U.S. variables” but also to the “speed of domestic liquidity policy adjustments.”
From an economic outlook perspective, one should not only consider interest rates and inflation but also focus on the turning points of monetary indicators.
7) Proposed Policy Framework|Let the Pension Act as the Pension, and Treat the Exchange Rate as a Policy Tool
The National Pension must prioritize its legal objective of maximizing long-term returns.
Exchange rate stability should be managed by the Bank of Korea and the Ministry of Economy and Finance through monetary, fiscal, and macroprudential measures.
Practical tools: M2 growth management, short-term liquidity absorption, incentives for converting export proceeds, expansion of exchange rate fluctuation insurance, fine-tuning of currency swap lines between banks, pension funds, and public enterprises, and enhanced FX hedge guidelines.
This combination can mitigate exchange rate volatility without conflicting with the pension’s objectives.
8) Checklist for Corporate and Individual Response Strategies
For export and import companies: diversify settlement currencies, combine forward contracts and options for hedging, manage KPI for exchange rate exposure, and strengthen natural hedging by matching foreign currency deposits with KRW liabilities.
For investment portfolios: even if increasing the proportion of overseas stocks, operate hedged and unhedged products separately according to cycles.
For cash management: adjust the proportion of short-term bonds and MMFs in anticipation of falling interest rates, and diversify with products, REITs, and dividend stocks as an inflation hedge.
For risk management: reduce leverage during periods of increased volatility and perform backtests on scenarios of dollar-KRW correlation reversal.
Investment decisions are each party’s responsibility, and this article does not constitute investment advice.
9) The Connection with AI Trends|AI Capex, Dollar Demand, and the KRW
The AI infrastructure investments (Capex) by hyperscalers create large-scale demand for dollar settlements.
Korea benefits from exports of HBM, foundry, equipment, and materials, but increased dollar settlements in equipment and IP licenses can offset these gains.
Domestic funds easily flow overseas through AI big tech and semiconductor ETFs, which adds pressure on KRW weakness.
Stablecoins and digital dollar liquidity accelerate the speed of cross-border settlements, potentially increasing short-term fluctuations in foreign exchange supply and demand.
In conclusion, the AI investment boom has a dual effect as both a “growth momentum” and an “increase in dollar demand,” and without liquidity management, it is difficult to expect reduced exchange rate volatility.
10) One-Line News Summary
It is the speed of M2 liquidity, not the Dollar Index, that determines the exchange rate level.
Even with an external surplus, the market does not receive sufficient dollar supply due to delayed conversion, resulting in a persistent KRW weakness.
The National Pension is not an exchange rate stabilizer, and the solution lies in a combination of managing the speed of liquidity and fine-tuning market-friendly policies.
11) The Most Important Point That Other Media Rarely Mention
The USD/KRW level primarily reacts to the relative speed of M2 growth between the United States and Korea.
The equation ‘export surplus = strong KRW’ falls apart if companies continue to delay converting their foreign currency earnings.
The National Pension, due to its legal mandate, prioritizes long-term returns over exchange rate stability, and only auxiliary, market-friendly fine-tuning is possible.
The AI Capex cycle can structurally increase dollar demand, prolonging the pressure on KRW weakness.
Therefore, managing the M2 growth rate becomes as important as interest rates and inflation in informing both policy and investment decisions.
12) Keyword Watchpoints
Economic Outlook: The exchange rate level is determined by turning points in domestic liquidity policy.
Exchange Rate: Manage the checklist of triggers between the 1600 upper trigger and the 1350 lower trigger.
Interest Rates: A widening interest rate differential stimulates KRW weakness, making the speed of adjustment crucial.
Inflation: Import prices could reignite inflationary pressures, so managing inflation expectations is necessary.
Economic Downturn: A rapid surge in the exchange rate poses downside risks to the real economy and consumption, making policy timing essential.
13) Actionable Checklist
M2 Monitoring: Check monthly whether the gap between Korea’s and the United States’ M2 growth rates is narrowing.
Remittance Flow: Monitor the conversion ratio of export proceeds and trends in corporate foreign currency deposits.
Supply and Demand Indicators: Observe the pace of net buying in both spot and futures by foreigners and net buying of overseas stocks by individuals and institutions.
Policy Events: Pay attention to the liquidity management tone in the Bank of Korea minutes and announcements regarding exchange rate fluctuation insurance and tax incentives by the government.
AI Cycle: During the AI Capex guidance season, check whether there is an upward shift in dollar demand.
< Summary >
The high valuation of the USD/KRW is not due to a strong dollar but rather the inherent weak KRW.
The main reason is that Korea’s M2 liquidity supply speed has been faster than that of the United States.
Despite a trade and current account surplus, delayed conversion of foreign exchange by companies and expanded overseas investments have tightened dollar supply in the market.
The National Pension is not an exchange rate stabilizer, and the remedy lies in controlling the speed of M2 growth combined with fine-tuning market-friendly policies.
The 2026 scenario is driven by turning points in liquidity and changes in supply-demand dynamics.
[Related Articles…]
KRW Weakness Era: A Liquidity Management Checklist
The Impact of AI Capex on the Exchange Rate: An Overview
*Source: [ 경제 읽어주는 남자(김광석TV) ]
– ‘원화약세’ 환율불안의 진짜 이유. 정말 국민연금과 서학개미 때문인가? 유동성(M2) 공급속도 때문이다. [경읽남 221화]