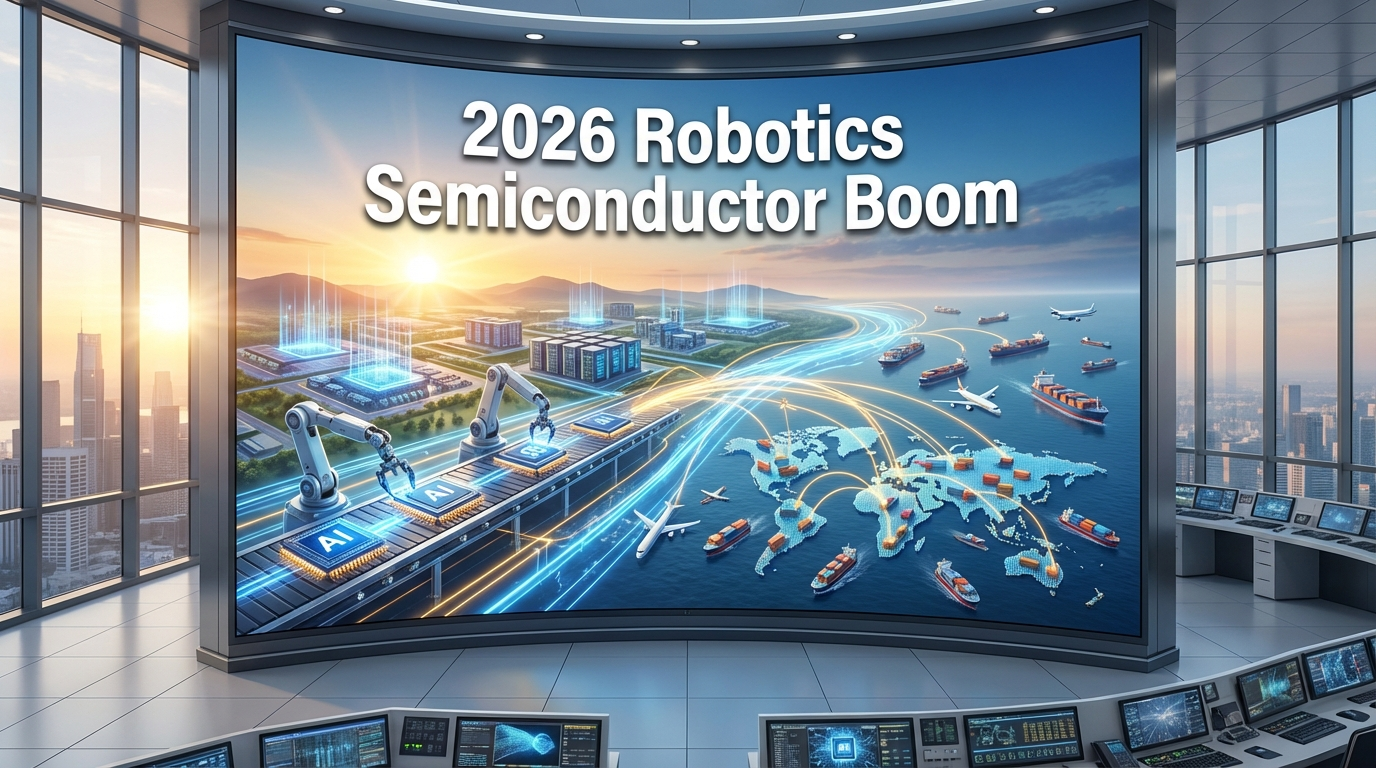
● Robot, Chip Goldrush
2026 Robot & Semiconductor Mega Cycle, Hyundai Motor’s ‘Robot Foundry’ Hypothesis, SME ETF Strategy, Korea’s Benefit from China-Avoidance Demand, and Even Earnings Gap Trading Methods Are All Included.
The well-known robot and semiconductor trend theory already recognized in the market has been organized in a news format, and a checklist detailing where to look and what to buy has been specified.
We cover everything at once, from Hyundai Motor Group’s Physical AI and Robot Foundry strategy, Hyundai Mobis’s actuator development, HL Mando’s robot business public event on December 11, the shift in demand from pure KOSDAQ robot stocks to automobile parts stocks, to the impact of interest rates, exchange rates, and inflation on stock market valuations.
Breaking News Summary: Key 2026 Investment News Points
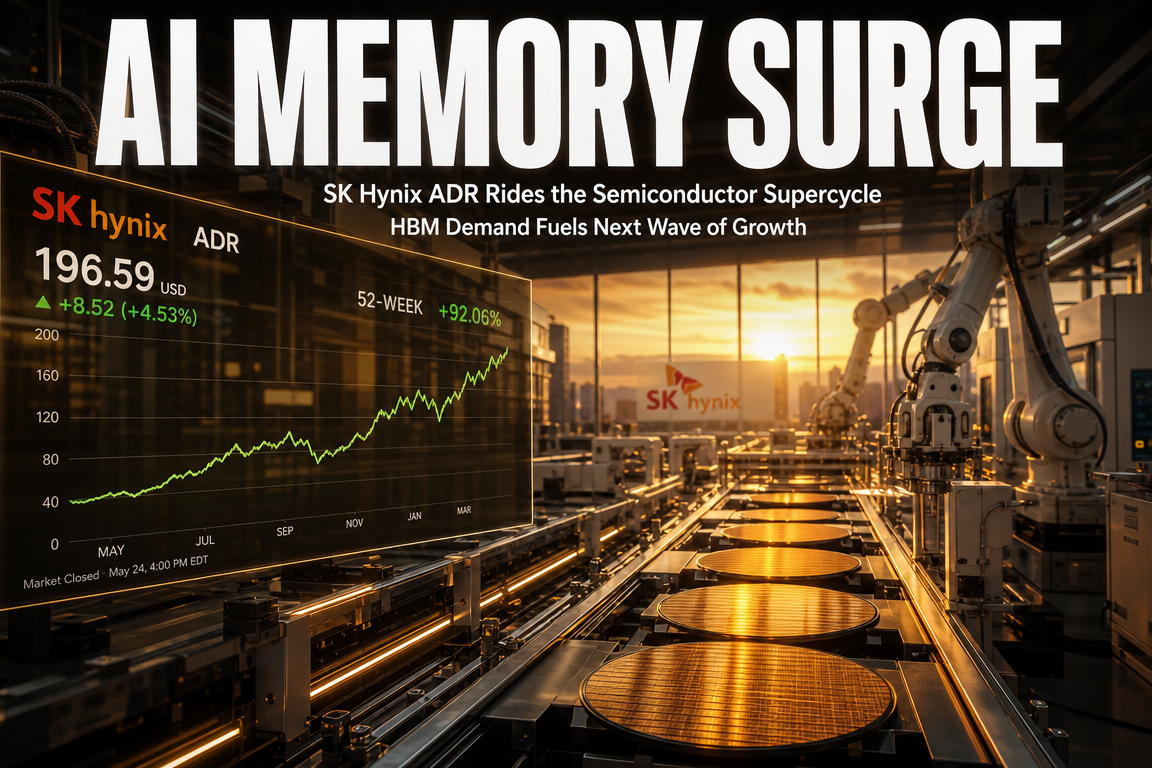
- Semiconductors remain the number one theme, and the possibility of demand spreading from large-caps to small- and medium-sized parts, equipment, and materials is growing.
- Robots are entering the mega trend in 2026, and the value chain is expanding not only in pure KOSDAQ robot stocks but also in automobile parts manufacturers.
- Hyundai Motor Group is pursuing Physical AI and Robot Foundry, while Hyundai Mobis has formalized the development of actuators for humanoids.
- HL Mando is drawing attention by announcing that it will reveal its robot business roadmap at the CEO Investor Day on December 11.
- Chinese robots and components may see substitute demand due to security and policy risks, and Korea is emerging as a strong alternative supply chain.
Macro Framework: The Real Impact of Interest Rates, Inflation, and Exchange Rates on Valuations
Falling interest rate phases provide room for valuation expansion in growth sectors.
Slowing inflation simultaneously leads to margin stability and lower discount rates, which is favorable for the overall stock market.
Exchange rate fluctuations have a direct impact on the performance of robotics and semiconductor parts, equipment, and materials stocks with high export ratios, as well as on foreign investor flows.
At the beginning of the economic cycle, re-rating often occurs based on “stories rather than earnings,” and in the mid-cycle, adjustments can be significant if the numbers do not validate the story.
Therefore, in the first half of 2026, it is effective to maintain a core of growth stocks while using periods of earnings gaps and increased volatility as opportunities for phased buying.
Sector 1: Semiconductors – Demand Spread from Large-Caps to SME Companies
- Point 1: The demand concentration, which had been focused on large memory companies until 2025, is likely to spread to materials, parts, and equipment (SME) and small- and medium-caps in 2026.
- Point 2: Due to the high difficulty in uncovering individual opportunities, it is efficient to use an ETF focused on Korean semiconductor parts, equipment, and materials as the core, with alpha generated from a few small satellite positions in individual stocks.
- Checklist: Check the proportion of North American and European customers, exposure to AI HBM, COWOS, and packaging, experience with cost-saving material substitutions, references that have contributed to yield improvements, as well as exchange rate sensitivity and hedging policies.
- Risk: There is a time lag between capacity expansion for equipment and its translation into sales, and volatility tends to be high before and after earnings announcements.
Sector 2: Robots (Humanoid & Physical AI) – Automobile Parts Companies Become the New Main Players
- Hyundai Motor Group: There are signs that they are putting physical AI and robotics at the forefront and attempting to build mass-production infrastructure under the concept of a “robot foundry.”
- Hyundai Mobis: They have formalized the development of actuators for humanoids, even discussing the possibility of a split model for design and production.
- HL Mando: By announcing that they will reveal their robot business at the CEO Investor Day on December 11, an event-driven approach opportunity has emerged.
- Change in Demand: The benefits from robotics are spreading from pure KOSDAQ robot stocks to automobile parts stocks.
- Why Korea: As the tendency in the U.S. and other advanced countries to avoid Chinese components strengthens, there will be a need for alternative supply chains to reduce reliance on certain key Japanese components (e.g., reducers), and Korea’s expertise in automotive electronics, motors, and control technology can fill that gap.
A Key Point Not Often Addressed Elsewhere: The Positive Feedback Loop of “Market Cap – ETF – Institutional Investors” and the Economics of the Robot Foundry
- The Power of Market Cap: For an industry to grow, the market capitalization of key representative stocks must first increase, which in turn leads to the creation of themed ETFs and the structuring of institutional inflows.
- Foundry Economics: While complete robot companies may experience volatile demand, “supply chain core” components such as foundries, modules, actuators, and reducers benefit from economies of scale that lower costs and secure a steady revenue pipeline.
- Strategic Implication: Rather than chasing the sudden rise of blue-chip stocks, it is advantageous to select potential cash cows at the module and component level and ride the ladder of “market cap growth → index/ETF inclusion → multiple expansion.”
- Policy Premium: Companies that receive non-Chinese supply chain certification due to security and reliability issues may receive a multiple premium.
Practical Checklist: Selecting Companies to Benefit from 2026 Robots and Semiconductors
- Technological Positioning: Check where the strengths lie among actuators, BLDC motors, reducers, torque sensors, servo drives, and control software.
- References: Check for joint development, sample deliveries, and whether the project is in the mass-production PoC stage with Hyundai Motor Group, global OEMs, or Tier 1 companies.
- Unit Price & Cost: Assess whether they have material internalization, precision processing capabilities, and effective yield management.
- Orders & Backlog: Pay attention to whether robotics-related order backlogs are separately disclosed in Investor Day presentations or quarterly earnings commentary.
- CAPEX Plan: Check the capacity expansion plans and equipment acquisition timeline within the next 12–24 months.
- Currency Exposure: Examine the KRW/USD exchange rate sensitivity, hedging policy, and export ratio.
- Governance: Review related party transactions, the proportion of internal dealings, and the risk management system for technology leaks.
ETF Strategy: Core-Satellite Basket
- Core: Secure base exposure with a Korean Semiconductor Parts, Equipment, and Materials ETF, and a Global Robotics & AI Hardware ETF.
- Satellite: Tactically add individual stocks during event-driven momentum periods (e.g., HL Mando Investor Day), new product or order announcements, and policy announcements.
- Rebalancing: If volatility expands before or after earnings announcements, reduce weight; increase weight upon upward guidance or confirmation of major customers.
China Avoidance Demand and Korea’s Opportunities
Security concerns are growing in the U.S. and elsewhere regarding the use of Chinese components in household and service robots.
While Chinese companies may dominate the domestic market, alternative supply chains will be needed in regions outside of China.
Even if certain Japanese components continue to perform strongly, there is significant potential for Korea’s automotive electronics, motor, and control companies to ramp up in the area of humanoid specialized parts.
Korean companies can earn a premium in certification, quality, delivery, and security, which may be reflected in higher stock market multiples.
Timing Guide: The “Numbers Gap” Is an Opportunity
Currently, during the infrastructure-building phase, numbers may not appear clearly on performance statements.
If adjustments occur during the earnings season due to the absence of numbers, as long as the story does not collapse, it becomes a point for phased buying.
However, given the high volatility, it is essential to manage position sizing and maintain adequate cash holdings.
Risk Management: Volatility, Rumors, Liquidity
Rule 1: Instead of chasing short-term surges driven by rumors, target the revaluation phase after the event.
Rule 2: Dilute individual stock risk with ETFs, and set clear stop-loss rules for satellite positions.
Rule 3: For stocks with thin liquidity, consider execution risks and avoid overreacting to intraday news.
Monitoring Calendar
- December 11: Check the HL Mando CEO Investor Day for updates on the robot business.
- Quarterly Earnings: Monitor Hyundai Mobis’s comments on actuators and robotics, and check for order backlog disclosures.
- Policies/Regulations: Watch for changes in U.S.-China technology regulations, security standards, and robotics certification systems.
- Exchange Rate/Interest Rates: Observe the impact of sharp movements in the KRW/USD exchange rate and interest rate direction on stock market multiples.
Portfolio Example (Idea)
- Core 60–70%: A Semiconductor Parts, Equipment, and Materials ETF + Global Robotics/AI Hardware ETF.
- Satellite 30–40%: Hyundai Motor Group value chain (Hyundai Mobis, related parts stocks), robot component companies currently under validation, event-driven positions.
- Rebalancing: Adjust weighting when volatility increases before and after events, and increase core weighting once numbers are confirmed.
Summary Conclusion
The keyword for 2026 is the simultaneous expansion of robots and semiconductors.
Demand is spreading from large-cap stocks to parts, equipment, and materials companies and small- and medium-caps, with automobile parts companies emerging as new key players in the robotics value chain.
China avoidance demand can increase the premium on the Korean supply chain, and interest rates, inflation, and exchange rates directly affect stock market valuations.
The volatility during the numbers gap can be an opportunity, and a strategy of core ETF plus satellite alpha is effective.
Practical Q&A One-Liner Tips
- Why robots now?
→ It is the initial phase where the spread of physical AI aligns with the establishment of mass production systems by OEMs, creating a “foundry-type supply chain.” - What are the criteria for evaluating a parts, equipment, and materials ETF?
→ Look at the top 10 holdings, TER, tracking error, trading volume, and the specific exposures within semiconductors. - What should you do if the exchange rate rises?
→ While export stocks may see upward revisions in profit estimates, due to significant fluctuations in foreign investor flows, a phased approach is safer.
< Summary >
- The core of 2026 is the simultaneous expansion of robotics and semiconductors, and the spread of demand to parts, equipment, and materials plus small- and medium-cap stocks.
- Hyundai Motor Group’s Physical AI and Robot Foundry, Hyundai Mobis’s actuators, and the HL Mando event are key triggers.
- China avoidance demand can increase the premium on the Korean supply chain.
- Macroeconomic factors such as interest rates, inflation, and exchange rates directly affect stock market valuations.
- Core ETF + satellite alpha, phased buying during numbers gaps, and an event-driven approach are effective.
[Related Articles…]
- Robot Investment 2026 Strategy at a Glance
- Semiconductor Parts, Equipment and Materials ETF Checklist
*Source: [ Jun’s economy lab ]
– 2026년 이 주식만 사면 됩니다.(ft. 염승환3부)
● Code Red, AI Chip War
OpenAI “Code Red”: The Real Meaning – Google’s TPU Offensive and the Three-Pronged Battle of Models, Platforms, and Chips
This article covers OpenAI’s internal “Code Red” directive, the surge in users of Google’s Gemini 3, TPU external supply strategy and CUDA countermeasures, data center power and cooling bottlenecks, and the sectoral impacts from an investor’s perspective.
In particular, it separately summarizes the point that “power, cooling, and software migration matter more than chip counts” which other news outlets overlook.
It links the trends in the global economy with the semiconductor supply chain, data center expansion, stock market sentiment, and inflation/interest rate factors.
Key Briefing
Reports have emerged that OpenAI has issued an internal “Code Red” directive.
The background is that Google’s Gemini 3 rapidly expanded its market share immediately after its launch, spearheading simultaneous offensives in models, platforms, and chips.
Google aims to reduce reliance on NVIDIA GPUs by expanding production of its own AI chip, the TPU, and increasing external supply.
Industry estimates say NVIDIA supplies 9 to 10 million GPUs annually, while Google is rumored to target production of 3 million TPUs in 2026 and 5 million TPUs in 2027.
Google is preparing a new management software (tentatively called “TPU Command Center”) that directly targets the CUDA ecosystem.
This trend directly relates to semiconductor leadership, data center investments, power supply, global economic trends, and the flow of funds in the stock market.
Why “Code Red” Now?
Reports indicate that OpenAI’s internal directive is to focus resource allocation on “improving the latest GPT”.
The immediate trigger is the improved usability, speed, multimodal performance, and rapid proliferation of Google’s Gemini 3.
According to Google’s announcement, it was mentioned that Gemini’s monthly active users have exceeded 650 million, and the combination of channels like YouTube, search, and Android has accelerated its spread.
This signals that it is not only model performance but also “deployment capability and platform leverage” that determine competitive advantage.
Model Competition: Gemini 3 vs GPT
Gemini 3 is receiving increasing praise for its code comprehension, reasoning, and multimodal (text, image, audio, video) capabilities.
Some real-user reviews reported opinions such as “I was accustomed to GPT, but after trying Gemini, it’s hard to go back.”
OpenAI appears to be going all-in on reclaiming its quality gap through a major update.
The quality gap between models is narrowing, and factors such as deployment channels, pricing (token costs), API convenience, and partner ecosystems are now determining adoption.
Platform Competition: Google’s Full Stack vs OpenAI’s Service Power
Google is a full-stack player that can seamlessly integrate AI onto its platforms such as search, YouTube, Android, Chrome, and Workspace.
With bundled advertising revenue, data assets, and device/OS layers, it has a structural advantage in monetization and adoption speed.
OpenAI, with ChatGPT, absorbs user feedback at the frontline and flexibly expands through its enterprise and developer APIs.
Ultimately, it is viewed that the long-term outcomes will be determined by the showdown between Google’s platform diversification and OpenAI’s product concentration.
Chip Competition: TPU vs NVIDIA GPU
NVIDIA remains an absolute powerhouse in terms of performance, software (CUDA), and ecosystem.
However, Google’s strategy of mass-producing and externally supplying TPUs is rapidly emerging as an alternative in terms of cost, supply chain, and optimization.
There are cases where some large models have already been trained using TPUs, challenging the notion that “the best AI runs on NVIDIA”.
The key point is that the essence of the compute war is shifting from “chip performance” to “total computational cost and supply certainty.”
TPU External Supply and Ecosystem Strategy
Until now, TPUs could only be used within Google Cloud, but reports of evaluating on-premises supply have signaled a game changer.
Companies like Meta, as well as those in finance and fintech with their own data centers, may prefer on-premises TPUs due to data sovereignty and security concerns.
It is reported that Google is concurrently pursuing aggressive supply measures, such as partnering with small cloud providers (e.g., companies known like FluidStack in London) and offering financial guarantees.
The management software called “TPU Command Center” is interpreted as Google’s operating stack that reduces on-premises operational difficulties and decreases dependency on CUDA.
Economic and Market Impacts: Semiconductors, Data Centers, Power, and Policy
Demand for high-bandwidth memory (HBM), packaging, optical modules, and power semiconductors in the semiconductor supply chain is surging simultaneously.
Data center expansion is driving investments in power infrastructure and cooling (from air to liquid cooling), and even impacting buildings, real estate, and utilities.
On a global economic scale, the AI facility investment (Capex) cycle introduces seasonality to growth rates of specific countries, trade balances, and investments in telecommunications and power grids.
In terms of inflation and interest rates, demand for AI infrastructure could drive equipment and power prices, potentially becoming a variable affecting regional price pressures.
In the stock market, upward revisions of profit estimates and revaluation of AI beneficiary stocks continue, although supply chain bottlenecks may increase performance volatility.
Investment Perspective: Sectoral Checkpoints
Chip design and packaging: While NVIDIA remains central, the spread of TPUs could benefit OSAT, interposer, and CoWoS line expansions.
Memory and HBM: As model parameters grow larger, the adoption of HBM and the demand for hybrid memory architectures structurally increase.
Data center infrastructure: The value chains for substations, UPS, cooling, racks, powertrains, and cabling are long-term beneficiaries.
Cloud and platforms: If TPU alternatives become feasible, cloud price competition and product diversification will intensify.
Software and MLOps: There are opportunities in multi-backend orchestration that reduces dependency on CUDA and in toolchains for model optimization (compression and quantization).
Execution Checklist for Companies
Workload classification: Separate training and inference, and recalculate the TCO for GPUs, TPUs, CPUs, and NPUs.
Multi-backend strategy: Consider compatibility with XLA, OpenXLA, and compiler stacks to avoid being locked into CUDA.
Cost optimization: Reduce token costs through prompt engineering, context optimization, and localizing caches and knowledge bases.
Data sovereignty: Align regulatory, security, and latency requirements among on-premises, cloud, and hybrid environments.
Power and cooling planning: Secure power contracts and switch to advanced cooling (liquid immersion/direct liquid cooling) proactively based on a 24-month demand forecast.
The “Real Core” That Others Don’t Mention
Power and cooling equate to performance.
The speed of transitioning data center power density and cooling methods, rather than chip counts, determines the pace of model deployment and operation.
Failure to secure power contracts directly leads to service delays, which can deal a blow to market share.
The hidden costs of software porting are a potential expensive bomb.
Migrating from CUDA to TPU/XLA requires code porting, kernel optimization, and retraining engineers, translating into several months’ worth of labor and time costs.
Tools like the “TPU Command Center” aim to lower these barriers, and establishing a tooling standard will be the next battleground.
The geography of inference becomes crucial.
Since video and real-time services are sensitive to latency, dispersing edge and regional data centers can alter cost curves.
In this context, on-premises TPU alternatives could quickly gain adoption momentum in sectors such as finance and public services.
6 to 12-Month Outlook Scenarios
Base scenario: Google gradually expands external TPU supply, and Gemini 3 becomes deeply integrated into Android and Workspace.
OpenAI concurrently updates its next-generation GPT and reduces inference costs.
Optimistic scenario: With alleviation of HBM and packaging bottlenecks, both camps see improvements in compute procurement, and mature multi-backend compatible tools lower transition costs.
Risk scenario: Delays in power and cooling infrastructure, stricter regional regulations/export controls, and AI safety issues could delay large-scale rollouts.
Points to Watch
Google’s TPU on-premises commercial contract agreements—their sizes and initial reference customers.
The timing of OpenAI’s next-generation model release and its token pricing strategy.
NVIDIA’s software stack expansion strategy and changes in partner financing.
News concerning HBM pricing/supply, CoWoS capacity expansions, power grid investments disclosures, and utility contracts.
News-style Summary
OpenAI issues internal “Code Red” reports.
Shifting focus to concentrate resources on the latest GPT improvements.
Google accelerates its pursuit with Gemini 3 user expansion and platform integration.
Google counters NVIDIA with its mass production and external supply strategy for TPUs.
Challenging the CUDA ecosystem with operational software like the “TPU Command Center”.
Data center power, cooling, HBM, and packaging bottlenecks are key variables.
The AI investment cycle stimulates the frontiers of semiconductors, power, cloud, and optical modules.
One-Page Investment Checklist
Semiconductors: Check the demand pipeline for HBM, packaging, testing, and interposers.
Data Centers: Review order backlogs and margin trends for power, cooling, and rack vendors.
Cloud: Compare TPU option launches, pricing strategies, and the scope of multi-model support.
Software: Assess the maturity of multi-backend MLOps and model optimization tooling.
Macro: Track how inflation and interest rate trends affect data center Capex.
< Summary >
OpenAI’s “Code Red” represents both a defense against and a signal of resurgence in response to Google’s three-pronged offensive in models, platforms, and chips.
Google is bolstering its full-stack advantage by mass-producing and externally supplying TPUs, and by using operational software to challenge dependency on CUDA.
The true battleground is the management of the “hidden costs” of power, cooling, and software migration.
While semiconductors, data centers, and power infrastructure may simultaneously benefit, supply chain and regulatory risks are also growing.
Over the next 6 to 12 months, key checkpoints will include on-premises TPU references, OpenAI’s next-generation models, and HBM and power metrics.
[Related Articles…]
TPU War: The Impact of Google’s Chip Strategy on NVIDIA’s Stock
The Rapid Growth of Gemini 3 and the Reshaping of Search Advertising
*Source: [ Maeil Business Newspaper ]
– 오픈AI, 코드 레드 발령 | 실리콘밸리뷰 | 원호섭 특파원
● Japan Photoresist Chokehold Strangles China AI Chip Hopes
The true reason why China’s rare earth card does not work on Japan, the AI semiconductor supply chain shaken by ‘photoresist’, and investment checkpoints.
This article contains four key points.
First, the precise ripple effects that the scenario of Japan’s photoresist export control will have on AI semiconductors and the global supply chain.
Second, the structural reasons why China’s rare earth card does not work on Japan and the systems for substitution and recycling.
Third, an investment scenario in which interest rates, inflation, and supply-demand converge amid a ‘high-intensity cooling, low-intensity collision’ phase.
Fourth, the points overlooked by other media: Japan’s economic security legislation and material dominance, as well as the hidden bottlenecks in packaging and essential materials.
[News Briefing] Key points on geopolitics, essential materials, and AI summarized at once.
Compiled based on remarks captured on December 4.
Although China unveiled footage of its hypersonic missile, ostensibly targeting Japan, the message is more of a warning directed at allies such as the United States and South Korea.
The state is defined as ‘high-intensity cooling, low-intensity collision’.
It signals an intent to avoid direct confrontations while normalizing limited clashes and supply chain disruptions.
Japan holds the control card for photoresist and related essential materials aimed at targeting vulnerabilities in Chinese semiconductors.
If key materials are blocked, the pace of China’s transition in advanced process technologies will slow down.
This reaffirms the view that China’s rare earth card is unlikely to work on Japan.
Since the 2010 Senkaku incident, Japan has built a diversification, stockpiling, and recycling ecosystem, making its dependence on China one of the lowest among major nations.
1) Interpretation of Geopolitical Signals: From “Show-Off” to “Tightening the Noose”.
The unveiling of a hypersonic missile should be seen more as part of a sustained strategy that includes economic and technological pressure, rather than merely a demonstration of military capability.
Direct confrontations are costly, so it is a pattern to undermine alliance cohesion by pressuring soft power sectors such as semiconductors, materials, data, and logistics.
From an investment perspective, more weight should be given to the incremental cumulative effects of policies and sanctions rather than a one-off event shock.
2) Japan’s ‘Photoresist’ Card: Why It Is Lethal.
Photoresists are categorized by processes such as EUV, ArF, and KrF, and Japanese companies have formed an oligopolistic structure in terms of both global market share and quality.
The leading players include JSR, Tokyo Ohka (TOK), Shin-Etsu, and Sumitomo groups, extending their influence to related sub-materials such as pellicles, developers, photomasks, and wafer cleaning.
China still lags behind in terms of performance consistency and process reliability.
In particular, EUV resist and pellicles are nearly irreplaceable, meaning that export controls will delay the transition to advanced processes and yield stabilization.
In AI semiconductors, packaging yield and the precision of the photolithography process determine the performance of advanced packaging solutions such as HBM and CoWoS.
Therefore, control of photoresists can shake even the GPU supply chain and the timing of cloud investments.
3) The Structure That Makes China’s Rare Earth Card Ineffective on Japan.
In the case of rare earths, bottlenecks occur in separation, refining, and magnet processing rather than mining.
Since 2010, Japan has mitigated risks by sourcing from Australia and Southeast Asia, stockpiling under government leadership, and systematizing high-performance magnet recycling.
Companies such as Daido and Hitachi Metals (now Proterial) have accumulated world-class process know-how in high-performance magnetic materials and magnet components.
Even if China’s export controls are strengthened, Japan has mechanisms in place to absorb the shock through long-term contracts, recycling, and alternative materials.
In conclusion, the formula ‘rare earths equal Japan’s Achilles’ heel’ no longer holds true.
4) Global Economic Outlook and the Impact on Inflation and Interest Rate Trajectories.
Under the baseline scenario, supply chain reorganization has already been reflected in prices, resulting in a moderate overall inflationary pressure.
However, items that are difficult to substitute, such as rare earth oxides, magnets, photoresists, and pellicles, may experience cycles of event-driven price spikes followed by inventory restocking.
While central bank rates have been adjusted in line with a decline in core inflation, there is a need to moderate the pace due to the geopolitical risk premium.
Thus, the path to interest rate cuts is gradual, and the price risks of individual items spur hedging demand, increasing volatility.
5) AI Trend Update: The Bottleneck Is Not the Chip, But ‘Materials + Packaging’.
While GPU demand remains robust, the real bottleneck lies in advanced packaging elements such as HBM, ABF substrates, CoWoS, and Foveros, as well as the preceding stages including resists, pellicles, and cleaning.
The roles of Japan and South Korea become increasingly significant.
South Korea is strengthening its supply capabilities in HBM and advanced packaging, while Japan holds key materials such as resists, substrates, and gases.
Although China may try to circumvent this with data center investments and edge AI, building a complete ecosystem for advanced process technologies and packaging for high-end model training remains the key.
In conclusion, the speed of the AI cycle is more likely to be determined by material and packaging yields than by the semiconductor chips themselves.
6) The Most Important Point Overlooked by Other Media.
First, following Japan’s ‘Economic Security Promotion Act’, the drive for nationalizing and public-private partnerships in essential materials (M&A) has accelerated, drawing greater global price-setting power for certain items toward Japan.
Second, the leverage that exceeds that of photoresists lies in pellicles, high-purity hydrofluoric acid, special gases, slurries, and cleaning equipment.
Third, the battle for rare earths is not about mining volumes but rather the capacity for separation and refining and the recycling rate of high-performance magnets.
Fourth, China’s true Achilles’ heel lies in advanced packaging and the IP/EDA ecosystem, where any gap directly translates into an AI performance gap.
7) Scenario Map: Investment and Risk Checklist.
Baseline Scenario.
Sanctions and controls will expand incrementally, but conflicts will be managed.
The global economic outlook is for moderate growth, inflation will gradually ease, and interest rates are likely to follow a phased reduction path.
Investment in AI semiconductors and cloud capex will be maintained, but HBM, packaging, and materials will hold price negotiation power.
Deterioration Scenario.
If short-term controls are activated for critical items such as photoresists and pellicles, AI GPU lead times will increase and sudden spikes or drops in specific items will intensify.
Rare earth magnet prices may experience repeated cycles of spikes followed by readjustments.
Mitigation Scenario.
If commercialization of alternative materials and diversification progress within China, volatility will decrease, but the material premium held by Japan and South Korea will be maintained.
8) Sector and Theme Ideas and Risk Management.
Materials & Essential Components.
Follow long-term trends in photoresists, pellicles, cleaning and CMP slurries, special gases, ABF substrates, and HBM-related chemicals.
Packaging.
CoWoS, 2.5D/3D packaging, test handlers, and thermal solutions are beneficiaries.
Defense & Security.
They have high dispersion efficiency as buffers against geopolitical uncertainties.
Risks.
Pay attention to volatility based on policy headlines, event-driven inventory cycles, and fluctuations in exchange rates and raw material prices.
9) ‘News Timeline’ Summary.
China intensifies psychological pressure by unveiling hypersonic missiles.
Japan maintains an indirect pressure card through key materials in advanced processes such as photoresists.
China’s rare earth card is blocked by Japan’s wall of diversification, stockpiling, and recycling.
The real bottleneck in the AI semiconductor cycle is materials and packaging, and supply chain reorganization continues.
10) Action List to Check Now.
Supply Chain.
Monitor the expansion capex and lead times of companies related to resists, pellicles, ABF, and HBM.
Prices.
Check the monthly trends of price indices for rare earth oxides, magnets, special gases, and pellicles.
Policy.
Monitor updates to Japan’s economic security legislation, changes in U.S. export controls, and China’s material export restrictions.
Macro.
Examine on a monthly basis how changes in core inflation, logistics costs, and the interest rate curve affect valuations.
Conclusion: It Is the ‘Tightening of the Noose’ Rather Than ‘Show-Offs’ That Moves the Market.
The battle is not fought through demonstrations of force, but in areas that seem invisible, such as materials and packaging.
Japan uses photoresists and economic security as weapons, while China responds with selective controls and circumvention strategies.
Investors should seek alpha in the realm of essential components and supply chain restructuring, which is one step ahead of semiconductors, while keeping a close eye on the pace of inflation and interest rates.
< Summary >
China’s military signals serve as indirect pressure on its entire network of allies, with the real battle taking place within the supply chain.
Japan’s dominance in photoresists and pellicles determines the pace of the AI semiconductor cycle.
China’s rare earth card is constrained by Japan’s diversification, stockpiling, and recycling structure, thus limiting its effectiveness.
The baseline scenario envisions moderate growth and gradual interest rate cuts, while risks of item-specific inflation remain.
Alpha is generated from bottlenecks in areas such as materials, packaging, HBM, and ABF.
[Related Articles…]
*Source: [ 달란트투자 ]
– 희토류 들먹이다 개망신. 중국 이제 망할 일만 남았다 | 조의준 대표 1부