● Robot Takeover, AI Goldrush, IPO Frenzy
2026 Leading Stock Candidates Overview: Robotics, AI, Space, and the True Signals of the IPO Cycle
Today’s article covers: 1) Why the Trump Administration’s “push for robots” is the prelude to the leading stocks of 2026; 2) Which groups of stocks, not only Tesla and NVIDIA but also Japan’s top-tier robotics parts companies, are structurally favorable; 3) Win–loss scenarios by asset class based on the FOMC interest rate cut path; 4) The mechanism by which an IPO rush in 2026 could signal a market peak; 5) The reason why AI, robotics, and space data centers are connected as one. It all comes together here.
It summarizes the global economic outlook, interest rate cut expectations, robotics industry, artificial intelligence, and IPO keywords all at once.
This Week’s Market Headlines Check
With Trump’s trigger for robot trading being re-energized, stocks related to robotics, automation, and logistics showed widespread strength.
Economic indicators were more solid than expected, with short-term rebounds observed in sectors sensitive to the economy, such as reopening and consumption.
Ahead of the December FOMC, although the possibility of an interest rate cut is high, uncertainty over additional cuts in 2025 has increased volatility for small-to-mid-cap and liquidity-sensitive assets.
Policy Changes: Why Robots Are the Next Target
The U.S. Department of Commerce has been holding a series of meetings with robot CEOs, and with ongoing reviews of administrative orders related to robotics, clear policy-driven signals have emerged.
The external rationale is “containing China” and “reshoring manufacturing.”
The domestic logic is “alleviating inflationary pressures” and “resolving the skilled labor shortage.”
Practical support measures such as regulatory sandboxes, procurement/tax credits, and the revision of safety standards are likely to be implemented.
US and Japan Dual Focus: Updated Map of Stock Groups
U.S. large-cap leaders: Premiums remain on U.S. leaders such as Tesla (humanoid robots, autonomous driving), NVIDIA (robotic stacks, edge AI), and Alphabet (DeepMind, robotics research).
U.S. mid-cap group: Service/logistics robotics, machine vision, sensor/actuator, and automation software companies are highly sensitive to thematic trends.
Japan’s dominant parts: Companies such as FANUC (industrial robots), Harmonic Drive (precision reducers), Nabtesco (medium-to-large reducers), and Yaskawa Electric (servo and motion control) form a top-tier trio in “joints, reducers, and motors.”
Using ETFs: Global robotics ETFs (BOTZ, ROBO), Japanese robotics ETFs, and ETFs with exposure to AI infrastructure and HBM enable phased diversification.
Caution: There is increased risk in chasing short-term surges; applying principles of dollar-cost averaging and time diversification remains effective.
Musk’s Signal: The Productivity Singularity and the Trajectory of Inflation and Interest Rates
The argument is made that once robots are capable of building robots, productivity will outpace the growth rate of the money supply, potentially leading to structural disinflation.
When labor substitution accelerates, unit production costs will drop sharply, and the long-term equilibrium interest rate may converge toward zero.
Policy implications: This approach could intensify efforts to offset inflation and debt challenges with technological productivity.
Investment implications: Core robotics components, manufacturing automation, and AI edge computing have significant potential for long-term multiple re-rating.
Automotive Regulation Easing: Compact Cars, Price Elasticity, and Tesla
Easing fuel efficiency and vehicle class regulations can lower the average vehicle price and contribute to price stability.
While the demand for compact cars is limited, regulatory easing may encourage portfolio expansion across various vehicle segments.
Potential reclassification of specific models can be beneficial for production approvals and cost structures.
Within the automotive value chain, there will be a broader range of options for low-cost internal combustion, hybrid, and urban EVs.
AI–Robotics–Space Data Center: Viewed as a Single Value Chain
The spread of generative AI is facing limits in power, space, and cooling.
Big tech companies are considering the possibilities of space-based solar power and orbital data centers as mid-to-long-term options.
If the commercialization of space infrastructure accelerates, new industries such as launch vehicles, satellite networks, space power, and space cooling may emerge.
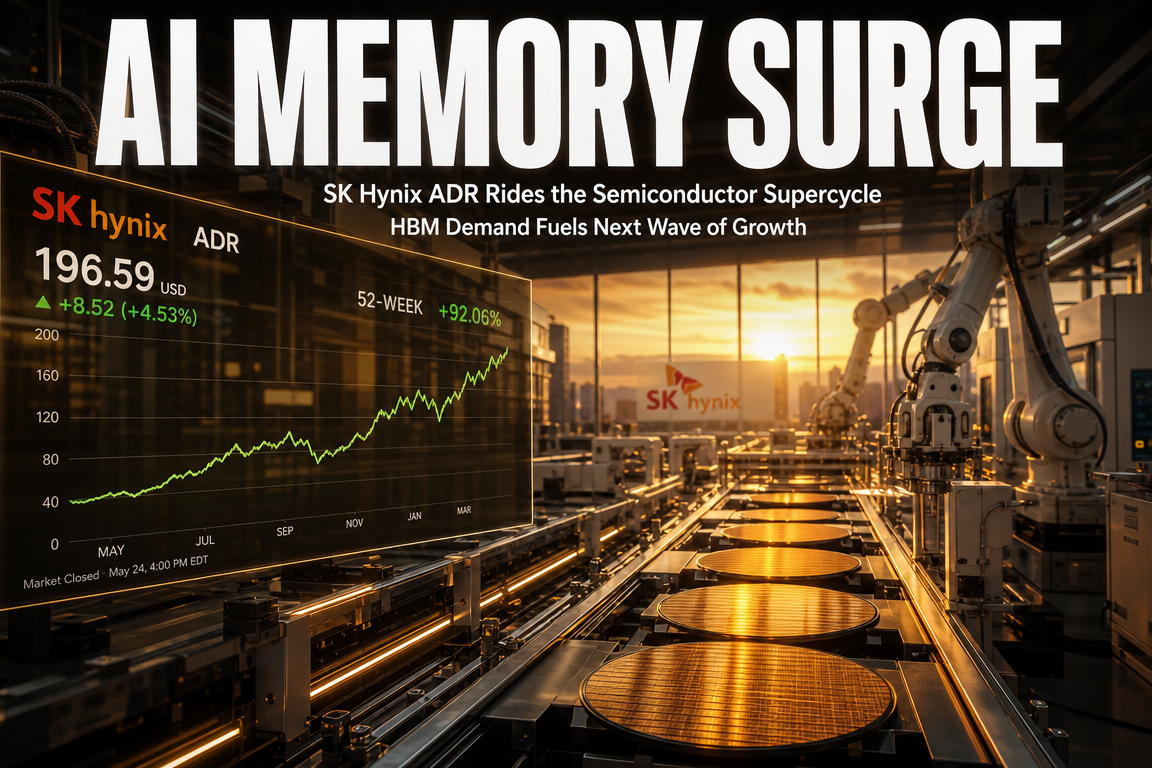
In the short term, investment points lie in onshore data center power, HVDC, cooling, AI accelerators, and an HBM memory supercycle.
IPO Rush and M&A: How to Interpret 2026
A resurgence in large-scale IPOs and big-deal M&A is both a result and a cause of liquidity recovery and a risk-on market sentiment.
Historically, IPO peaks have served as market top warnings in cycles.
While policy signals to “activate IPOs” indicate an openness to listings, if an overheated phase coincides with high IPO pricing and the release of lock-ups, it could create a supply-side headwind.
Beneficiary sectors: Investment banks, brokerage firms, and market infrastructure such as exchanges.
Risk management: It is important to 1) cap the proportion of IPOs, 2) diversify subscriptions, 3) verify lock-up structures, and 4) monitor the schedule for secondary block deals.
Interest Rate Cut Scenario Tree and Win–Loss by Asset Class
Baseline: Although an interest rate cut in December is highly anticipated, any additional cuts in 2025 depend on economic data.
Scenario A (Gradual cuts with solid growth): Large-cap growth stocks, robotics, AI infrastructure, and quality consumer stocks will benefit.
Scenario B (Delayed cuts with persistently high short- and long-term rates): High dividend, quality value stocks, and companies with robust cash flow in automation and platforms are likely to perform well.
Scenario C (Rapid cuts amid slowing growth): Defensive stocks, consumer staples, investment-grade bonds, and sectors benefiting from a stronger dollar are favored.
Positioning tip: Manage volatility in small-to-mid-cap high-value stocks while maintaining a core portfolio of large, quality, cash flow-focused stocks.
Strategy Map: Sectors, Themes, and Ticker Hints
Core robotics hardware: Industrial robots, reducers, servo motors, machine vision, and safety sensors are structurally favored.
Core AI infrastructure: GPUs, HBM, CXL, liquid cooling, and power/electrical components in HVDC EPC projects are cash cows.
Space frontier: Launch services, satellite communications, ground stations, and integrated ground–space power and data routing are mid-to-long-term options.
ETF examples: BOTZ and ROBO (robotics), ARKX/space-themed, and AI infrastructure/semiconductor ETFs can be structured into a core–satellite mix.
Geographical diversification: A balanced portfolio combining U.S. large-cap leaders, Japan’s dominant parts, and domestic/Taiwanese HBM/packaging chains is recommended.
Checklist in Numbers
CAPEX: Update quarterly on AI data center expansion CAPEX and power expansion investment plans.
Lead Time: Monitor whether lead times for reducers, servos, and high-precision bearings are shortening as an indicator of sustained demand.
Order Backlog: Track the year-over-year change in robotics/automation order backlogs and whether the book-to-bill ratio remains above 1.
Margins: Observe the spread trends of OEMs in HBM, packaging, and cooling, which reflect cycle intensity.
Policy: Adjustments such as revised robotics safety standards, accelerated depreciation measures, and expanded tax credits will directly impact earnings visibility.
Risks and Responses
Policy Timing: Administrative orders or budget enactments may be delayed.
Valuation: Robotics and AI stocks with built-in premium valuations are sensitive to market corrections.
Supply Chain: If bottlenecks in key components like reducers and motors are not resolved, installation volumes may be constrained.
Capital Markets: An IPO rush along with simultaneous block deals could destabilize supply–demand balance.
Response: Maintain a core weight of quality stocks, ensure high-valued sectors are approached with diversification and cash flow scrutiny, and use an event-driven strategy based on supply calendars.
Next Week’s Calendar
Macro: Pay attention to the FOMC decision and the interpretation of the dot plot.
Policy: The White House AI supply chain meeting may highlight issues around U.S.–alliance value chain alignment.
Earnings: Monitor updates in tech and consumer chains from companies like Oracle, Adobe, Synopsis, Broadcom, Costco, and Lululemon.
Points Not Often Mentioned in Other YouTube/News
The true catalyst for robotics demand is the “standardization of safety regulations.”
Once standards are codified, insurance, leasing, and financing tend to follow, leading to a surge in installations.
The cycle for reducers is longer and more gradual than that of semiconductors.
Since post-installation maintenance and retrofit revenues are substantial, the “quality of margins” differs.
Within the discourse on space data centers, the immediate beneficiary is the “onshore power infrastructure.”
HVDC, transformers, and cooling water infrastructure constraints will determine multi-year peak multiples from 2026 to 2027.
IPO peaks may serve as warnings of market tops in cycles.
For companies in their first listing year, oversupply often leads to rebalancing being more advantageous after a 6–12 month correction period.
Portfolio Construction Hints (Personal Opinion, Not Investment Advice)
Core 60%: Build your portfolio with U.S. large-cap AI and robotics leaders, Japan’s dominant parts, and AI infrastructure semiconductors.
Satellite 25%: Combine robotics/automation ETFs, baskets of select strong companies by category, and quality high-dividend stocks.
Options 15%: In the areas of space, edge AI, and new listings (with favorable lock-up structures), allocate small amounts across 2–3 high-conviction picks.
Cash/Rebalancing rule: Reduce risk when the IPO calendar overheats, the VIX spikes, or the FOMC shifts toward a more hawkish stance.
< Summary >
Policy is shifting toward robotics, and 2026 is likely to be the inaugural year that connects robotics, AI, and space as a cohesive theme.
The combination of Japan’s superior reducers/motors with U.S. large-cap leaders creates long-term “quality winners.”
Given the uncertainty in the FOMC’s interest rate cut trajectory, small-to-mid-cap high-value stocks may be more volatile; a focus on large, cash flow–driven core stocks is advisable.
An IPO rush may signal an overheated market, so it is important to continually monitor the listing calendar and lock-up releases.
Immediate beneficiaries include onshore data center power, cooling, and HBM; mid-term beneficiaries are robotics core components; and long-term options lie in space infrastructure.
[Related Articles…]
The Real Driving Force Behind 2026 Robotics Stocks: The Counterattack of Reducers, Servos, and Safety Standards
Why IPO Peaks Signal Market Tops: 2026 Calendar and Supply Checkpoints
*Source: [ 소수몽키 ]
– 트럼프가 새롭게 찍은 주식들? 26년 주도주로 올라설까
● Dollar Meltdown Threat, KRW Eyes 1,300 Comeback
2026 Exchange Rate Outlook Key Checkpoints: Will the Strong Dollar New Normal Persist, or Is It the Beginning of a Return to 1,300 KRW?
This article covers everything from the possibility of Exchange Rate War 2.0, the pace differential of interest rate cuts between the U.S. and Korea, the path of the Dollar Index, changes in the liquidity cycle, to the “real market movers” such as real effective exchange rate, current account, and dividend remittances.
Instead of the surface-level logic that brushes past market news, this article summarizes triggers, timelines, a practical checklist, and segment forecasts for different scenarios all at once.
To conclude, structurally the “strong dollar new normal” holds, but in 2026, a combination of policy and liquidity measures may make a move back into the 1,300 KRW range effective.
However, external risk factors such as geopolitical events or surges in commodity prices must be kept in mind, as they carry volatility risks of 1,550 to 1,600 KRW.
Keyword Guide: Exchange Rate Outlook, Dollar Index, Interest Rate Cuts, Liquidity, Economic Outlook.
News Summary Format: The Current Exchange Rate Issues and Baseline.
Issue 1: Why Does the “Strong Dollar New Normal” Keep Holding Up?
– The high demand for dollars from global manufacturing reshoring, U.S. fiscal deficits and bond supply creating high real interest rates, and the relative growth performance of the U.S. over Korea are all at work.
– While it cannot be explained solely by the interest rate differential between the U.S. and Korea, long-term reversals and carry trades have imposed structural pressures on the KRW.
Issue 2: Then Why Is There Discussion of a Return to the 1,300 KRW Range in 2026?
– With the easing cycles of major countries coming to an end, if the U.S. pivots later but more rapidly, the Dollar Index is likely to face downward pressure.
– If the policy mix of “post-tariff war exchange rate war” is actually used as a tool for exerting pressure, it creates an incentive to boost U.S. manufacturing exports through a weaker dollar.
Baseline: A gradual downward slope within the 1,330–1,410 KRW box in the first and middle parts of 2026, with an attempt to settle in the 1,300 KRW range in the second half.
Upside Risk: In the event of geopolitical shocks, a surge in commodity prices, or a global credit event, a rebound to the 1,500 KRW range is possible, with tail risks spiking up to 1,550~1,600 KRW.
Downside Risk: If DXY falls below 95, the semiconductor cycle overheats, and both spot and futures inflows from foreigners coincide, the KRW could touch the 1,280 KRW range.
Restating the Structural Grounds of the Strong Dollar New Normal.
1) Dollar Demand from U.S. Investment and Supply Chain Reshoring.
– Consistent dollar payments are generated by overseas direct investments and capital expenditures in sectors like semiconductors, electric vehicles, and energy infrastructure.
2) Price Reflection of Growth and Productivity Gaps.
– Aside from short-term economic rebounds, when the U.S. holds an advantage in long-term productivity and return on capital, a currency premium is maintained.
3) Persistence of Carry Trade.
– Until safe asset preferences ease and high U.S. real interest rates subside, the KRW remains exposed to volatility as a “risk-on” currency.
4) U.S. Fiscal Policy, Bond Supply, and the Dual Nature of the Dollar.
– While large-scale issuance can be a factor for a weaker dollar, sustained demand attracts the dollar through the level of interest rates.
Four Catalysts Fostering a Stronger KRW (Weaker Dollar).
1) Pivot in the Pace Differential of Interest Rate Cuts.
– If Europe, Canada, and Korea ease first and the U.S. follows later with a larger cut, the narrowing interest rate spread may lead to a decline in the DXY.
– Point: It is not so much “who cuts first” but “who cuts faster and by a larger margin” that influences the exchange rate.
2) Signals for Relaxation or End of Quantitative Tightening (QT).
– Even mere signals of a slowing down or end of QT can boost liquidity expectations and reduce the dollar premium.
– A shift to quantitative easing (QE) might trigger an event-driven decline, but it will depend on the inflation path and political schedule.
3) The Policy Channel of Exchange Rate War 2.0.
– Even if it is not a reenactment of the Plaza Accord, unilateral or segmented pressures—such as exchange rate reports, trade remedies, foreign exchange monitoring, or bilateral consultations—can be used to frame a weaker dollar scenario.
– The goal is to create a price environment that is advantageous for U.S. production and export.
4) The Physical Cycle and Korea’s Sensitivity.
– If the semiconductor sector recovers, IT exports pick up, energy prices stabilize, and the service balance improves, the KRW may benefit from a tailwind.
Grouping the “Real Variables” That Are Often Overlooked in Other News.
– Real Effective Exchange Rate (REER): When looking at the inflation-adjusted exchange rate rather than the nominal rate, KRW faces more rebound pressure as it approaches an excessively undervalued zone.
– Current Account and Seasonality: During the dividend remittance season of March to May, foreign currency demand increases, while in the latter half of the year, when trade balances improve, foreign currency supply rises.
– Sensitivity to Energy Prices: A surge in oil or LNG prices can quickly weaken the KRW due to deteriorated trade terms.
– NDF-Spot Lead/Lag: Offshore NDFs often provide early signals, with frequent fake breakouts (stop-run) and reversals around the 1,350 and 1,400 KRW levels.
– Option Expiries and Barriers: The more cumulative barriers there are in the 1,300/1,350/1,400 KRW quarters, the more likely a compressed volatility breakout in one direction becomes.
– Cross-Currency Basis (USD/KRW): If the cost of financing in dollars spikes, the spot exchange rate tends to follow suit.
– Korea’s Net International Investment Position (NIIP): Countries with a positive NIIP can potentially engage in “contrarian buying” during stress, thus reducing tail risks.
– Foreign Futures Positions and Blue-Chip Stock Flows: A shift to net long positions in KOSPI200 futures has frequently been observed as a coincident signal at the onset of KRW strengthening.
Exchange Rate Ranges and Trigger Conditions by Scenario.
Scenario A, Baseline (Probability Medium to High).
– Range: Within the 1,330–1,410 KRW box, with a gradual downward slope.
– Triggers: Gradual U.S. interest rate cuts, further easing of the QT pace, robust semiconductor export performance, and oil prices in the 70–85 dollar range.
Scenario B, Accelerated Weaker Dollar (Probability Low to Medium).
– Range: 1,280–1,330 KRW, with an attempt to settle in the latter half of the year.
– Triggers: DXY below 95, resurfacing of U.S.-Asia bilateral exchange rate consultations, and a chain of cuts following a slowdown in U.S. employment.
Scenario C, Stress Upside (Low Probability but High Impact).
– Range: A spike to 1,500–1,600 KRW.
– Triggers: A surge in geopolitical tensions, energy shocks, global credit events, or increased volatility in domestic leveraged sectors.
Debunking the Misconception: “Interest Rate Differential = Exchange Rate” is Incomplete.
– Even from 2017 to 2020, although U.S. interest rates were higher than those in Korea, the KRW did not consistently depreciate.
– Exchange rates are determined by a complex mix of interest rate spreads, growth and inflation paths, risk sentiment, trade balances, policy signals, liquidity, and option positions.
– The key focus for 2026 is not the “level of the interest rate differential” but the “pace of cuts and the direction of liquidity.”
Timeline Checklist: What to Watch for in 2026.
– Changes in the FOMC dot plot, statement wording, and mentions related to QT at each quarter’s meeting.
– Quarterly QRA (bond issuance plan) and changes in the duration mix from the U.S. Treasury.
– News on U.S. exchange rate reports, trade remedies, and signals from bilateral exchange rate consultations.
– Conservative cut guidance from the Korean Monetary Committee and any revisions to growth and inflation forecasts.
– Semiconductor prices, inventory levels, export momentum, and improvements in trade with China.
– Oil and LNG prices, refining margins, and power issues.
– Seasonal factors such as the dividend remittance demand from March to May and the period of foreign stock fund inflows from September to November.
Practical Action Plan: A Guide for Application.
Individual Investors.
– Standardize the proportion of currency diversification in your portfolio in advance, and use staggered currency hedges (forward exchange, currency hedge ETFs, currency options) during sharp exchange rate moves to buffer volatility.
– Create a “rulebook by segment” such as realizing profits on dollar positions above 1,400 KRW and expanding allocations to risk assets below 1,320 KRW.
– For global equity funds, consider a mix of hedged and unhedged options to account for the offsetting effects of dollar-KRW movements.
Export/Import Companies.
– Exports: When the exchange rate is above 1,350 KRW, use forward exchange and option call spreads to combine profit-taking with range protection.
– Imports: Gradually reduce open positions when the rate approaches the 1,320 KRW range, timing price pass-through and inventory cycles appropriately.
– Companies with foreign currency debt should manage swap rollover risks and diversify maturity schedules in anticipation of cross-currency basis fluctuations.
Common Risk Measures.
– In the face of geopolitical events, response is more important than prediction; thus, standardize strategies such as stop-loss, hedging, and maintaining a cash buffer.
Essential Chart Monitoring Points.
– Whether the DXY, after breaking below 100, moves toward the 98–95 range.
– Trading volume and the concentration of option expiries around the USD/KRW levels at 1,350 and 1,400 KRW.
– Spikes in KRW NDF-spot basis and any traces of intervention signals (smoothing) in the foreign exchange market.
– Monthly trends in Korea’s trade balance and energy import unit prices.
– The transition zones in cumulative foreign futures positions.
Final Summary: The Author’s View.
– Structurally, the strong dollar new normal (with an upward shift in the average level) remains valid.
– However, in 2026, overlapping factors such as the pace differential of interest rate cuts, renewed liquidity expansion, and policy signals open the possibility for the USD/KRW to approach the 1,300 KRW range.
– The basic range is 1,330–1,410 KRW, with an attempt to settle in the 1,300 KRW range in the second half, while the tail risk is a spike to 1,550–1,600 KRW.
– The key is not the “interest rate spread” but rather the “triggers of pace, liquidity, and policy.”
Precautions and Assumptions.
– This outlook is based on public information and general policy options through scenario analysis, and does not assume the definite execution of any specific political or policy measures.
– Geopolitical events, commodity prices, and systemic risks can significantly increase forecasting errors.
< Summary >
– The baseline for the 2026 exchange rate outlook is a gradual downward slope within the 1,330–1,410 KRW box.
– Accelerated U.S. interest rate cuts, easing of QT, and policy pressures of an Exchange Rate War 2.0 are factors that aid a weaker Dollar and a stronger KRW.
– However, risks remain for a spike to 1,550–1,600 KRW in the event of energy or geopolitical shocks.
– Investors and companies should respond with segment-specific rulebooks, staggered currency hedging, and by monitoring basis and NDF signals.
[Related Articles…]
Three Signals That a Falling Dollar Index Sends to the Korean Stock Market.
When the Liquidity Cycle Meets Interest Rate Cuts: A 2026 Investment Strategy Roadmap.
*Source: [ 경제 읽어주는 남자(김광석TV) ]
– 2026년 환율전망 : 환율붕괴 오는가? 점진적으로 안정화될까? [경읽남 222화]