
● Autonomy War, LiDAR Safety vs Camera Data Monopoly, SpaceX Sparks Orbital Goldrush
Rivian “Autonomy Day” Complete Summary: A Split Between Lidar vs. Camera, The Economics of Scaling, and Investment Focal Points
Core Points of Today’s Article
This article summarizes Rivian’s dedicated autonomous driving chip and “lidar+map” strategy, showing price and roadmap at a glance.
It dissects the fundamental differences between Waymo’s lidar approach and Tesla’s camera E2E approach, explaining who wins in scaling through economics.
It provides insights into SpaceX’s potential IPO and what the “orbital data center” signals for the AI, space, and network economy.
It breaks down the real reasons, from data, cost, and infrastructure perspectives, behind “why nearly every company uses lidar while only Tesla opts for cameras” — a point rarely covered by other YouTube channels or news.
It connects global economic fluctuations, interest rates, and inflation phases to the valuation sensitivity of tech stocks in the stock market.
Today’s Core News at a Glance
- Rivian held its first “AI & Autonomy Day.” It unveiled its dedicated autonomous driving chip (Rivian Autonomy Processor), 3rd generation computing platform, and a large-scale driving AI model (Large Driving Model, LDM).
- The process is 5nm, with an estimated maximum performance of up to 1,600 TOPS. It is designed with an integrated memory and compute structure to process sensor data.
- It announced a subscription-based autonomous driving service called “Autonomy+.” Priced at $2,500 upfront or between $49.99 and $99 per month, hinting at a low-cost strategy compared to Tesla’s FSD.
- The sensor strategy is multi-sensor fusion with lidar, cameras, and other sensors. Lidar will be officially mounted on new vehicles starting from the R2.
- The “Universal Handsfree” feature aims to cover a combined 3.5 million miles across the US and Canada, targeting not only highways but also general roads with lane recognition.
- Waymo continues with its strategy of lidar+HD map, backed by over 14 million rides (company/report basis) on its robotaxi service data.
- Elon Musk reiterated on X, “Waymo never had a chance from the beginning against Tesla,” hinting at the scalability advantage of camera-based E2E.
- Observations on a potential SpaceX IPO have intensified. Some reports suggest it could raise tens of billions of dollars, highlighting a blueprint for mega infrastructure investments such as “orbital data centers, R&D satellites, and on-orbit computing.” The timeline is uncertain but it is speculated for around 2026.
Rivian Announcement Breakdown: Technology, Products, and Pricing
-
Dedicated Chip and Platform
By unveiling the Rivian Autonomy Processor, Rivian demonstrates its intent to vertically integrate the autonomous driving stack.
With a 5nm process and an estimated maximum of around 1,600 TOPS, the performance is projected to be high.
Its integrated memory structure aims to minimize latency and boost throughput. -
Software Stack
The Large Driving Model (LDM) is introduced, an approach that enhances decision-making through large-scale driving data learning.
In addition to HD maps and lidar reliability, it emphasizes the element of learning to pursue both safety and comfort. -
Subscription and Pricing Strategy
Autonomy+ is priced at a one-time fee of $2,500 or monthly fees between $49.99 and $99.
With a lower entry price compared to Tesla FSD, it aims to expand subscription ARPU and experiment with new monetization.
With its high vehicle ASP, Rivian expects that an increased software revenue share will buffer overall margin variability. -
Sensor and Vehicle Roadmap
The strategy utilizes multi-sensor fusion of lidar, cameras, and radar.
Starting from the R2, new vehicles will officially feature lidar to enhance safety and detection reliability.
With Universal Handsfree, handsfree support will be expanded within map-covered areas.
Waymo-style Lidar vs. Tesla-style Camera: Philosophy, Scalability, and Cost
-
Philosophical Differences
Waymo and Rivian: Prioritize maximum safety through a combination of lidar, HD maps, and rule-based approaches, enabling high-reliability demos in specific cities and roads.
Tesla: Believes that if humans drive with eyes (cameras), then AI should also learn and decide using a camera-based E2E system. It minimizes reliance on maps and focuses on universality and adaptability for success. -
Scaling Logic
For the lidar+HD map camp: Expanding to new cities incurs high mapping and verification costs and presents challenges with update cycles.
For the camera E2E camp: Massive real-world driving data, continuous learning, and OTA updates enable scaling. Once the data network effect surpasses a threshold, regional constraints diminish significantly. -
Cost Structure
Incorporating lidar raises BOM costs and introduces supply chain risks.
Meanwhile, camera E2E reduces vehicle costs, but relies heavily on CAPEX for data centers and learning infrastructure.
In a high-interest-rate environment, CAPEX financing costs are burdensome, whereas declining interest rates and stable inflation are favorable for investment cycles in learning infrastructure. -
Perceptions of Safety and Performance
Lidar offers high reliability in terms of distance and shape recognition, providing a stable initial demo.
Multi-sensor fusion involves complex logic to resolve sensor discrepancies, which may lead to delays and potential collision scenarios.
While camera E2E may experience early errors and extended learning periods, once the learning threshold is surpassed, it can achieve superior generalization and adaptability.
The Economics of Scaling and Macro Variables
-
Compound Effects of Data Advantage
The product of data volume, diversity, and frequency exponentially enhances model quality.
With a massive fleet like Tesla’s, the accumulation and learning from edge cases is exponential.
For Rivian, the key lies in how quickly it can scale its fleet and data center capabilities. -
CAPEX and Macroeconomic Environment
For the lidar+HD map camp, each city expansion brings recurrent fixed CAPEX costs in the field.
In contrast, the camera E2E strategy demands significant upfront CAPEX for data centers, accelerators, storage, and networks.
Global economic interest rate levels and inflation trajectories directly impact financing costs and depreciation burdens.
A declining interest rate environment favors strategies expanding learning infrastructure, whereas a high-interest-rate scenario highlights the defensive nature of steady cash-flow subscription models. -
Stock Market and Technology Stock Valuations
As subscription ARR and margin improvements become more visible, there is potential for a recovery in tech stock premiums.
Conversely, should regulatory or safety risks surface, multiple compressions may occur rapidly.
The pace of regional expansion and transparency in safety statistics are key variables influencing valuations.
Investment Checklist and Scenarios
-
Rivian
Positives: Low-cost subscription could widen the user base, and lidar-based reliability may deliver high initial satisfaction.
Challenges: Scaling up the fleet, automating the data pipeline, reducing city expansion costs, and managing the lidar supply chain and pricing.
Catalysts: The commercialization of lidar capabilities in tandem with the launch of the R2, and bundling subscription ARPU with ancillary services. -
Tesla
Positives: The camera E2E system offers geographic adaptability, benefits from massive real-world driving data and learning infrastructure, and rapid OTA updates.
Challenges: Regulatory approvals, transparent and verified safety metrics, and establishing a responsible and insured framework for fully autonomous robotaxi services.
Catalysts: Expansion of unsupervised driving commercialization, acceleration of FSD revenue recognition, and the launch of a robotaxi network. -
Waymo & Other Lidar Camp Players
Positives: High reliability in limited zones and accumulated expertise from early-stage commercial service operations.
Challenges: Fixed CAPEX for city expansions, HD map maintenance costs, transparency in remote support ratios and expenses, and unit economics improvements.
The Most Crucial Point Often Overlooked Elsewhere
- The core reason why many companies opt for lidar while only Tesla uses cameras is “the availability of data and infrastructure.”
The camera-based E2E system essentially cannot function without vast amounts of real-world driving footage and extensive learning infrastructure.
Tesla leverages its massive fleet, data, and rapidly scaled infrastructure, whereas many companies lacking these prerequisites find it more feasible to depend on lidar+map to “spec up” their capabilities. - Thus, it’s not merely a matter of technological philosophy but also a result of differing “initial conditions” that force different strategies.
With accumulated data and infrastructure, the limitations of camera E2E vanish; without them, reliance on lidar+map becomes the rational choice. - While multi-sensor fusion appears theoretically safer, discrepancies in real-time decision-making can lead to delays and overly conservative stops, adversely affecting the user experience and unit economics.
In contrast, a single-modality focused E2E approach offers consistent probabilistic decision-making that reduces delays, aligning well with the economics of scaling.
Timeline and Points to Watch
-
Rivian
The timing of the R2 reveal and mass production with lidar integration.
The actual coverage, accuracy, and OTA update speed of Universal Handsfree.
Whether subscription conversion rates, churn rates, and per-city expansion costs are transparently disclosed. -
Tesla
The range of unsupervised driving already in commercial service and external validation of intervention distance statistics.
The regulatory approval landscape and the structure for insurance and liability.
The unit economics and demand elasticity of the robotaxi network. -
Waymo & Lidar Camp
The speed of service area expansion and transparency regarding HD map maintenance costs.
Clarity on remote support ratios and associated costs.
The downward trend in lidar BOM costs and the degree of supply risk mitigation.
< Summary >
- Rivian has chosen a strategy that combines Waymo-style safety and business models through a dedicated chip, lidar, and subscription.
- Tesla, leveraging a camera-based E2E approach, minimizes map dependency with its vast data and infrastructure, focusing on global scalability.
- The decisive factor is not safety but “scaling costs and speed” — essentially, the economics of scaling.
- In the macro environment, declining interest rates and easing inflation favor investments in learning infrastructure CAPEX, while visible subscription ARR bolsters tech stock valuations.
- In the short term, lidar may deliver perceptible quality, but in the long term, camera E2E is likely more advantageous for global expansion.
[Related Articles…]
SpaceX IPO and the Economics of Orbital Data Centers
Lidar vs. Camera: The Scaling Battle in Autonomous Driving
*Source: [ 오늘의 테슬라 뉴스 ]
– 리비안의 초대형 발표, 자율주행 판이 갈라졌다라이다 vs 카메라… 테슬라가 선택한 길은 틀린 걸까?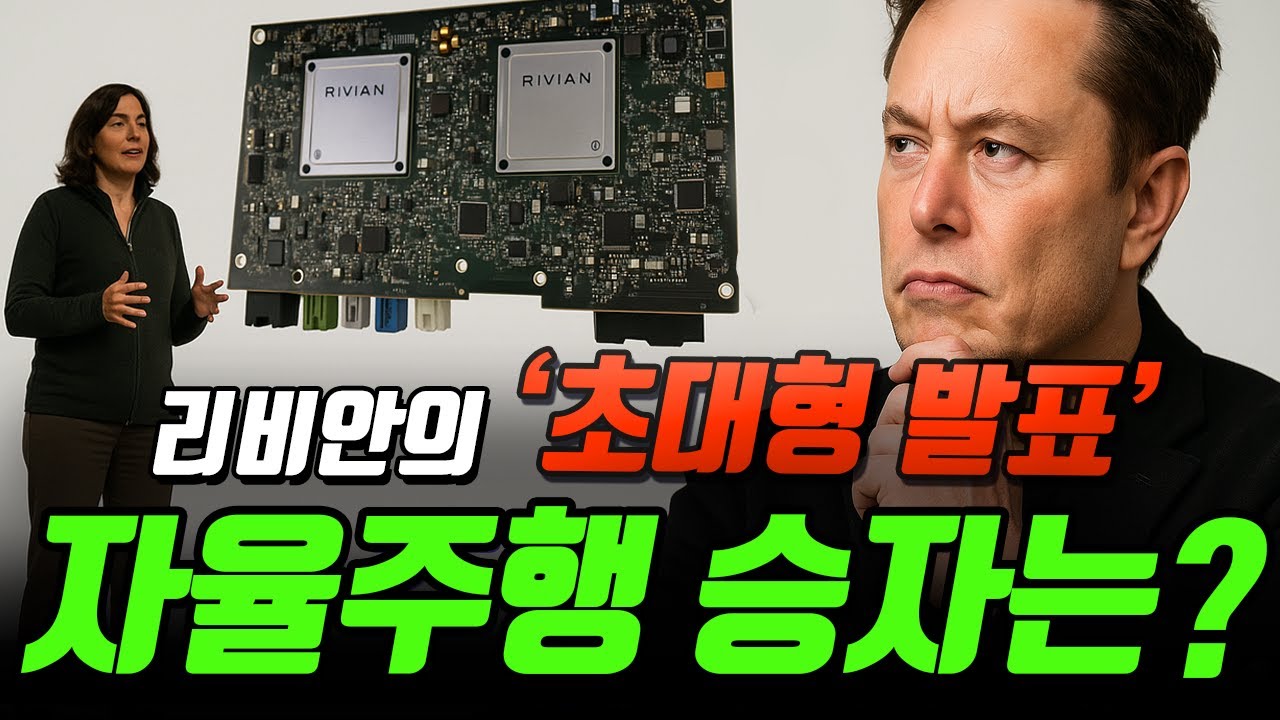
● Hidden Asset Gold Rush
Asset Stocks, Capture the True PBR First: ‘Cash-Realizable’ Valuation and AI Utilization Strategies That Work in Volatile Markets
Today’s article precisely contains three items.
- An investment framework for asset stocks that can be immediately applied through news-style summaries.
- The real PBR formula and a practical checklist calculated solely on “cash-realizable assets” rather than book values.
- Key details rarely revealed in other content, including global economic outlook variables such as interest rates, exchange rates, and inflation, along with AI screening.
News Briefing: Key Summary and Market Signals
Headline: Do not only look at book PBR below 1.0; the actual PBR recalculated based solely on “cash-realizable assets” is becoming the starting point for a market re-rating.
Key Points: Only land, cash, short-term financial assets, and salable stakes remain, while facilities and intangible assets are minimized or conservatively adjusted.
Market Reaction: In many cases, stock prices surge 10–30% immediately following announcements of divestment intentions, development plans, or news of stake disposals.
Outlook: Amid debates about interest rate peaks and exchange rate volatility, the asset re-rating theme is likely to circulate strongly at intervals, and stocks with clear cash-realization timelines are expected to show relative strength.
Investment Focus: The battle is decided by the “real PBR” that reflects public announcements, land market prices, the type of group stakes (investment vs. controlling), and taxes, transfer costs, etc.
Practical Application: How to Calculate the ‘Real PBR’ (Rough but Fast)
Step 1, Look at asset classification differently.
- Cash-Realizable Assets (weighted positively): Cash and deposits, short-term financial assets, salable investment stocks, land and non-core real estate that can be sold, and receivables that are normally collectible.
- Conservative Valuation (discounted or nearly 0): Facilities, machinery, vehicles, goodwill, software, patents, controlling group stakes, and essential business land.
Step 2, Market price adjustment is key. - For land and buildings, estimate the market price using nearby transaction examples, designated land use areas, and floor area ratios instead of the book acquisition cost.
- Reflect investment stakes at the most recent transaction valuation or the market price of listed stakes, and consider a bulk sale discount of 10–30%.
Step 3, Subtract debts and potential costs to arrive at the true figure. - Net Cash = Sum of market values of cash-realizable assets – interest-bearing debt – deferred corporate tax – sales-related taxes, brokerage, and transfer costs (conservatively assumed 3–7%).
- Off-balance sheet risks such as environmental and remediation liabilities, and retirement benefit liabilities should be adjusted separately.
Step 4, Calculate the real PBR. - Real PBR = Market Capitalization / “Cash-Realizable Net Assets” (after market price adjustments).
- Even if the general PBR is below 1, the real PBR may be above 1, indicating that it might not be undervalued, and conversely, even if the book PBR is above 1, the real PBR could be below 1, suggesting a high-quality asset stock.
Divestment Trigger: When Does “Cash-Realization” Occur?
- Signal 1: Reports concerning consideration of divesting non-core assets, outlines of real estate development plans, or relocation reviews of business sites.
- Signal 2: Announcements about the disposal of stakes in related companies or investments, entry into alternative businesses (with clear cash usage plans), and corporate governance restructuring.
- Signal 3: News regarding land revaluation, inclusion in industrial complexes, zoning changes, or the formulation of development plans.
After a trigger occurs, prices and trading volumes often spike within one to three trading days, and the ability to perform rough calculations can determine the realized gains.
Linking Macroeconomic Variables: Interest Rates, Exchange Rates, Inflation, and Asset Stocks
- Interest Rates: In the interest rate peak-out phase, the discount rate on real estate and cash-equivalent asset values is lower, facilitating re-rating.
- Exchange Rates: A weaker dollar encourages foreign inflows and a risk-on atmosphere in the stock market, favoring re-rating of low PBR stocks.
- Inflation: Moderate inflation pushes up market values for land and inventories, highlighting hidden asset values.
- Global Economic Outlook: In a slowing economy, investors may flock to asset stocks that offer a margin of safety rather than growth stocks.
AI Utilization: How to Increase Research Speed by 10 Times
- Data Collection: Crawl DART disclosures for balance sheets and tables of property, plant, and equipment as well as investment stocks from business reports, and match land market prices using publicly available data from the Ministry of Land and local governments.
- Automated Classification: Use large language models (LLMs) with fixed prompts to classify “cash-realizable vs. essential assets,” manually reviewing only suspicious items.
- Map and Satellite-Based Price Estimation: Combine GIS data with actual transaction prices to roughly calculate unit price ranges based on land use and floor area ratios.
- Automated Risk Checklist Verification: Include a template for deferred taxes, accrued liabilities, sales taxes, and bulk sale discounts.
Hypothetical Case Study: Calculating the Real PBR in One Minute
- Company A has a market capitalization of 1 trillion KRW, a book equity of 4 trillion KRW, and a book PBR of 0.25.
- Market Price Adjustment: Non-core land valued at 400 billion KRW in the books → estimated market price 4 trillion KRW, investment stakes of 300 billion KRW → market price reflected as 400 billion KRW (after applying a 20% bulk discount), cash remains at 200 billion KRW, and from 300 billion KRW of receivables, 10% is deducted for bad debt, resulting in 270 billion KRW.
- Total Cash-Realizable Assets: 4 trillion KRW + 400 billion KRW + 200 billion KRW + 270 billion KRW = 4.97 trillion KRW.
- Deductions: 2 trillion KRW of interest-bearing debt, assume 3% (1.49 trillion KRW) for sales-related taxes, brokerage, and transfer costs, and 2 trillion KRW of deferred corporate tax → total deductions of approximately 2.349 trillion KRW.
- Cash-Realizable Net Assets: Approximately 2.621 trillion KRW.
- Real PBR = 1 trillion KRW / 2.621 trillion KRW ≈ 0.38 times.
Assessment: Although it is higher than the book PBR of 0.25, it still lies within the undervalued range, and there is significant potential for re-rating if a divestment trigger emerges.
Risks and How to Avoid Them
- Companies That Can Sell But “Choose Not To”: Even if assets are sellable, prolonged delays in cash-realization may occur due to the owner’s intentions or corporate governance barriers.
- Quality of Assets: The difference between idle land and core business land, difficulties in relocating factories, and environmental concerns can greatly impact both the price and timing.
- Taxes and Costs: To avoid overvaluation, assume conservatively for capital gains tax, acquisition tax, and land-use change costs.
- Inventory Valuation Gains: If it is a temporary cyclical effect, the possibility of reversal should be taken into account.
Buy/Sell Operational Strategies (News-Based Timeline)
- Day 0: At the stage of divestment review reports or rumors, approach with small and gradual buying, completing about 80% of calculations roughly.
- Day 1–3: When official announcements are made and trading volume surges, re-examine the real PBR; if the cash-realization timeline of core assets is clear, increase the position; if not, wait cautiously.
- Week 4–12: Verify subsequent announcements and contract confirmations; assess further re-rating potential based on the quality of fund usage (dividends, share buybacks, new business ventures).
- Exit: Gradually reduce positions if valuation targets are reached or if macro headwinds such as rising interest rates or a sudden exchange rate spike occur.
Practical Checklist (Copy-and-Paste Standard)
- Have you recalculated by retaining only cash-realizable assets?
- Did you reflect land market prices by considering land use, floor area ratios, and nearby transaction cases?
- Are the investment stakes “salable stakes” rather than those held for controlling purposes?
- Have you deducted sales-related taxes, transfer costs, and bulk sale discounts?
- Have you checked for off-balance sheet risks?
- Are there clear trigger announcements and timelines?
- Have you cross-checked with the trends in interest rates, exchange rates, inflation, as well as industry cycles?
Key Points That Are Rarely Mentioned Elsewhere (Details Make the Profit)
- “Essential Business Land” should be treated as 0 or heavily discounted in the real PBR calculation even if its market value is high.
- Controlling group stakes should be distinguished from investment stakes because they have low cash-realization potential due to legal and related-party transaction risks.
- Land sale gains may not immediately lead to shareholder returns due to temporary corporate tax burdens and dividend profit determination issues.
- Increases in floor area ratios, changes in urban planning, or inclusion in industrial complexes are leading indicators; checking public hearings and local government schedules can serve as a leading sign.
- Bulk sale discounts are generally assumed within a 10–30% range, but if the counterparty has strategic value, the discount may be reduced to 0–10%.
- Re-assessing the cap rate during periods of falling interest rates can act as a catalyst to revalue real estate; thus, changes in the dividend yield of real estate investment trusts (REITs) can serve as an auxiliary indicator to improve accuracy.
< Summary >
- For asset stocks, it is not the book PBR but the recalculated real PBR based solely on “cash-realizable assets” that makes the difference.
- Retain only land, investment stakes, cash, and collectible receivables while heavily discounting or excluding facilities, intangible assets, and controlling stakes.
- Divestment intentions, development plan announcements, and stake disposal notices serve as triggers, and the speed of rough calculations determines profitability.
- Capture the re-rating timing by overlaying phases of interest rates, exchange rates, and inflation cycles, and enhance your research speed by integrating AI with announcements, market prices, and mapping data.
- To arrive at the “real margin of safety,” deduct taxes, costs, and off-balance sheet risks.
[Related Articles…]
2025 Asset Stock Cycle and PBR Re-Rating
How to Screen Financial Statements with AI
*Source: [ Jun’s economy lab ]
– 자산주 투자를 위한 실제 PBR구하는 법
● AI Power War – Rockefeller Reborn
Rockefeller’s Return: AI Power Wars, Nuclear Renaissance, and the Winners of the Power Value Chain
This article confidently claims to capture three precise aspects.
It explains why AI “eats electricity” and how far power demand in the United States could rise, including numbers and timelines.
It provides a news-style summary of which companies benefit and actually make money in the power value chain that flows from generation – transmission – distribution/cooling.
It also dissects the cash flow by revealing the critical points often overlooked, such as transmission permit bottlenecks, lead times for substations and ultra-high voltage equipment, limitations in water and heat management, and regional power price arbitrage structures.
It also checks the implications for global economic outlook, including the impacts on interest rates, inflation, and U.S. stocks.
Headline News Summary
– Data center power demand is estimated to be around 180 TWh in the U.S. in 2024, accounting for roughly 4% of the total power, and it is highly likely to expand to around 12% by 2030.
– For AI infrastructure expansion, “power availability” takes precedence over “GPU performance” in site selection.
– Big Tech employs an integrated strategy that includes long-term PPAs, baseload power from nuclear and gas, securing substations, and direct investment in transmission networks to ensure 24/7 reliable power.
– In the value chain extending from generation – transmission – power equipment – cooling, companies like Constellation Energy, GE Vernova, Quanta Services, and Vertiv stand out as real beneficiaries.
– The “real bottleneck” lies in the transmission permits and the supply chains for substations and ultra-high voltage transformers and switchgear, with water and heat management issues determining the CAPEX for next-generation data centers.
AI = Electricity: The Demand Curve is Changing
The key point is that AI consumes electricity, and cooling can account for up to 40% of power consumption.
While today’s data centers typically use 20–40 kW per rack, next-generation AI clusters are being designed to assume 50–100 kW per rack.
U.S. data center power is very likely to grow from about 180 TWh in 2024 to over 400 TWh by 2030, which is a scale that changes the base of overall demand.
From a global economic outlook perspective, this realigns the pace of the energy transition to focus on the power grid and affects the paths of inflation and interest rates.
Rockefeller’s Logic, Returning to Electricity After 150 Years
Just as Rockefeller dominated the flow by integrating oil refining, transportation, and sales, Big Tech is currently integrating power generation, transmission, and supply contracts.
There is no need to own 100% of the source.
The key is to control the “flow”.
Data centers are evolving to have a “power operating system” that directly connects with baseload sources such as thermal and nuclear power.
The Power Value Chain: Who Makes Money
– Generation: Constellation Energy (CEG) has a significant presence in PPAs that combine 24/7 power with carbon-free certification based on existing nuclear power plants.
This is the segment where the value of nuclear and gas baseload is being re-evaluated in the AI era.
– Generation Equipment (OEM): GE Vernova (GEV) enjoys a cycle upside with its diverse portfolio including gas turbines and wind energy, along with an all-time high backlog.
AI demand is spurring regional peak demands, leading to simultaneous new and renovation needs.
– Transmission/Substation (EPC/Services): Quanta Services (PWR) is expected to benefit structurally from the construction of high-voltage transmission lines and substations.
A significant part of the U.S. power grid consists of assets aged 50–70 years, overlapping with replacement CAPEX and new AI demand.
– Distribution/Cooling/Power Management (Solutions): Vertiv (VRT) holds a strong position in low-voltage distribution, UPS, and liquid cooling (DLC).
The shift towards higher rack density is directly linked to increased penetration of liquid cooling, which boosts the price and margin leverage of power and heat management solutions.
Big Tech’s Power Securing Strategy: Power is the New ‘Cloud’
They secure the data centers’ “power SLA” through long-term PPAs and matching 24/7 Carbon-Free Energy.
They ensure operational capacity by mixing baseload power from nuclear, gas, and hydropower with renewable energy.
Securing substation sites and securing interconnection agreements for the transmission network are moves that precede even land acquisition.
Onsite power designs at the campus level are expanding, including SMRs, microgrids, and onsite heat recovery.
Policy & Regulation: The Axis of the Energy Transition Shifts to the Power Grid
The United States is setting its direction with measures such as rationalizing nuclear regulations, fast-tracking transmission permits, and subsidies for grid modernization.
Europe and Asia are similarly reinforcing transmission and extending the lifespans of baseload power sources simultaneously.
These policies alter cost structures and WACC, which in turn impact utility CAPEX cycles and the rotation of U.S. stock sectors.
On-Site Numbers: Bottlenecks and Lead Times
Interconnection queues range from 3 to 5 years depending on the region, with some areas facing even longer waits.
Lead times of 18–36 months are common for key equipment such as ultra-high voltage transformers (LPT) and gas-insulated switchgear (GIS).
No GPU can be installed until a substation’s expansion or new construction is approved.
Ultimately, time value is generated in the power grid, and “power rights” become assets.
Heat, Water, and Site: The Invisible Cap on Data Centers
High-density racks inevitably increase the reliance on liquid cooling, making the amount of cooling water used and securing water rights key variables.
In areas facing water stress, competitive advantages are found in dry cooling, hot water loops, and integration with waste heat district heating.
Locations with dual access to “water + power” such as coastal areas, proximity to aquifers, or near nuclear power plants command site premiums.
Price Signal: Nodality Pricing Determines AI Economics
Regional locational marginal pricing and capacity markets differentiate the OPEX of data centers.
Rules and congestion costs of grids like PJM, ERCOT, and TVA eventually create profitability gaps.
Power procurement teams design hedge positions by combining PPAs, RECs, and capacity options like financial products.
Macro Impact: Interest Rates, Inflation, and U.S. Stocks
The power grid CAPEX cycle is long and large.
Utilities, T&D, and power equipment are sensitive to interest rates, but the cost-linked pricing structure in regulated industries enhances their resilience.
Increases in power facility demand can put inflationary pressure on capital goods and industrial prices, with the pace of policy and regulatory changes influencing inflation trends.
In the U.S. stock market, we could see a rotation into sectors such as utilities, power equipment, thermal management, and industrial semiconductors.
What Other YouTube/News Sources Rarely Mention as the ‘Real Core’
– Transmission grid permitting is the real sandworm.
Permits for transmission lines and substations take longer than for power plants, and these delays determine the completion time for data centers.
– Substations and ultra-high voltage equipment are the “new semiconductors”.
Global supply shortages of LPT, GIS, and HV cables push up prices and lead times.
– The overall cap on water and heat dictates CAPEX.
Deals can be determined at the NDA stage based on whether water rights and heat recovery designs are in place.
– Nodality pricing and capacity charges create differences beyond PPA rates.
Even the same kWh costs can differ for AI depending on location and time.
– “24/7 CFE” is not merely about being eco-friendly; it is an uptime insurance.
A combination of nuclear, hydropower, and gas supports the SLA, and REC alone is insufficient.
– Although AI consumes power, power also uses AI.
Operational alpha increases as demand response, predictive maintenance, and cooling optimization improve throughput per kW.
Risk Checklist
Delays in transmission permits and community opposition pose schedule and cost risks.
Nuclear power has significant uncertainties in regulations, construction period, and CAPEX, and maintenance risks must also be considered.
Changes in policies, regulatory rate adjustments, and price caps can increase profit volatility.
Bottlenecks in the equipment supply chain may prevent simultaneous project execution.
Timeline: Key Points to Watch from 2025 to 2030
2025–2026: The speed of substation/interconnection approvals will be the deciding factor for the start of data center construction.
2026–2028: Liquid cooling penetration will become mainstream, boosting the ASP and margins of cooling solution providers.
2027–2030: The realities of nuclear and gas life extensions and new baseload power will emerge as the 24/7 PPA market becomes standardized.
Whether utilities, T&D CAPEX peak concurrently and transition into a “second cycle” will be a turning point for stock cycles.
The Framework for Investment Ideas (for Educational Purposes)
Due to the extended power grid CAPEX cycle, EPC/T&D services could see a structurally thicker order backlog.
The acceleration of the shift to high-density racks will drive demand for low-voltage distribution, UPS, and liquid cooling.
The premium on baseload power will widen, enhancing the pricing power of businesses that can supply 24/7 CFE.
Sectors characterized more by “regulated assets and long-term contracts” than by economic sensitivity could be relatively resilient to interest rate fluctuations.
Key Insight in One Line
In the AI era, the winners are not just the “chips” but the players who can connect the flow of power the fastest and at the lowest cost.
Rockefeller’s logic still holds true.
< Summary >
The spread of AI structurally boosts power demand, and Big Tech secures 24/7 power SLAs by integrating power generation, transmission, and supply.
The beneficiaries are concentrated within the generation, transmission, power equipment, and cooling value chains, while the real bottlenecks are permitting, substations, equipment lead times, and water/heat management.
Nodality pricing and 24/7 CFE determine economics, and the power grid CAPEX cycle influences inflation, interest rates, and the rotation of U.S. stock sectors.
In conclusion, the companies that control the “flow of power” will become the Rockefeller of the AI era.
SEO Keyword Reference: Global Economic Outlook, Inflation, Interest Rates, U.S. Stocks, Energy Transition.
[Related Articles…]
The U.S. Nuclear Renaissance and the Answer to Data Center Power
Winners in the Power Grid Investment Transformation in the AI Data Center Era
*Source: [ Maeil Business Newspaper ]
– “100년 전 석유, 지금은 전기” 록펠러로 보는 AI 돈의 흐름 | 매일뉴욕 스페셜 | 홍성용 특파원