● Wall-Street-Hypes-Server-AI-Tesla-Bets-on-Slower-High-Stakes-Physical-AI
The Real Reason Tesla Keeps Dropping Out of “AI Top 5”: Wall Street’s Preferred AI Timeline Differs From Tesla’s Physical AI Timeline
This report contains four core points:
- Why Wall Street reports consistently anchor on NVIDIA, Microsoft, Amazon, and Google, while Tesla is often excluded or pushed to the bottom.
- Why “When does Robotaxi/Optimus generate profits?” reflects a structural difference between AI that is monetized as measurable software metrics versus AI deployed in the physical world.
- Why it is risky to conclude Tesla is “late” simply because Waymo/Baidu/Pony.ai are already operating services (operations vs. scalable expansion).
- A separate section highlighting the most decision-relevant point that is under-discussed in mainstream news and financial media, providing an investor-oriented evaluation framework.
1) Key News Briefing (Investor Summary Format)
1-1. Signal from Tesla’s “2025 Recap” Video: Cybercab Production Appears to Have Already Started
Tesla’s official 2025 recap video functions less as an end-of-year highlight and more as a consolidated message across its portfolio (EVs, energy, robotaxi, and robotics).
The video includes: the latest FSD version, Optimus demonstrations, the Tesla Diner (Hollywood), robotics network references around Austin/San Francisco, and initial customer delivery messaging for full self-driving.
The primary signal: Tesla’s official channel implied Cybercab production has already begun.
Relative to prior statements (including shareholder meeting remarks), this may indicate an accelerated timeline and a shift from “anticipated” to “visible execution.”
1-2. Cumulative 9 Million Vehicles Produced: Manufacturing Velocity Matters More Than the Milestone
Tesla reported cumulative production of 9 million vehicles, with the 9 millionth unit produced at Gigafactory Shanghai.
Key metric: approximately 1 million additional vehicles were produced in about 207 days after the 8 million milestone, indicating sustained manufacturing scale and throughput.
The 8 millionth vehicle was produced at Gigafactory Berlin; the 9 millionth at Shanghai, suggesting a multi-site global production system rather than a single-factory surge.
This supports the view that Tesla is maintaining manufacturing expansion while preparing for AI-driven transitions (autonomy and robotics).
1-3. Israel: FSD Regulatory Approval Moving Toward a National-Level Agenda
Elon Musk reportedly accepted an invitation to Israel’s smart transportation conference in March 2026.
A video call reportedly included the Minister of Transport and a national AI lead, with topics covering autonomous-driving legal frameworks, AI development, and expanded cooperation with Tesla.
Notable detail: local advocacy efforts for FSD deployment and a dedicated government task force to accelerate testing and approval processes suggest regulatory timelines are moving from discussion to structured execution.
This indicates progress in institutional and legal timelines rather than purely technical debate.
2) Why Wall Street’s “AI Boom” Framework Often Misaligns With Tesla
2-1. Wall Street Favors AI That Converts Directly Into Quarterly Financial Metrics
AI Top 5 lists frequently converge on NVIDIA, Microsoft, Amazon, and Google because the monetization path can be modeled directly through quarterly results and guidance: data-center capex cycles, GPU orders, and cloud revenue growth.
These businesses translate AI demand into measurable revenue, margins, and growth rates on a near-term reporting cadence.
This narrative is also comparatively compatible with market valuation frameworks during macro-driven volatility (e.g., rate expectations).
2-2. Tesla’s AI Is “Physical AI,” With Longer Validation and Monetization Cycles
Tesla’s FSD, Robotaxi, and Optimus are deployed in real-world environments where failure costs are explicit and measurable.
Performance improvements are not sufficient on their own; systems must pass real-world constraints (roads, weather, night driving, construction zones, edge cases), followed by operational validation and scalable deployment.
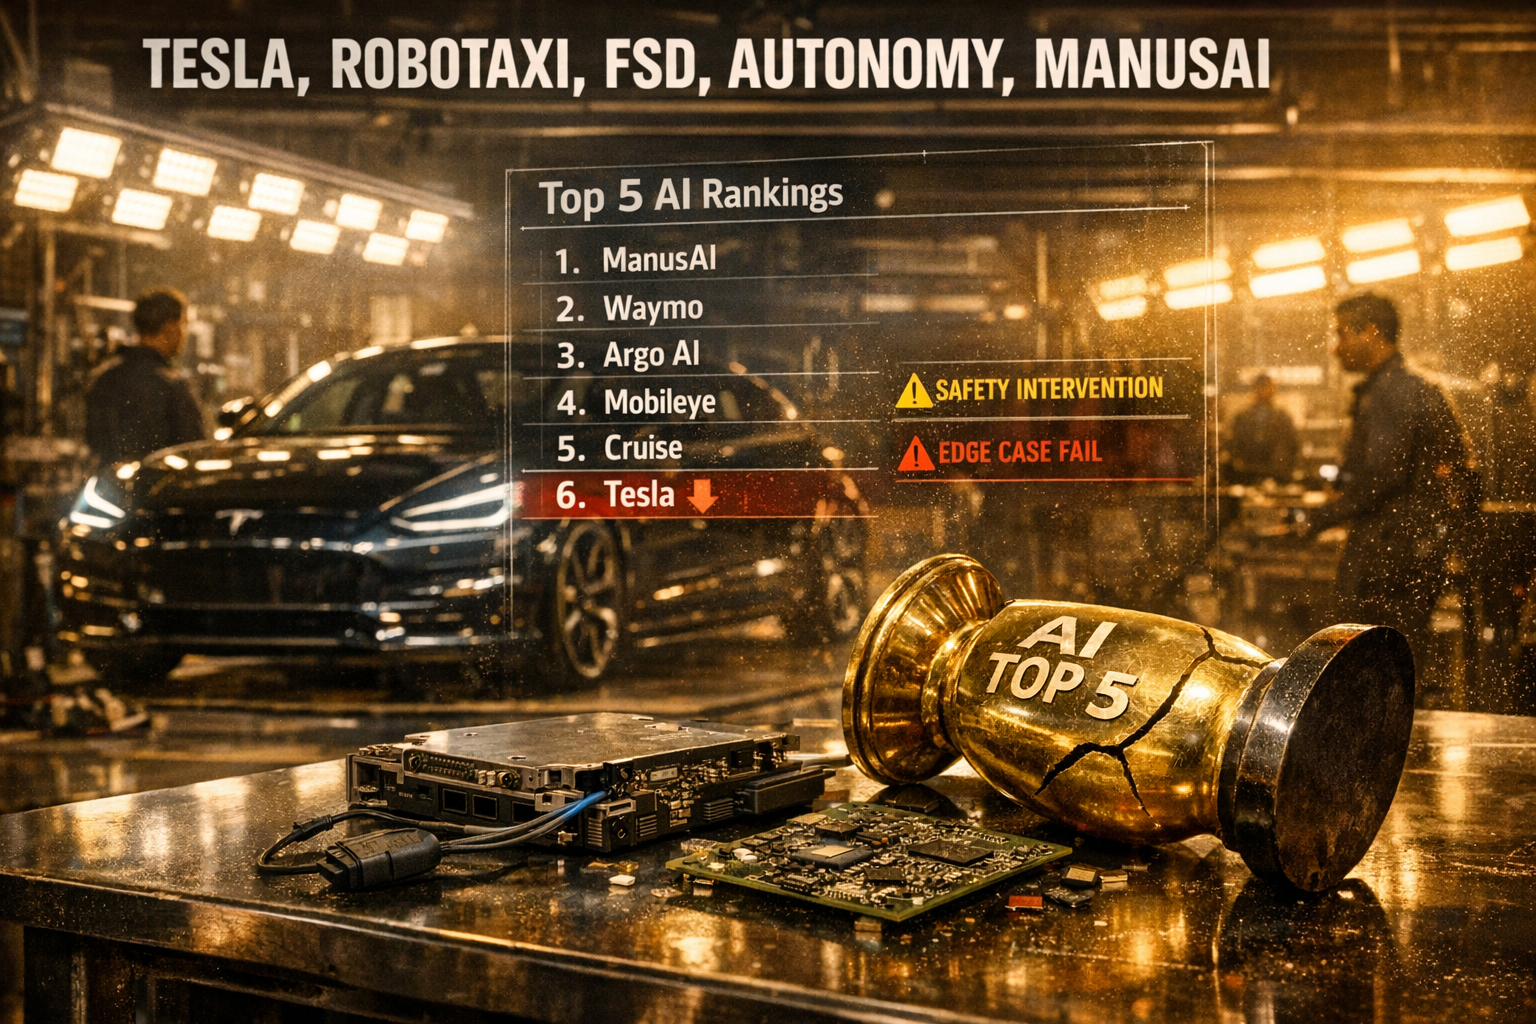
As a result, Tesla is often classified as being earlier in the “financial proof” cycle, which contributes to exclusion or lower placement in AI Top 5 lists.
3) Three Common Market Misinterpretations When Evaluating Tesla
3-1. Misinterpretation #1: “Waymo/Baidu Are Already Operating, So Tesla Is Behind”
Operations (service in specific regions under defined conditions) and scalable expansion (handling uncontrolled variability at acceptable cost) are distinct problems.
Geo-fenced, constrained operations do not automatically prove scalable unit economics or broad deployability.
Early deployment does not necessarily determine the ultimate winner in scalable adoption cycles.
3-2. Misinterpretation #2: Evaluating AI Primarily Through Performance Curves
The critical question in physical-world AI is not only “best model performance,” but whether the system can execute failure-driven iteration at the lowest cost and highest frequency.
This framing aligns with Tesla’s emphasis on vertical integration (e.g., Dojo, AI5) as a mechanism to control training and iteration costs.
3-3. Misinterpretation #3: Assuming Wall Street Forecasts Are Consistently Early and Correct
Sell-side positioning often becomes more aggressive after business models are operationally validated and revenue visibility improves.
Tesla remains weighted toward pre-confirmation phases where monetization is not yet consistently reflected in reported financials.
The core issue is less “Is Tesla an AI company?” and more “When does Tesla’s AI become financially legible in reported results?”
4) A Clearer Robotaxi Competition Framework: Geo-Fenced Operations vs. Generalizable Autonomy
4-1. Strengths and Constraints of Competitors’ Unmanned Operations
Waymo, Zoox, and multiple China-based robotaxi operators can appear ahead via unmanned-driving footage and limited-service availability.
However, many approaches operate within constrained scenario sets; in ambiguous or unexpected conditions, conservative behaviors (e.g., stopping) may be the default.
Examples frequently cited in debate include hesitation at complex intersections and slow prioritization responses around emergency vehicles due to rule-based constraints.
4-2. Tesla’s Stated Objective: Scalable Generalization Across Global Road Conditions
Tesla’s stated approach emphasizes generalizable autonomy that interprets environments more like human drivers, rather than relying primarily on pre-defined scenario catalogs.
The competitive inflection is likely determined not by “launch” announcements but by expansion cost and expansion speed.
5) Incremental Shifts Within Wall Street: “The Next Phase of AI Is Autonomy and Robotics”
Dan Ives (Wedbush) has stated that the next AI phase includes autonomous driving and robotics, and has argued for substantial valuation contribution from Tesla autonomy.
Conversely, Gary Black and other skeptics caution against assuming Tesla is uniquely advantaged, emphasizing competitive operating examples.
The central dispute can be summarized as:
- Companies that have proven operations vs.
- Companies that can prove scalable expansion
6) The Most Under-Discussed Decision Point (Investor-Relevant)
6-1. Tesla’s Absence From AI Top 5 Is Primarily a Financial Recognition Timing Issue, Not a Pure Technology Issue
Wall Street prioritizes AI revenue that is immediately reflected in quarterly financials (cloud, data centers, semiconductors).
Tesla’s AI monetization must clear operational, regulatory, insurance, safety, and liability gates before it scales into revenue lines at meaningful magnitude.
Accordingly, the AI Top 5 debate is more about timing than technical capability.
6-2. Robotaxi Is Not a “Self-Driving Demo” Business; It Is a Unit-Economics-at-Scale Business
Operating unmanned service in a limited number of cities differs materially from expanding to dozens or hundreds of cities.
At scale, sensor stack costs, mapping maintenance, operations staffing, and regulatory compliance become explicit per-unit costs.
The long-term winner is likely determined by who can scale while maintaining attractive unit economics.
6-3. The 2026 Focus Is Not Only FSD Performance, but Whether Regulation + Production + Operations Align
Key variables include: Cybercab production signals, national-level regulatory processes (e.g., Israel), and operational validation.
If these synchronize, investor positioning may shift rapidly toward renewed AI categorization.
If any component underperforms, Tesla may remain framed as “strong technology with unclear monetization timing.”
7) Investor Checklist (Through 2026)
1) Whether FSD performance remains stable not only in favorable conditions, but also in adverse environments (rain, snow, night driving, construction zones) with sustained data accumulation.2) Whether Cybercab moves from announcements to production, deliveries, and utilization rates.3) Regulatory progression: whether national-level approval processes expand (one country’s approval can serve as a reference point for others).4) Competitive assessment: prioritize expansion speed and cost structure over operating footage.5) Macro sensitivity: how rate expectations, inflation trends, and supply-chain shifts influence growth-equity valuation regimes.
< Summary >
Wall Street’s AI boom narrative is dominated by AI that monetizes directly into quarterly financials (data centers, GPUs, cloud), which structurally disadvantages Tesla in AI Top 5 rankings.
Tesla’s AI is physical AI (FSD, robotaxi, Optimus), requiring operational validation and regulatory clearance, delaying financially observable proof points.
The market often overweights “who launched first” and underweights “who can expand at acceptable cost.”
2026 may be an inflection period if Cybercab production, regulatory approvals, and operational scaling align.
[Related Articles…]
-
Tesla Robotaxi and FSD Regulatory Issues: 2026 Investment Watchpoints
https://NextGenInsight.net?s=Tesla -
The Next Growth Cycle Driven by Physical AI Amid the AI Bubble Debate
https://NextGenInsight.net?s=AI
*Source: [ 오늘의 테슬라 뉴스 ]
– 테슬라가 AI TOP5에서 빠지는 이유: 시장이 착각하는 한 가지 ?
● Trillion-Won Payout Mirage, Telecom-Platform Data Leak Fallout, Loophole-Driven Cover-Up Risk, Cybersecurity Spending Surge, Big-Tech Winner-Takes-All
KT and Coupang: The Real Numbers Behind “Trillion-Won Compensation,” and the Structural Incentives That Increase Recurrence Risk (Cybersecurity and Investment Implications)
This report focuses on four points:
1) Why headline compensation figures (KRW 450 billion; KRW 1.7 trillion) diverge from customer-perceived value, recalculated on an actual benefit basis
2) What companies often prioritize over compensation: managing precedent risk and churn (cancellations) risk
3) Structural gaps that can shift incentives from reducing breaches to making incidents difficult to investigate (logs, evidence, terms)
4) Where capital may flow next: increased cybersecurity spending and potential concentration toward global market leaders
1) Issue Summary (News Brief)
Following large-scale personal data incidents, KT and Coupang announced compensation packages that appear substantial in headline terms, while real-world customer value is constrained by eligibility and usage conditions.
Equity market reactions have at times been muted or positive, reflecting expectations that corporate cash outflow may remain limited.
This pattern provides insight into how Korean corporates prioritize cybersecurity investment and how they manage regulatory and litigation risk.
2) KT Compensation: Why “KRW 450 Billion” Sounds Large but Feels Limited
2-1. Common Inflation Mechanics: “Cash-Equivalent Customer Benefit” vs. “Planned Investment/Marketing”
Large headline numbers are often constructed by combining:
(1) Future spending (e.g., security investment) presented as part of “compensation”
(2) Low marginal-cost benefits (e.g., incremental data) monetized at high notional values
(3) Narrow take-up through application requirements, time windows, and conditions to reduce realized payout
2-2. Why a “50% Monthly Fee Discount” Was Avoided: Precedent Risk
A key constraint is precedent: prior cases in the telecom sector showed that waiver or discount periods can trigger meaningful subscriber churn, pressuring market share and earnings.
Given high reacquisition costs, KT appears to have favored controllable-cost options (conditional early termination fee waivers, additional data) over broad, direct fee reductions.
2-3. Time-Window Design: A “Two-Week” Period Can Function as a Narrow Election Window
The early termination fee waiver requires an explicit action (termination election/contract rescission) within a defined window that may include holidays, reducing effective business days.
Such design can expand the stated eligible population while limiting actual participation, containing cost while preserving the headline message.
2-4. Cost Structure of a 100GB Data Benefit: Network-Based, Low Marginal-Cost Compensation
Incremental data can be attractive to customers but may represent limited cash cost for the operator, given sunk network infrastructure.
With a high share of unlimited plans, perceived incremental value may be further diluted.
This structure tends to maximize perceived generosity while keeping corporate costs manageable.
3) Coupang Compensation: How “KRW 50,000 per Person” Functions in Practice
3-1. Benefit Fragmentation: Small Universal Value, Larger Value in Restricted Categories
The package may total KRW 50,000, but allocation toward categories such as travel or luxury can reduce utility for typical users.
Conversely, coupons applicable to routine purchases may be smaller, lowering perceived compensation.
Realized cost to the company may be materially below the headline total due to redemption and usage rates.
3-2. Key Legal Consideration: Coupon Use Potentially Linked to Waiver-of-Claims Risk
Some legal commentary warns that accepting or using coupons may be linked to provisions limiting future civil or criminal claims (e.g., non-litigation agreements).
If applicable, customers may effectively exchange modest benefits for constrained legal rights.
The scope and enforceability depend on the specific terms and individual circumstances.
4) A Larger Risk Than “Low-Cost Compensation”: Incentives That Favor “Non-Investigability” Over Prevention
4-1. Short Log Retention: “If It Cannot Be Verified, It Is Not a Breach” Incentive
A central issue is that short system log retention can prevent confirmation of breach pathways, scale, and duration.
When evidence is unavailable, accountability boundaries become less defined.
This can create a misaligned incentive: reducing investigability may reduce financial exposure more predictably than reducing incident probability.
4-2. Evidence Preservation Concerns: Market Signal from Incident Response Practices
Where post-incident actions (e.g., reinstalling operating systems or disposing of core equipment) impair forensic reconstruction, scrutiny can escalate to investigative authorities.
This highlights that forensic readiness (log retention, evidence handling, response governance) is increasingly tied to regulatory, litigation, and reputational outcomes.
Security posture assessment may therefore expand beyond “prevention spend” to include transparency and investigability under stress.
5) What Equity Market Reactions Indicate: Rewarding Loss Containment Over Customer Protection
Limited or positive share-price reactions following compensation announcements often reflect expectations that cash outflows will be contained.
If repeated, this dynamic can incentivize optimization of compensation design and accounting impact rather than fundamental security improvements.
Over time, this may erode trust capital and increase tail-risk exposure in larger future events.
6) Forward View: Cybersecurity Shifting from Discretionary Spend to Mandatory CAPEX
6-1. Macro Context: Security as a Scale-Economics Industry
As AI adoption accelerates, data volumes increase and attack surfaces expand.
Cybersecurity is likely to become a non-discretionary input across industries, with demand potentially concentrating among top-tier platforms benefiting from scale and ecosystem effects.
In inflationary environments, security spend can be relatively difficult to cut; in easing-rate cycles, growth-oriented valuations may regain support, subject to macro and earnings volatility.
6-2. Investment Framing: Focus on Global Category Leaders
Representative companies include Palo Alto Networks and CrowdStrike.
In cybersecurity, accumulated trust, data, and platform breadth can increase switching costs, reinforcing advantages for market leaders.
An issuer-specific approach remains necessary, balancing valuation multiples against growth durability, with phased entry often more practical given rate sensitivity and earnings variability.
7) Underemphasized Points in Broader Coverage
1) The key variable is not the headline “total,” but realized redemption and participation rates.
Coupon-based, application-based, and time-limited benefits frequently translate into lower realized payouts than implied.
2) Terms and waiver-of-claims risk can be a central feature of compensation design.
If small benefits are exchanged for legal constraints, the package functions as litigation-risk management rather than customer restitution.
3) Log retention and forensic readiness may become core drivers of enterprise value under cyber risk.
Beyond prevention budgets, the ability to investigate and disclose credibly can determine regulatory, legal, and reputational outcomes.
4) The issue likely contributes to higher cybersecurity investment over time.
With accelerating AI-driven digitization, security increasingly functions as mandatory infrastructure rather than a deferrable cost line.
8) Practical Actions (Individual, Shareholder, Employee Perspectives)
Shareholders can raise direct questions at annual meetings:
“What is our cybersecurity budget as a percentage of revenue?”
“What are our log retention standards, forensic processes, and third-party audit (penetration testing) cadence?”
“What are our incident notification SLAs (hours/days) and measurable prevention KPIs?”
Evasive answers or broad “security reasons” responses may indicate that cybersecurity is still treated primarily as a cost center rather than a risk and resilience function.
< Summary >
KT and Coupang compensation outcomes depend more on conditions and redemption rates than on headline totals.
Companies tend to prioritize churn, precedent, and cash-outflow control, shaping compensation toward low marginal-cost structures.
If logs, evidence handling, and contractual terms reduce investigability and narrow accountability, recurrence risk increases.
Over time, AI-driven expansion of attack surfaces supports structurally higher cybersecurity spend, with potential demand concentration among global leaders.
[Related Articles…]
- Surging Cybersecurity Investment: Key Points Often Missed by Korean Corporates
- Three Channels Through Which Personal Data Incidents Pressure Enterprise Value
*Source: [ Jun’s economy lab ]
– KT와 쿠팡이 꼼수 보상을 하는 이유
● AI Power Shift 2026, Samsung Inference Memory Surge, Meta Agent Buyout Blitz, Tesla Physical AI Breakout
The 2026 AI Regime Shift: Samsung Electronics (Inference Memory), Meta (AI Agent M&A), and Tesla (Physical AI) and Why Portfolios May Need Repositioning
This note covers three developments.
First, why Mizuho named Samsung Electronics as a “Top Pick for 2026” (a shift from HBM-only to an inference-memory framing).
Second, why reports of Meta pursuing the acquisition of the Chinese-linked startup Manus AI support the thesis that value is moving from “building AI” to “deploying and operating AI.”
Third, why Baird maintains a $548 price target for Tesla based less on EV unit sales and more on catalysts tied to robotaxis and humanoid robotics.
A separate section summarizes five points that are often underemphasized in mainstream coverage.
1) One-Line Market Brief: Low Liquidity Into Year-End, Clear Structural Signals
U.S. equities traded with limited year-end liquidity, resulting in muted index moves.
In such conditions, structural signals (research updates, M&A activity, and guidance) tend to be more informative than index-level performance.
The key signals highlighted here were: (i) Mizuho’s re-rating case for Samsung Electronics, (ii) AI agent-oriented M&A activity involving Meta, and (iii) a catalyst shift in Tesla’s investment narrative noted by Baird.
2) [Sell-Side Research] Why Mizuho Selected Samsung Electronics as a 2026 Top Pick
2-1. An HBM-Only Framework Misses the Next Inflection
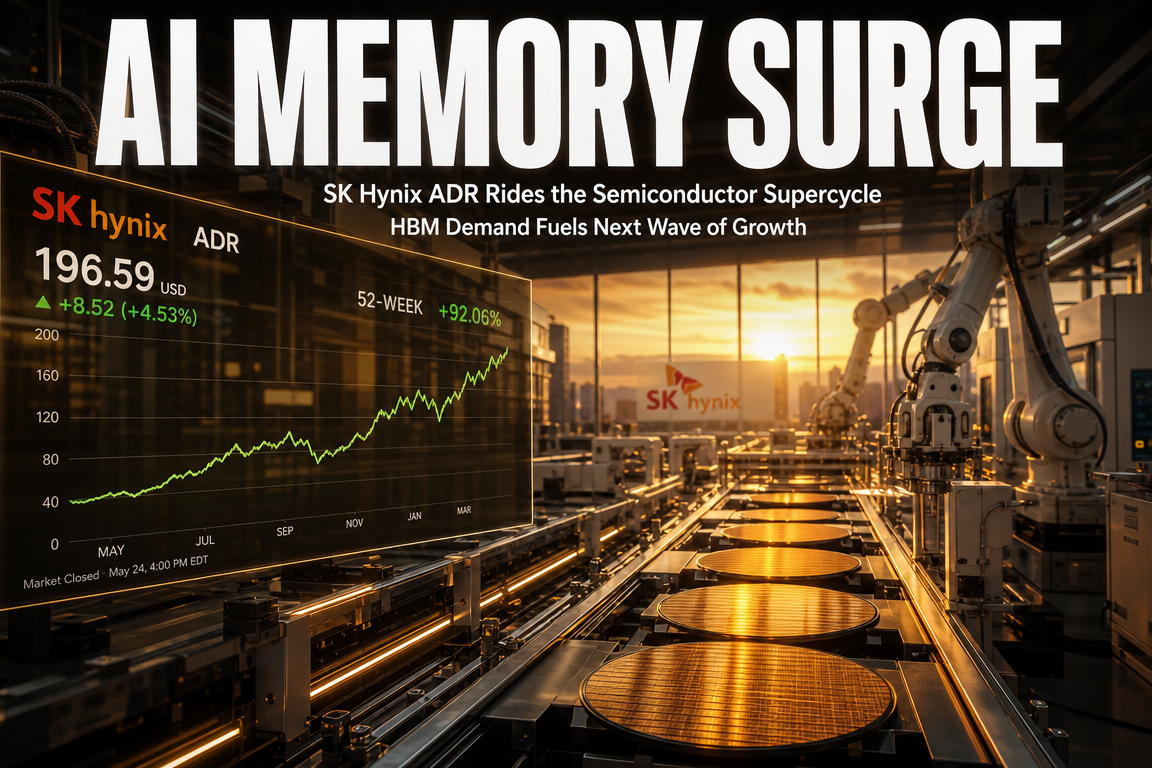
The 2023–2025 AI investment cycle was dominated by training-driven capex: training workloads scaled rapidly, GPU demand surged, and HBM (high-bandwidth memory) became a binding constraint.
As a result, HBM suppliers (notably SK hynix) moved to the center of investor attention.
Mizuho’s core message is not that HBM demand disappears, but that the center of gravity shifts from training to inference.
2-2. 2026 Focus: Inference as the Monetization and Operating-Cost Battleground
Competitive intensity is increasingly shifting from model creation to serving existing models at scale to large user bases.
At scale, the key variables extend beyond peak performance to power efficiency, unit economics, and total cost of ownership.
As AI adoption moves deeper into daily usage, inference workloads are positioned to expand materially, supporting more durable data center investment and broader semiconductor demand.
2-3. Why Samsung: GDDR7 Positioning and a Full Server-Module Stack
Mizuho’s emphasis centers on the possibility that next-generation inference architectures may increase reliance on GDDR/LPDDR-class memory alongside HBM.
Reports referenced NVIDIA’s next-generation inference platform (Rubin CPX) as potentially adopting GDDR7, a configuration where Samsung may be competitively positioned on technology and supply.
In this framing, the market’s focus shifts from “HBM alone” to the full AI memory mix (including server modules), where Samsung’s broader portfolio could increase operating leverage and support valuation re-rating.
3) [Big Tech M&A] Meta and Manus AI: AI Agent Competition Accelerates
3-1. What Manus AI Represents: Execution-Oriented AI Agents
Manus AI is characterized less as a foundational-model developer and more as an AI agent platform designed to execute user tasks.
Initial market commentary positioned its user experience favorably relative to existing GUI-based agent offerings, contributing to heightened visibility.
3-2. Why “Chinese-Linked” Mattered: Regulation, Capital Access, and Trust Constraints
Chinese-linked startups may face persistent geopolitical and regulatory friction that can constrain fundraising, partnerships, and global scaling, independent of product performance.
Relocation of headquarters to Singapore and the involvement of U.S. venture capital have been cited as factors drawing scrutiny.
An acquisition by Meta would likely enable scale via distribution, data, and integration across Meta’s platform footprint.
3-3. Strategic Implication: From “Building AI” to “Operating AI”
Rising AI agent adoption implies structurally higher inference traffic and sustained infrastructure load.
Industry forecasts cited in the source materials indicated a growing share of AI computing shifting toward inference by 2026.
Accordingly, this activity is better interpreted as competition to establish an agent layer across advertising, commerce, messaging, and content platforms, rather than a narrow feature acquisition.
4) [Sell-Side Research] Why Baird Maintains a $548 Tesla Target: Beyond Vehicle Sales
4-1. Catalyst Shift: Robotaxi and Optimus Over EV Deliveries
The central point is the deemphasis of near-term EV deliveries as the primary stock catalyst.
Baird’s focus is instead on robotaxi commercialization and humanoid robotics (Optimus), categorized as physical AI.
This supports a valuation narrative that frames Tesla as an AI + robotics + mobility platform rather than a conventional automotive OEM.
4-2. Incentive Normalization and Competitive Pressure vs. Narrative Durability
Reduced U.S. EV incentives and intense competition in China (including BYD) can pressure unit growth and margins.
The supportive buy-side/sell-side argument is that EV sales become a secondary driver while autonomy data, fleet scale, and robotics become the primary pillars of the long-duration thesis, helping sustain premium multiples if execution milestones are met.
5) Macro Linkage: Data Center Power Demand, Inflation Sensitivity, and Rates
5-1. Data Centers Increase Power Demand, Which Can Feed Into Inflation
A reported ~30% increase in electricity costs from 2021 to 2025 is cited as an illustrative data point.
The broader linkage is that scaling AI infrastructure increases structural power demand, requiring incremental grid, transformer, and generation investment that can contribute to localized or sectoral inflation pressure.
In such a setup, market sensitivity to the Fed rate path may rise.
5-2. The Practical Meaning of “Chips Are Not the Only Bottleneck”
Interest in data center assets and platforms (including SoftBank’s review of a DigitalBridge acquisition) reflects the view that bottlenecks increasingly extend beyond GPUs to power availability, real estate, permitting, and grid capacity.
If this constraint set tightens, 2026 investment exposure may broaden from semiconductors to power infrastructure and data center REITs/operators.
6) Consumer Trend Note: The U.S. Resale/Discount Culture and Consumption Resilience
The discussion of resale markets is framed as a macro-relevant signal.
In the U.S., secondhand purchasing is often treated as rational value-seeking rather than a stigma-based choice.
This can support consumption during slowdowns by enabling a downshift in spending patterns rather than a full demand collapse, contributing to perceived resilience in aggregate consumption.
7) [Key Takeaways] Five Underappreciated Points
1) The 2026 memory investment focus may shift from “HBM” to changes in the inference-oriented memory mix.
HBM remains important, but an HBM-only narrative may be insufficient to explain the next valuation phase.
2) The Samsung “Top Pick” thesis is driven less by a single product and more by a full portfolio and server-module ecosystem.
GDDR7 matters, but the broader ability to supply across server modules can be more consequential for valuation.
3) AI agent M&A reflects a battle to control inference traffic, not incremental app functionality.
Traffic leadership can translate into downstream control over infrastructure build-out.
4) Tesla’s target framework is increasingly anchored in a “physical AI platform premium,” not automotive volumes.
If robotaxi/robotics optionality remains credible, multiples may be more resilient despite volatility in EV deliveries.
5) In 2026 AI investing, power is not merely a cost line; it is a potential growth cap.
Permitting and grid constraints can directly limit the pace of AI service expansion.
SEO Keywords (Natural Placement):
This report connects U.S. equities, interest rates, inflation, semiconductors, and data centers within one integrated framework.
< Summary >
Mizuho argues that as AI’s center of gravity shifts from training to inference by 2026, the relevant opportunity expands beyond an HBM-only cycle toward a broader memory-mix transition (including GDDR7/LPDDR), where Samsung Electronics could see outsized leverage.
Reported Meta interest in acquiring Manus AI is consistent with the view that AI is transitioning from a “build” phase to an “operate” phase, with AI agents driving sustained inference traffic growth.
Baird’s $548 Tesla target is primarily tied to physical AI catalysts such as robotaxis and Optimus rather than EV deliveries.
Overall, 2026 exposure may increasingly depend not only on semiconductors but also on power, grid capacity, and data center infrastructure as binding constraints and investment themes.
[Related Articles…]
- Samsung Electronics’ AI memory strategy: could the inference shift make it a leading beneficiary in 2026?
- Tesla robotaxi and Optimus: physical AI-era valuation re-rating factors
*Source: [ Maeil Business Newspaper ]
– 2026 톱픽 삼성전자 선정한 미즈호ㅣ베어드, 테슬라 아웃포펌&목표가 $548ㅣ메타, 중국계 스타트업 마누스AI 인수ㅣ홍키자의 매일뉴욕