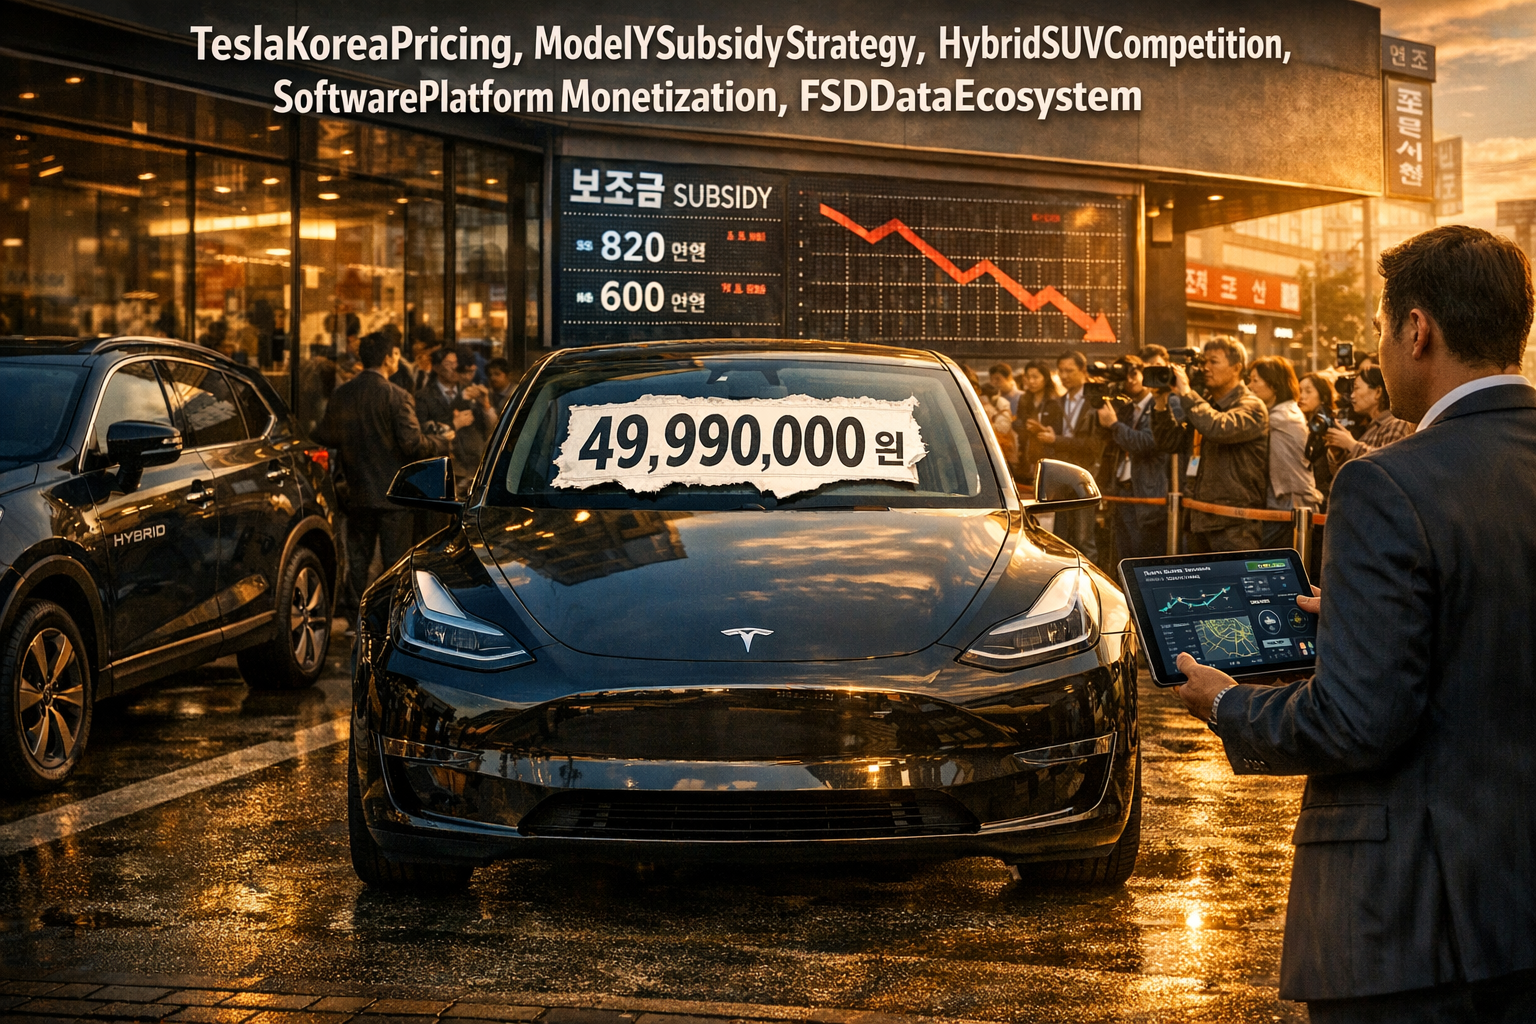
● Tesla Price Bombshell, 49-99M KRW Triggers Korea SUV War, EV-to-Software Power Shift
The True Significance of Tesla’s KRW 49.99 Million Price Point: Korea’s Auto Market Shifts from a “Price War” to a “Platform War”
This report focuses on three points:
1) Why the Model Y at KRW 49.99 million is more than a KRW 3 million discount (including subsidy-driven price architecture)
2) Where it directly pressures Hyundai/Kia’s profit structure (a direct hit on the core hybrid SUV band)
3) How Tesla is reshaping competition from vehicle sales to data, FSD, and software revenue
1) Breaking: Tesla Model Y at KRW 49.99 million — Not a Discount, but a Battle for Pricing Control
1-1. Key numbers: KRW 52.99 million → KRW 49.99 million (KRW 3 million reduction), but larger effective impact
The Model Y RWD price declined from KRW 52.99 million to KRW 49.99 million.
In Korea, EV subsidies can materially alter effective purchase prices once applied.
In Seoul, the effective purchase price can fall into the KRW 42–43 million range; in regions with larger subsidies, scenarios extend into the high KRW 30 million range.
1-2. Why this price changes market rules in Korea
Korea’s EV demand is highly sensitive to subsidy brackets rather than sticker price alone.
Tesla’s pricing appears optimized around subsidy-driven effective pricing to directly challenge mainstream ICE and hybrid lineups.
This functions as a signal of intent to set the mid-size SUV reference price.
2) Competitive framing: Tesla is competing with domestic hybrid SUVs, not only EVs
2-1. Primary target: Sorento and Santa Fe hybrids, not Ioniq 5
Consumer substitution often occurs across powertrains within the same price and utility band.
Sorento Hybrid and Santa Fe Hybrid can exceed KRW 50 million once acquisition taxes and options are included.
Tucson Hybrid (fully optioned) can reach the KRW 42 million range.
If the market anchors on “Tucson full-option pricing equals Model Y,” purchase decision pathways shift.
2-2. A more severe price signal for imported competitors
Mercedes EQB is commonly priced in the high KRW 70 million range; EQ SUVs often price into the KRW 100 million range.
BMW iX3 is typically in the KRW 80 million range.
Positioning pressure increases when Tesla’s brand perception competes with premium imports while pricing converges toward domestic mid-size SUV levels.
3) Policy interpretation: Tesla counters “LFP subsidy disadvantage” with direct price action
3-1. Core of the subsidy revision: a structure unfavorable to LFP
A key element of the revised subsidy framework is a relatively disadvantageous structure for LFP-based vehicles.
This has been interpreted as an implicit barrier for vehicles with high China-made LFP exposure (including Shanghai-produced Tesla units).
3-2. Typical response vs. Tesla’s approach
Where many OEMs would accept reduced subsidy competitiveness, Tesla opted to offset policy impact through pricing.
This risks pulling the market into a more intense price environment, increasing pressure on domestic OEMs.
4) Cost structure: Korea’s Model Y supply is primarily from Gigafactory Shanghai
4-1. Why Tesla can reduce price: differentiated manufacturing and scale
The primary supply source for Korea is Gigafactory Shanghai, often assessed as one of Tesla’s lowest-cost, highest-throughput plants globally.
4-2. LFP + giga casting = structural cost reduction
Shanghai-produced units tend to feature higher LFP usage and extensive large-scale casting (e.g., giga press), reducing process steps.
Fewer components and reduced welding/assembly labor typically improve cost flexibility.
5) Core strategic layer: Tesla is deploying a platform (software monetization model)
5-1. Hardware as a terminal; upside from FSD/subscription/data
The pricing move signals prioritization of installed base growth over per-unit hardware margin.
As deployment expands, driving data accumulation increases, supporting autonomy improvement and potential FSD conversion/upsell.
This functions less as share capture and more as platform installation.
5-2. Macro relevance: AI competition follows “data → model improvement → commercialization”
In autonomy, model performance is product competitiveness, and performance depends on data quality and scale.
Lower prices that expand deployment increase the degree to which the Korean market contributes to Tesla’s AI training ecosystem.
This aligns more closely with AI-driven industrial restructuring than a conventional vehicle discount cycle.
6) Second-order effects: existing owners and the used-car market face near-term repricing risk
6-1. Existing owner impact: asset value sensitivity
A KRW 3 million new-car price reduction can compress perceived residual value immediately for recent buyers.
Tesla has historically been less focused on residual value stabilization than traditional OEMs, suggesting recurrence risk.
6-2. Used-car market: near-term repricing pressure
Lower new-car pricing structurally forces used pricing to reset.
This may be amplified by the perception that EV technology and battery performance evolve rapidly, increasing depreciation sensitivity.
7) Brief global signals (Tesla/EV industry)
7-1. Tesla Semi 1.2 MW charging demonstration: charging speed is central to logistics electrification
Relative to ~250 kW peak for Model Y Supercharging, 1.2 MW represents roughly 4–5x power.
For commercial trucking, operational viability depends on replenishing usable range within mandated rest windows rather than full charging.
Adoption of the MCS standard connector supports an interpretation of progression toward broader deployment.
7-2. Gigafactory Nevada: 6 millionth drive unit milestone
Drive units are a core propulsion module; cumulative volume indicates scaling capability and supply readiness.
7-3. BYD “possible global No. 1 in 2025” reporting: sales leadership and autonomy leadership are distinct
While volume leadership scenarios are discussed, China’s competitive intensity and overseas trade barriers remain key variables.
Sales rank does not directly translate into AI autonomy advantage.
8) Under-discussed critical points
Point 1) KRW 49.99 million is subsidy-optimized price architectureThe strategic value is less the headline discount and more the effective price positioning that attacks the core margin band of domestic hybrid SUVs.
This signals a shift from cost-plus pricing toward policy-aware, demand-elasticity, and platform-expansion pricing.
Point 2) Hyundai/Kia’s core challenge shifts from EV sales to defending hybrid cash-cowsHybrid SUVs represent a major profitability segment in Korea.
Matching price pressure risks margin erosion; not matching risks volume loss.
This trade-off is central.
Point 3) Tesla’s expansion increases an AI data pipeline, not only unit salesWhat appears as an EV price war also functions as competition for autonomy training data and software monetization leverage.
The broader structure can intersect with semiconductors, battery materials, energy policy, interest rates, and FX dynamics.
9) Forward watchlist (investment/industry)
1) Whether EV subsidy policy is further adjusted (changes the rules of price competition)
2) How Hyundai/Kia redesign hybrid pricing and trim strategy
3) The pace and intensity of Tesla’s FSD/subscription software commercialization in Korea
4) How China-origin EVs (e.g., BYD, Xiaomi) enter Korea/Europe (including trade barriers)
5) Interest-rate direction (financing/lease demand sensitivity) and FX volatility (import pricing pass-through)
< Summary >
Tesla’s KRW 49.99 million Model Y price is not merely a KRW 3 million reduction; it is a pricing-control strategy leveraging subsidy-driven effective pricing to directly disrupt the core pricing band of domestic hybrid SUVs.
This is enabled by Gigafactory Shanghai’s cost structure (LFP adoption, large-scale casting) and aligns with a longer-term platform expansion thesis centered on FSD and data-driven AI capability rather than vehicle margin optimization.
Near-term impacts include likely pressure on existing owners and used-car pricing, while domestic OEMs face a strategic requirement to defend hybrid profitability rather than solely competing on EV volume.
[Related articles…]
- EV subsidies reshaped the Korean market price map after revisions (https://NextGenInsight.net?s=EV)
- The core of autonomy competition: why data and software revenue are changing the game (https://NextGenInsight.net?s=autonomous-driving)
*Source: [ 오늘의 테슬라 뉴스 ]
– 테슬라 4,999만 원, 이 가격이 한국 자동차 시장을 정말로 흔들기 시작한 이유는?
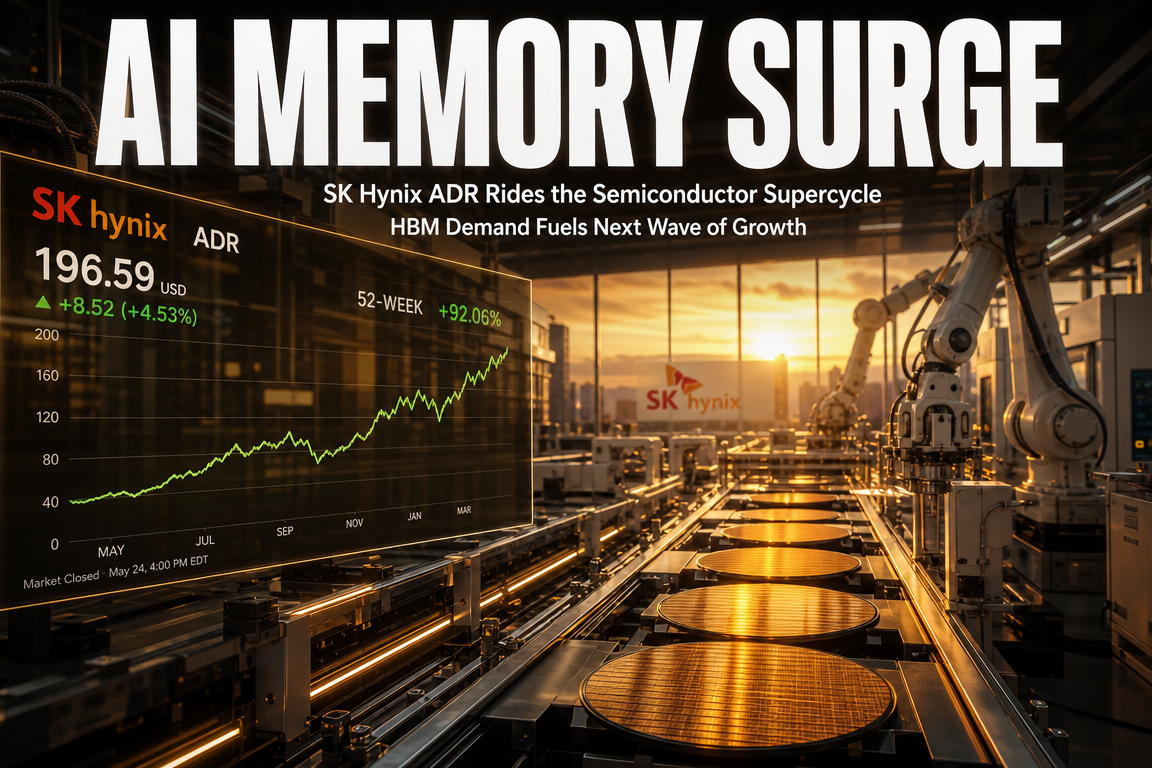
● AI-chip boom ignites silver-copper supercycle, supply crunch meets demand explosion, bitcoin-gold myth fades
Why AI and Semiconductors Could Turn the Silver and Copper “Supercycle” Into the Decisive Endgame (Supply Depletion vs Demand Surge, and Misconceptions About Bitcoin)
This report consolidates three points.
1) The view that “silver moves more than gold” is not merely about volatility; it reflects a changing supply-demand structure.
2) How AI, semiconductors, data centers, and power-grid buildouts are making silver and copper effectively “non-substitutable inputs,” shifting pricing toward scarcity-driven clearing levels.
3) Why the “Bitcoin = digital gold” framing can be misleading, and how liquidity cycles can create correlation illusions.
1) Core development: “The commodity supercycle is extending from gold to silver and copper”
A concise chain summarizes the thesis.
AI expansion → rapid growth in data centers → scaled investment in power infrastructure → sharp increase in demand for high-conductivity materials (copper, silver), while supply capacity does not scale commensurately.
If central banks and governments pivot toward easier financial conditions (rate-cut expectations, fiscal expansion), system liquidity can amplify price levels across commodities. This dynamic may interact with inflation channels, including asset-price inflation and input-cost inflation.
2) The case for “silver outperforming gold”: structure, not just volatility
2-1. Historical pattern: silver tends to outperform in gold up-cycles
A recurring observation is that silver’s volatility is approximately 1.5–2.0x that of gold, and in sustained gold up-cycles silver has often delivered larger percentage moves.
2-2. Key point: industrial demand may be lifting silver’s effective price floor
The relevant framing is not “silver is also a safe haven,” but that silver combines monetary characteristics with industrial commodity demand.
Silver’s high electrical conductivity supports growing end-use demand across AI, 5G, EVs, advanced defense/space applications, and energy transition hardware such as solar. These applications expand “must-have” consumption where performance constraints reduce substitution.
3) How AI, semiconductors, and power infrastructure could accelerate silver and copper demand
3-1. Data centers are power-intensive; electricity ultimately flows through copper
As AI scales, data centers expand. As data centers expand, power demand rises, driving transmission, distribution, and substation investment with large copper intensity.
This is not only a thematic narrative; it is a configuration prone to real supply-chain bottlenecks. Markets may increasingly price copper not purely as a cyclical input, but as an AI infrastructure necessity.
3-2. Silver’s role increases in higher-performance electronics
In advanced electronics and high-performance semiconductor systems, tighter efficiency and performance requirements can increase the use of silver in specialized components, adding incremental demand beyond legacy applications.
In summary:
AI (compute) scales → power (energy) must scale → conductive materials (copper, silver) become binding constraints.
4) Supply-side considerations: silver supply is structurally inelastic
4-1. Reserve-to-production arithmetic highlights potential constraints
Using USGS-referenced figures cited in the discussion (approximately 560,000 tonnes of remaining silver and ~28,000 tonnes of annual production), a simple ratio implies roughly two decades of production at current rates.
This should not be treated as a literal countdown. The investable implication is that demand is structurally rising while supply elasticity remains low.
4-2. Inventory drawdowns increase price sensitivity
References were made to declining inventories across London (LBMA), New York (COMEX), and Shanghai, with Shanghai described as near a multi-year low.
In commodity markets, falling inventories can shift pricing from incremental fundamentals to scarcity-driven repricing. For silver, concurrent financial demand can further increase volatility and tail risk.
5) Gold/Silver Ratio (GSR): interpretation risk and regime shifts
One assertion is that historical gold-to-silver ratios were closer to ~10:1, while recent levels around 70–80:1 could imply asymmetric upside for silver if the ratio compresses.
The critical variable is not the exact historical average but whether markets begin to re-rate silver as a monetary metal. In such a regime, GSR compression can accelerate, potentially catalyzed by geopolitical risk, de-globalization pressures, or deterioration in fiat currency confidence.
6) The “Bitcoin as digital gold” narrative: correlation illusions and structural differences
6-1. Co-movement is often liquidity-driven
Periods in which equities, gold, and Bitcoin rise together are frequently explained by broad liquidity expansion rather than shared intrinsic hedging properties. Interpreting such episodes as proof of Bitcoin’s equivalence to gold can misattribute causality.
6-2. Structural distinction: opacity vs transparency
Gold’s transaction chain is difficult to trace, supporting censorship resistance through practical anonymity. Bitcoin’s ledger is transparent by design, offering different utility and risk properties.
Bitcoin remains highly volatile and often behaves as a risk asset. While ETF adoption may indicate deeper institutional access, it does not by itself establish parity with gold as a defensive asset.
7) Underemphasized points (reframed for investor analysis)
7-1. The core of the supercycle thesis is an AI-driven power bottleneck
Silver and copper are often framed as “AI beneficiary commodities.” The more decisive inflection may occur if power availability and grid capacity become binding constraints.
Data center scaling is not only a server procurement issue; it is an electricity sourcing and cost problem. Grid expansion has long lead times (permitting, construction) and high materials intensity, which can make copper and silver physical bottleneck assets.
7-2. Inflation outcomes depend on where liquidity is directed
A key macro distinction is the transmission mechanism of liquidity. Post-2008 liquidity was more financial-system-centered, tending to support asset prices. In 2020, broader household-level transmission supported both asset prices and consumer inflation dynamics.
Looking forward, the key variable is not only “more liquidity,” but who receives it and how it is spent, which can materially affect commodity pricing and inflation pathways.
7-3. The primary risk in silver exposure is volatility management
The same characteristics that can enable silver to outperform can also produce deeper drawdowns. Portfolio construction should prioritize position sizing, staging/entry discipline, and horizon alignment (tactical vs long-term).
8) Monitoring checklist: indicators that can inform the next move in silver and copper
The following indicators integrate macro, industrial, and policy signals.
- US rate-cut expectations and USD direction (USD weakness is generally supportive for commodities)
- Data center buildout pace (paired with power demand estimates)
- Transmission/distribution and substation capex (direct linkage to copper intensity)
- Exchange-tracked silver inventories (LBMA/COMEX/Shanghai)
- Directionality of GSR (sentiment and regime-shift proxy)
This framework is best evaluated alongside the broader set of themes: commodity supercycle dynamics, inflation risk, rate cuts, USD trends, and supply-chain reconfiguration.
< Summary >
AI and semiconductor scaling is increasing data center and power infrastructure investment, re-rating copper and silver as bottleneck inputs rather than discretionary cyclical commodities.
Silver’s higher volatility, rising industrial demand, and low supply elasticity can create higher upside convexity, accompanied by materially higher drawdown risk.
Bitcoin’s co-movement with gold is often liquidity-driven; treating it as a direct safe-haven substitute can misread regime dynamics and risk behavior.
Near-term pricing may be driven less by linear forecasts and more by power bottlenecks, inventory drawdowns, and the distributional path of liquidity expansion.
[Related Articles…]
- Silver Price Outlook: Industrial Demand and Inventory-Based Checkpoints
- Data Center Power Constraints: AI-Era Infrastructure Investment and Commodity Market Implications
*Source: [ 경제 읽어주는 남자(김광석TV) ]
– AI·반도체가 만들어낸 원자재 슈퍼사이클의 끝판왕의 등장. 공급은 고갈, 수요는 폭증. 은값 폭발한다 | 경읽남과 토론합시다 | 양베리(조규원) 4편
● Fed Power Myth Sparks AI Credit Crunch
Why the Claim That the Fed Is Not the “Real Power” Sounds More Ominous Today
The current U.S. market shows two parallel developments.
On one side, venture capital is concentrating at near-unlimited scale into a small set of firms such as OpenAI and Anthropic.
On the other, credit availability is tightening for regional banks and small-to-mid-sized businesses, increasing restructuring pressure.
Key points covered below:
① How “Morganization” is re-emerging in the 2026 AI cycle
② Why the Federal Reserve operates as an “institutionalized J.P. Morgan”
③ Why AI infrastructure (semiconductors, cloud, data centers, power) functions as an entry ticket to the new credit order
④ The mechanism of “credit rationing” not fully explained by rates and inflation alone
⑤ Under-discussed transmission paths for the next shock (regional banks / commercial real estate / venture ecosystem)
1) Current headline: “Of $91.5B in venture investment, nearly half went to OpenAI and Anthropic”
A key data point is the concentration of funding.
In Q1 2025, total U.S. venture investment was $91.5B, of which $44.5B went to two companies: OpenAI and Anthropic.
The remaining ~3,990 startups shared the other half.
This indicates more than elevated interest in AI.
Capital allocation is shifting from selecting “growth sectors” to selecting “system-maintaining candidates.”
2) A rule set from 118 years ago: “Morganization” = ending excess competition through consolidation
A central concept associated with J.P. Morgan is not wealth accumulation but Morganization.
In late-19th-century industries such as railroads, where too many firms competed and pricing became a prolonged chicken game,
Morgan convened executives to halt competition via consolidation.
If firms resisted, financing was withdrawn; if they agreed, capital was provided to the new consolidated entity.
Core logic:
Competition is wasteful → control and order are efficient → capital is an instrument to impose order
3) The Panic of 1907: In a U.S. without a central bank, Morgan acted as a one-man Fed
During the 1907 crisis (bank runs, equity declines), the U.S. lacked a modern central bank and public-sector tools were limited.
Morgan summoned bankers to his residence (now the Morgan Library), reviewed balance sheets, and
triaged which institutions would be supported and which would be allowed to fail.
A widely cited detail is that doors were locked until funding commitments were finalized.
The relevance is structural rather than anecdotal:
In crises, the system is driven less by “markets” and more by “selectors.”
4) The Fed’s founding in 1913: “The Fed did not eliminate Morgan; it institutionalized him”
A core thesis is:
“The Fed did not remove Morgan; it institutionalized J.P. Morgan.”
This framing implies that the key development was not merely the creation of a backstop,
but the embedding of a state-level function that determines who is eligible for credit.
Under this view, “monetary policy” is not only rate setting; it is the allocation of credit, which constitutes power.
5) The 2023 SVB episode: what “$42B withdrawn in 48 hours” demonstrated
The SVB run, with $42B withdrawn within 48 hours, illustrates the speed of digital-era bank runs and supports the view that
crisis response remains “Morgan-like.”
The Fed’s decision to protect deposits and J.P. Morgan Chase’s role in acquiring First Republic were structurally significant.
When crises emerge, rescue and resolution occur simultaneously, and control over those decisions shapes the system.
6) J.P. Morgan’s “Top Picks” list is not a recommendation list; it is a roster of entry tickets to the AI economy
Companies cited as 2026 top picks (Alphabet, Broadcom, Synopsys, Palo Alto, etc.) share a common trait:
they sit in AI foundational infrastructure—AI semiconductors, cloud infrastructure, data centers, and cybersecurity.
The inclusion of energy names such as Exxon Mobil aligns with AI’s physical constraints.
Data centers are power-intensive, and the energy supply chain (fuel, generation, transmission, and distribution) can cap AI growth rates.
Interpreting the list as “high-potential equities” is incomplete.
The implied message is:
Entities that do not contribute to AI infrastructure risk being pushed to the periphery of the credit center.
7) Two economies are operating simultaneously in the U.S.
7-1) The upper economy: credit oversupplied
Large financings for OpenAI, high valuations for Anthropic, and references to mega-projects such as Stargate indicate
capital concentration toward “system-critical” nodes rather than generic growth trades.
This segment can attract funding with limited sensitivity to interest-rate levels.
The underlying driver is the perceived risk that losing AI leadership weakens U.S. productivity, national security, and reserve-currency resilience.
7-2) The lower economy: credit constrained
Regional banks, less competitive SMEs, and legacy sectors face a more typical sequence:
credit contraction, collateral revaluation, and restructuring.
Jamie Dimon’s warning that “if you see one cockroach, there are more” signals potential spillovers beyond isolated cases,
including structural vulnerabilities such as asset-liability mismatches and commercial real estate (CRE) exposure.
8) Reframing: the key axis missed by rate/inflation narratives—credit “eligibility,” not only credit “price”
Markets are commonly explained via policy rates, inflation, and recession probabilities.
These remain relevant, but a higher-order mechanism appears to be operating.
The dividing line is shifting from “is credit expensive?” (rates) to “who is eligible for credit?” (qualification).
Within this framework, Fed policy can be interpreted as more than inflation management:
stabilizing the financial system while the economy reallocates toward an AI-centered productivity regime.
9) Key points typically underemphasized
9-1) Not “Fed vs. Wall Street,” but a merged selection system
Many narratives stop at “the Fed moves markets.”
A stronger interpretation is that the Fed is not an independent actor but an institutionalized Morgan-style selection function embedded in the system.
9-2) Beyond the AI bubble debate: even if valuations reset, infrastructure remains
Debate over AI overheating will continue.
If capital concentrates in chips, cloud, power, and security rather than only apps and services,
the dynamic resembles industrial infrastructure rebuilding more than dot-com-style evaporation.
9-3) Regional-bank stress as an economic remapping process
Regional-bank weakness is often framed as a replay of systemic crisis risk.
A more fundamental view is a shift in credit creation from regional models toward AI and Big Tech-centered structures.
Credit flows increasingly migrate from “local” to “platform/infrastructure.”
9-4) The productivity bottleneck is not only GPUs; it is power, transmission, and permitting
AI investment discussions overemphasize GPUs.
Key constraints include data-center power supply, transmission capacity, cooling, land availability, and permitting timelines.
This explains why energy exposure appears alongside AI infrastructure.
10) Forward monitoring: three questions likely to separate outcomes through 2026
① Where does credit concentrate further?
If concentration toward AI infrastructure (semiconductors / cloud / power / security) persists, the two-economy split may widen.
② Where is the restructuring epicenter?
If stress expands across regional banks, CRE, and vulnerable SME lending, the set of “resolved” entities may broaden.
③ Which stability tools does the Fed deploy beyond rate policy?
Key signals include the design and expansion of liquidity backstops (deposit protection, emergency facilities, and M&A facilitation).
< Summary >
“Morganization” described the use of consolidation and credit selection to rationalize overcompetitive industries.
In 1907, Morgan functioned as a de facto central bank by deciding which institutions would be supported versus allowed to fail.
The Fed’s creation in 1913 can be viewed as institutionalizing this selection function; monetary policy is ultimately credit allocation power.
The 2023 SVB episode and the First Republic acquisition illustrated that this triage mechanism remains operative in modern crises.
Capital is concentrating in AI infrastructure—semiconductors, cloud, data centers, power, and security—while other segments face restructuring pressure.
The central shift is not only rates/inflation, but changing criteria for credit eligibility.
[Related posts…]
- A consolidated view of how changes in Fed policy affect asset markets
- The data-center power race: why energy infrastructure decides outcomes in the AI era
*Source: [ Maeil Business Newspaper ]
– “연준은 대리인일 뿐” 미국 돈줄 쥐고 흔드는 진짜 정체 (JP모건/경제전망) | 매일뉴욕 스페셜 | 홍성용 특파원