● Solo CEO hacks 830K deals into a 10-second decision machine, AI dashboard revolution
How 830,000 Transaction Records Were Turned into 10-Second Decisions by the CEO Alone: The AI Work Revolution Shown by the VibeCoding Dashboard
This article contains exactly four core points.
1) The internal dashboard construction flow that broke the “data request → wait → bottleneck” chain
2) Practical screen design that clusters 830,000 transaction/click records with AI and extracts insights immediately
3) A realistic architecture that operates ‘securely’ with BigQuery + Gemini + Vercel + 2FA
4) The real point that many news outlets and YouTube channels miss: the story of creating a decision-making OS, not just a “dashboard”
1) News briefing: A single question like “What sold the most last month?” created a 30–60 minute bottleneck
Seongcheol Shin, CEO of MomentStudio, is not from a development background, and what he found most frustrating in his work was “not being able to see the data you need right away.”
Every time a question like “What sold the most last month?” came up, the structure required the dev team or data staff to run a query, so waiting times accumulated and ultimately created a typical bottleneck that slowed decision-making speed.
So the chosen approach was to build an internal data dashboard based on VibeCoding.
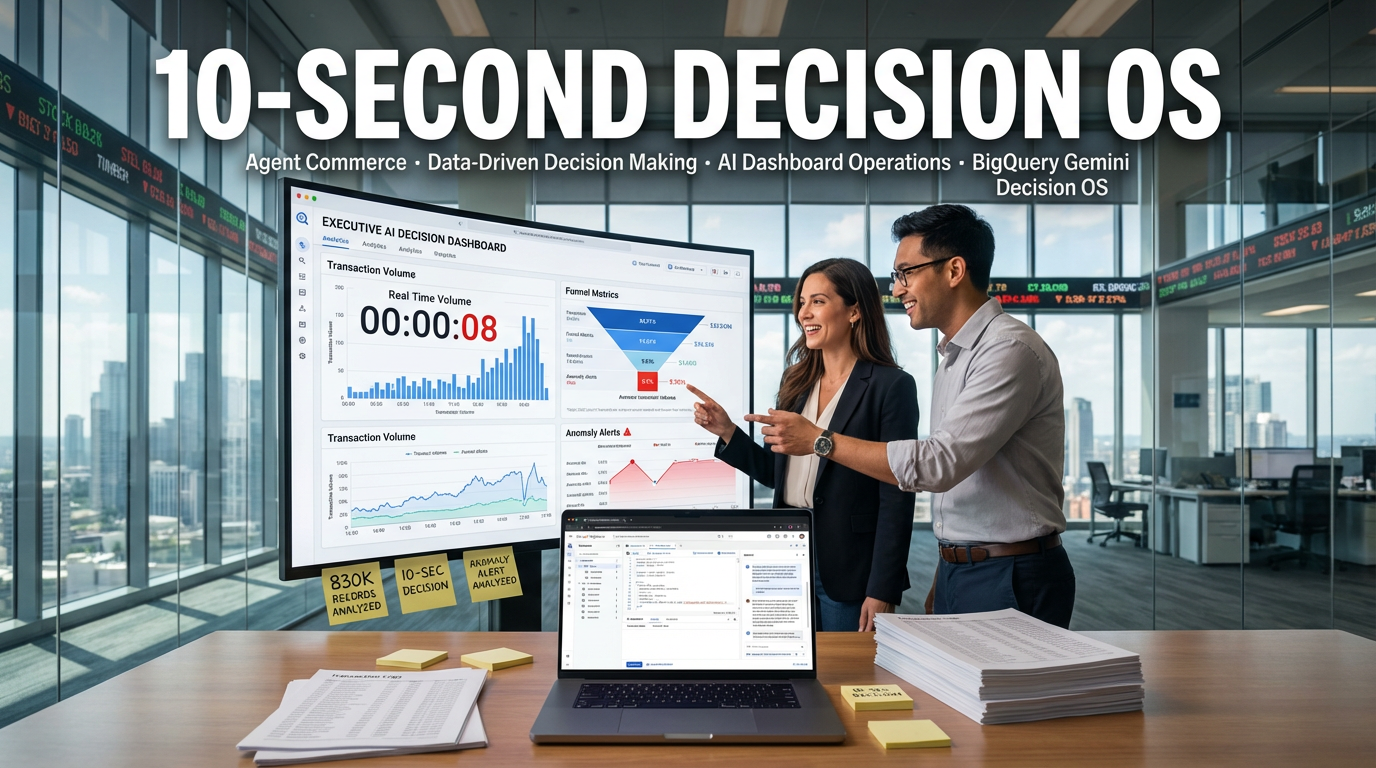
They visualized 830,000 transaction records and attached an AI chatbot that, when asked in natural language, even produces charts, creating a state where “10 seconds is sufficient for decision-making.”
2) What was built: an operational dashboard “like YouTube Studio” + an AI data chatbot
The screen CEO Shin built shows the metrics that operators want to see every day at a glance.
It is not a merely pretty report but is designed so you can immediately see “this week/month’s business blood pressure.”
Typical metrics placed prominently include the following.
Total number of links created
Clicks per link
Total transaction value / number of transactions
Number of creators (total and by period)
Recent transaction details (reflecting update cadence)
The important point here is that “who wants to see it” is clear.
It is designed so the CEO/leader can grasp the situation in 10 seconds before a meeting and ask the team precise questions, which is the core point.
3) The sparser the data, the more explosive the effect: AI groups messy product names/categories
This case is especially strong because MomentStudio’s structure is affiliate (performance-based creator commerce), so the data is not neatly consolidated like a single mall.
There are about 1,000 partners and roughly 110,000 product SKUs, and product names/categories are all over the place in terms of formatting.
With traditional methods, humans would be stuck organizing endlessly.
New products keep appearing in the middle of organizing, and the same product is labeled differently, so normalization costs can grow without bound.
Here, AI performs product grouping (clustering).
For example, even if Universal Studios Japan (USJ)-related products have different names across platforms/partners, AI groups them together so you can view “USJ total sales” at once.
Why this matters is that in commerce, decision-making often needs a “meaningful product group” more than an “exact single SKU.”
Marketing budget allocation, creator guidance, and seasonal strategies often benefit far more from group-level insights.
4) Turning the purchase flow into a flowchart was the real practical move: recommendations and bundling come out immediately
One impressive feature CEO Shin built is purchase flow analysis.
It shows the order in which people buy things when preparing for a trip in a flowchart format.
An example of insights shown is as follows.
One month before a trip: hotel payments increase in proportion
Within three weeks of a trip: tour/activity payments surge
Airfare → hotel → SIM card/eSIM (network) → transportation… connected next actions
Once this is visible, what becomes useful is that “for people who bought a hotel, next recommend SIM cards/transportation” type cross-sell rules can be automatically designed.
In other words, data analysis no longer ends with reporting but becomes a structure that directly leads to revenue.
5) Realistic technology stack: BigQuery + Gemini API + Vercel + 2FA
The core technology combination shared in the video follows this flow.
Source DB → ingest into BigQuery for read-only analysis
Dashboard web app → BigQuery queries + visualization
Natural language questions → Gemini API assists in generating SQL/charts
Deployment is Vercel-based
Access control applies Google Authenticator-based 2FA (session expiration/re-authentication)
The key here is “moving the data.”
Because touching the source data directly is risky, they created a sandbox (read-only / isolated space) and experimented freely on top of that.
This is a textbook approach that captures both security and productivity.
One more realistic point.
Using lightweight models like Gemini 2.0 Flash keeps token costs lower than expected, making them sufficiently usable for internal analysis.
6) The real change from an operational perspective: when the leader’s questions change, the organization’s speed changes
The essence of this case is not the dashboard itself but the change in how leaders work.
Previously, “Please pull the data” was the end of a request, and waiting times occurred.
Now leaders check directly, ask follow-up questions immediately, and design the next experiment right away.
This flow aligns with productivity innovation more broadly these days.
In a high-interest-rate environment where labor and development resources feel more expensive, decision speed becomes competitive advantage.
AI-based automation works not simply as cost reduction but as a way to boost execution capability.
7) The most important things other YouTube/news outlets don’t often say
The real core point here is not that a non-developer coded it.
First, this is closer to a decision-making OS than a dashboard.
Visualization + natural language queries + an immediate verification loop redesign the company’s decision-making process itself.
This is different in kind from simply buying another BI tool.
Second, the design assumes AI is good at ‘speedy approximations’ rather than ‘perfect answers.’
Product clustering may not be 100% perfect.
But it is a winning game to observe market reactions immediately with 70–90% accuracy and add exception handling, rather than waiting months for perfect consistency.
This mindset is today’s practical operation approach for AI product development and the agent era.
Third, if leaders share prompts/results themselves with the dev team, communication costs drop sharply.
As CEO Shin said, the dev team is better at putting the finished product into production.
Instead, the leader rapidly prototypes “what I want” as prompts/screens/charts, and the dev team optimally hardens that into a safe, robust product through division of labor.
Fourth, internal data usage is the preliminary stage of data monetization.
It begins with internal operational efficiency, but once it reaches a certain level, you can partially reveal useful metrics to creators or productize insights as paid offerings.
This aligns exactly with the new revenue models companies are pursuing in the current data economy.
8) If you want to apply this case to your organization: an execution checklist
1) First, write down “the 10 questions I want to see first every day/week.”
What were last month’s best-selling products?
Performance by channel/creator?
Trends by city/country?
What is the next action after purchase conversion?
2) Do not touch the source DB directly; replicate it into a read-only analysis area like BigQuery.
This single rule greatly reduces security and outage risks.
3) The first version should focus only on “10-second decision-making,” not a perfect dashboard.
If you get greedy about features, you will fail.
4) When attaching natural language queries (LLMs), secure “permissions/access control/logging” before cost considerations.
Apply 2FA, session expiration, IP restrictions, and the principle of least privilege first.
5) Finally, expand this process into team culture.
Start with small hackathons and small automations so business teams begin improving their own work.
9) From an SEO perspective, what this case implies for 2026 trends: AI search, agentic commerce, and data-driven decision-making
Commerce and marketing are shifting toward a flow where “being called” matters more than “being exposed.”
AI search optimization is becoming increasingly important, and agentic commerce, where AI intervenes in purchase journeys, is expanding.
Ultimately, companies must quickly experiment with data-driven decision-making, redesign customer experience, and manage performance marketing ROI more tightly to survive.
This case shows that the change comes as a redesign of work processes, not as a simple tool purchase.
< Summary >
A non-developer CEO connected 830,000 transaction records to a dashboard + AI chatbot with VibeCoding and reduced decision time from 30–60 minutes to 10 seconds.
The core point is not the BI tool but the elimination of workflow bottlenecks through a read-only data sandbox + LLM queries + fast verification loops.
AI clustering grouped messy product names/categories to generate insights, and visualizing purchase flows linked analysis directly to recommendations and cross-sell strategies.
This model is a representative data-driven decision-making case for productivity innovation and execution strengthening in an era of high interest rates and cost pressure.
[Related articles…]
AI trends and corporate productivity: How workplace automation in 2026 is changing organizational operations
Commerce data strategy: Designing dashboards that connect to revenue in the agentic commerce era
*Source: [ 티타임즈TV ]
– “83만건 거래데이터, 자양강강제로 버티며 대시보드 만들었죠” (신성철 모먼트스튜디오 CEO)