● US China Power Clash, Rare Earths, Chips, AI, Dollar, Korea Survival Strategy
Trump vs. Xi Jinping: The Endgame of a Decade-Long US-China Hegemony Rivalry (2025–2030) — Resource, Currency, and Technology Conflict and Korea’s Survival Strategy
The US-China rivalry is not a conventional diplomatic dispute. It is increasingly shaping the core variables of the 2025–2030 global economy, including US-China tensions, semiconductor supply chains, rare earths leverage, dollar hegemony, and AI infrastructure competition.
The more probable outcome over the next decade is a prolonged, managed competition rather than a decisive victory by either side. In this process, global supply chains, capital markets, AI industry structure, and the monetary order may undergo material shifts.
1. The G2 Era Is Entrenched: Not US Unipolarity, but a US-China Dual-Power System
A key premise for interpreting the global economy has shifted: the system is increasingly difficult to frame as US-only hegemony.
The United States remains the strongest power in economic scale, military capability, financial infrastructure, and technology leadership. China, however, is no longer a pure follower; it is exerting pressure through manufacturing depth, resource control, power-generation capacity, and the scale of its technical talent base.
- The United States remains the largest economy by aggregate influence
- China continues to narrow the gap in GDP terms
- The relative weight of traditional G7 economies is declining
- Global alignment is increasingly organized around a US-versus-China axis
The core issue is not GDP levels alone, but the reordering of global alignment around the two poles.
2. The Practical Message of Recent High-Level Engagement: Not Detente, but “Managed Competition”
Recent leader-level meetings may appear as de-escalation, but the more relevant interpretation is transition into a controlled-risk competition framework.
The US approach is typically transactional and short-cycle, emphasizing commercially actionable outcomes (e.g., trade, energy supply, import expansion, and selective sanction relief). China’s approach is longer-horizon and structural, emphasizing management of systemic change and multipolar narratives.
- United States: transactions, procurement, targeted easing, energy and trade deliverables
- China: system competition, order reconfiguration, multipolarity, long-term influence expansion
- Shared baseline: avoid immediate uncontrolled confrontation; preserve a manageable competitive equilibrium
The relationship is best characterized as competitive stabilization rather than normalization.
3. The Defining Concept: The Thucydides Trap
The rivalry is often framed through the Thucydides Trap: structural conflict risk between an incumbent power and a rising challenger.
The key point is less the probability of war and more China’s capacity to openly operate within a hegemonic-competition frame, indicating a shift from unilateral US dominance to reciprocal power constraint.
4. First Battlefield: Resource Leverage — Rare Earths as a Strategic Instrument
Semiconductors are central to technology leadership, but the underlying constraint layer is resource control: inputs required for semiconductors, batteries, EVs, defense systems, and AI hardware.
4-1. China’s Overwhelming Position in Rare Earths
China controls not only mining but also refining and permanent magnet manufacturing across much of the value chain.
- Rare earth mining: China holds a high global share
- Rare earth refining: near-dominant global position
- Permanent magnets: China-centered supply network
The primary bottleneck is refining, not extraction. Many countries can mine ore; far fewer can refine at industrial scale.
If rare earth flows are constrained, potential impacts include:
- disruptions in semiconductor manufacturing equipment components
- EV motor production constraints
- battery and advanced electronics supply constraints
- defense-industrial component shortages
- AI server and high-performance electronics production constraints
China therefore retains credible capacity to weaponize rare earth supply.
4-2. Why the United States Cannot Easily Apply Unilateral Pressure
While the United States has strong military and financial-sanctions tools, it is relatively weaker in resource and refining supply chains. High China exposure in rare earths, lithium refining, magnet production, and nonferrous smelting limits the feasibility of full decoupling.
This mutual vulnerability incentivizes prolonged competition rather than rapid knockout dynamics.
5. Second Battlefield: Currency Power — Dollar Dominance Persists, but RMB Footprint Expands
The dollar remains the dominant unit in international settlement, reserve composition, commodities pricing, and trade finance. Near-term displacement is unlikely.
The material question is not whether the dollar collapses, but the extent to which China can reduce dollar dependency and expand RMB-based payment rails.
5-1. China Is Scaling CIPS as a SWIFT-Adjacent Alternative
Post-sanctions lessons reinforced China’s assessment that reliance on Western financial infrastructure introduces geopolitical fragility. China is expanding CIPS (Cross-Border Interbank Payment System) as part of financial sovereignty strategy.
- United States: sanction capacity via SWIFT-linked dollar settlement networks
- China: CIPS expansion to support RMB internationalization
- Objectives: sanction circumvention optionality, settlement diversification, financial bloc formation
5-2. Trade Is the Primary Driver of RMB Internationalization
China’s manufacturing scale and trade relationships enable incremental RMB settlement adoption, particularly in energy, commodities, infrastructure investment, and Belt-and-Road-adjacent trade.
The key shift is directional: even modest RMB share increases from a low base may matter over a 10-year horizon as settlement habits and trade conventions evolve.
6. Third Battlefield: Technology Leadership — Semiconductors and AI at the Core
Technology competition is the most active front, with semiconductor supply chains and AI capability as the center of gravity.
6-1. China’s Advantage: Talent Scale and Execution Speed
China produces a large volume of STEM graduates, shaping future R&D capacity and industrial staffing.
- China: large-scale STEM talent pipeline
- United States: top-tier research leadership and platform ecosystem power
- Structural contest: talent quantity versus ecosystem quality
The United States remains ahead in advanced design, software, semiconductor equipment, and frontier AI model ecosystems. China is leveraging policy support, domestic demand, and manufacturing depth to compress catch-up timelines.
6-2. US Semiconductor Controls: Effective Delay Mechanism with a Reinforcing Feedback Loop
US export controls target China’s access to advanced GPUs, leading-edge semiconductor equipment, and sub-advanced-node process capabilities (e.g., EUV lithography constraints).
The intended effect is time-delay. The observed side effect is stronger domestic substitution incentives.
6-3. Signals from Huawei and CXMT: China Is Pursuing Workarounds and Domestic Capacity
Huawei continues efforts to demonstrate partial semiconductor self-reliance under constraints. While not a full substitute for US-frontier capability, it challenges assumptions of infeasibility.
In memory, CXMT is expanding presence through DDR5-scale production, large capital spending, and public-market preparation, signaling a strategy to raise domestic supply coverage.
- Huawei: workaround-driven semiconductor development under restrictions
- CXMT: expanded memory production capacity
- China strategy: secure domestic baseline supply for critical demand
In parallel, the United States is accelerating domestic manufacturing capacity expansion through major firms to reshape supply chain resilience.
The semiconductor contest is increasingly a state-backed “self-sufficiency buildout” competition rather than a purely commercial technology race.
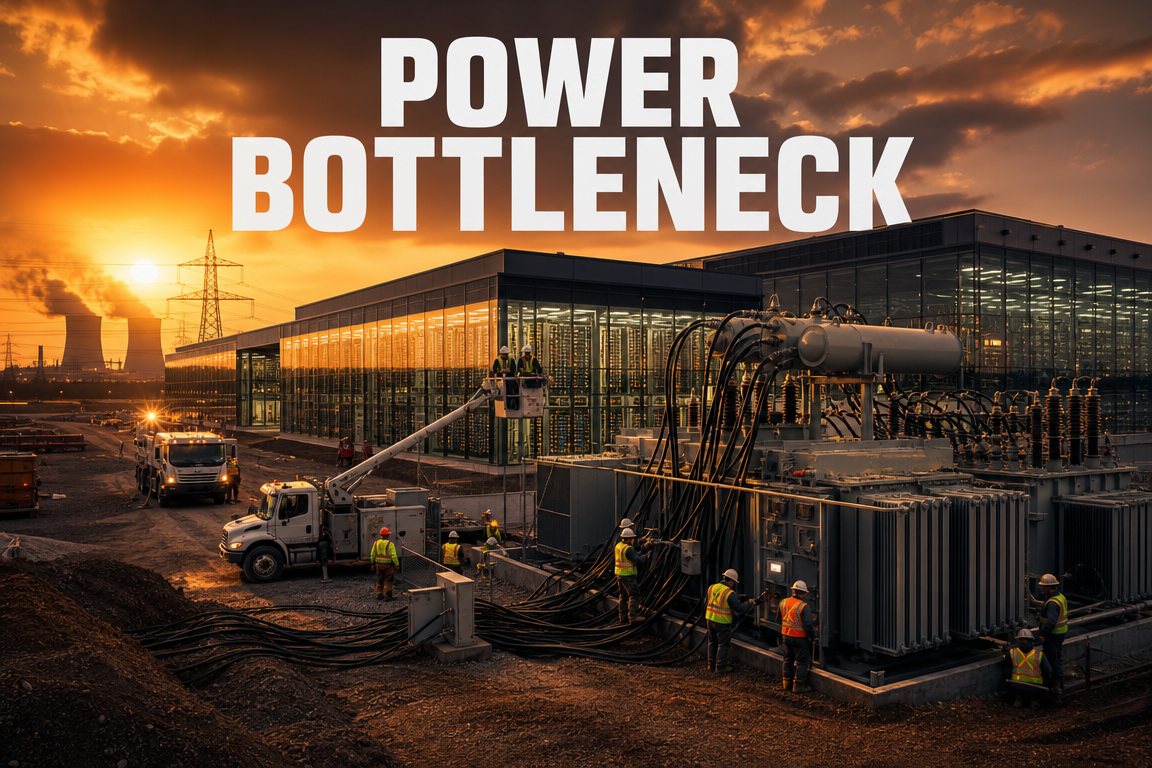
7. The Key Variable in AI Leadership: Not Only Chips, but Power
AI data centers are power-intensive. In an era where compute scale translates into competitive advantage, the ability to supply low-cost, reliable electricity becomes a structural determinant.
China has potential advantages in large-scale power generation capacity and infrastructure build speed.
- AI competitiveness = semiconductors + data + talent + power
- power capacity becomes foundational for future compute scale
- China can leverage industrial-scale electricity systems
AI competition is therefore also an energy and infrastructure competition.
8. Likely Outcome: “Two Worlds” Rather Than Winner-Take-All
A near-term scenario in which China fully overtakes the United States is difficult to assert, given US strengths in finance, military capacity, reserve currency status, and innovation ecosystems. Conversely, a scenario in which the United States fully suppresses China’s rise is also unlikely, given China’s manufacturing depth, refining dominance, domestic market scale, industrial policy capacity, and speed of technological substitution.
A more realistic baseline:
- coexistence of a US-centered bloc and a China-centered bloc
- partial bifurcation of supply chains, payment networks, and technology standards
- selective connectivity alongside selective separation
- global priority shifts from efficiency toward security and resilience
9. Korea’s Survival Strategy: Strategic Clarity and Chokepoint Positioning
Korea has historically benefited from strategic ambiguity between the two powers. Forward conditions may demand clearer delineation of protected interests, cooperation domains, and red lines.
9-1. Korea Cannot Dominate All Domains
Resource constraints require prioritization. The objective is to secure defensible leadership in domains that both blocs require but cannot easily substitute.
This is a chokepoint strategy.
9-2. Why Chokepoints Matter
Chokepoints are critical nodes in global value chains that must be crossed. Control of such nodes increases bargaining power and strategic relevance under bloc competition.
Potential chokepoint domains:
- key technologies within advanced semiconductor processes
- high-value materials, components, and equipment
- next-generation battery critical processes
- AI semiconductor packaging and testing
- precision manufacturing and industrial automation solutions
The objective is not alignment by exclusion, but indispensability as a required technology partner.
10. Capital Markets and Investment Implications
The rivalry is not limited to geopolitics; it is a structural driver of industrial re-mapping and market volatility.
- beneficiaries of semiconductor supply chain reconfiguration
- industries tied to rare earths and critical minerals security
- AI data centers, power infrastructure, and cooling solution demand growth
- structural growth in defense, aerospace, and industrial automation
- FX volatility linked to dollar strength versus RMB internationalization efforts
Rates alone are insufficient as a macro lens; supply chain control, technology standards, and resource leverage are increasingly material variables.
11. Key Takeaways Often Underemphasized in Mainstream Coverage
- (1) Management, not decisive victory, is the operating mode
Competition is being stabilized and controlled rather than concluded. - (2) The base layer of technology competition is resources and power
Semiconductors and AI require rare earths, refining capacity, and electricity infrastructure. - (3) Currency power shifts begin through trade settlement
The RMB is unlikely to replace the dollar soon, but settlement diversification can reshape long-term financial architecture. - (4) Korea’s core answer is chokepoints, not binary alignment
Strategic leverage is maximized by securing indispensable positions in critical value-chain nodes.
12. Conclusion: The “Winner” May Not Be a Single Country
A plausible end state is not unilateral dominance, but parallel systems:
- the United States retains core pillars of hegemony while failing to fully prevent China’s independent bloc formation
- China does not fully replace the United States, but builds a durable economic and technology sphere
- the global system moves from integrated globalization toward a less efficient, partially bifurcated structure
Korea’s outcome is likely to be determined less by bloc selection and more by the ability to secure non-substitutable technologies and supply chain positions.
< Summary >
The US-China rivalry is a multi-front, long-duration competition spanning resources, currency infrastructure, technology, and AI power-intensive infrastructure. The United States remains structurally strong, while China retains leverage in rare earth refining, manufacturing depth, power capacity, and talent scale. The more likely trajectory is bloc coexistence rather than decisive victory. Korea’s priority is strategic clarity and chokepoint positioning. Key investment variables include semiconductor supply chain reconfiguration, dollar-system durability versus RMB settlement expansion, AI infrastructure buildout, and critical mineral security.
[Related Articles…]
- Semiconductor Supply Chain Reconfiguration: Key Variables for 2025–2030
- AI Infrastructure and Power Demand: Where the Next Capex Cycle May Concentrate
*Source: [ 경제 읽어주는 남자(김광석TV) ]
– 트럼프 vs 시진핑, 미중 패권전쟁 10년… 최후의 승자는? [경읽남 250화]
● KOSPI-10000-Bull-Case-Eyes,AI-Semiconductor-Driven,Rate-Shift,liquidity,earnings-surge
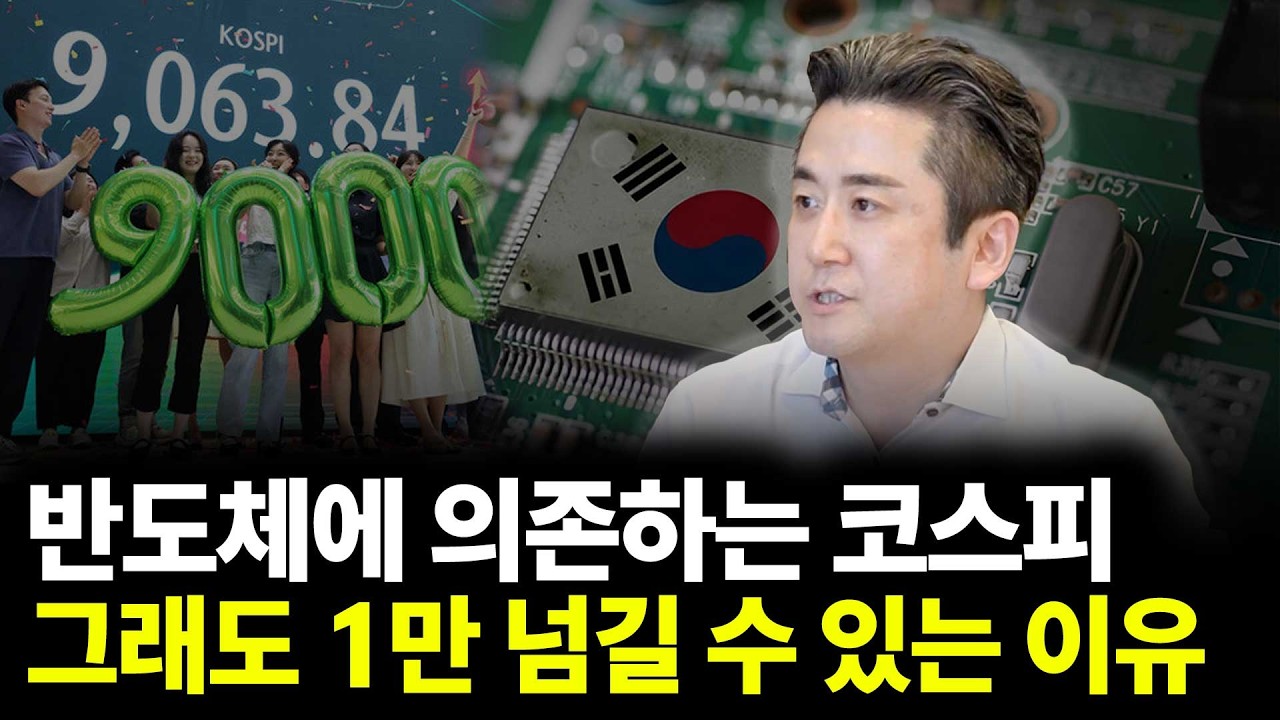
Semiconductor-Heavy KOSPI: Why a Move Toward 10,000 Remains Plausible — Rates, Earnings, AI, and Liquidity in One Framework
This is not a binary “up or down” discussion.
Key issues to connect:
- Why the market stayed resilient despite a rate hold
- Why earnings may be priced more aggressively in 2H
- Why a semiconductor-concentrated index can still support a 10,000-level narrative
- Why the main inflection window is late August to early September
This note emphasizes factors often underweighted versus headline themes such as “rate-hike fears” or “semiconductor supercycle”:the rate of change in earnings expectations, liquidity-regime shifts, leadership vs. laggard rotation, and KOSPI valuation normalization.
Equities, global macro, inflation dynamics, semiconductors, and AI capex should be assessed jointly to interpret the current regime.
1. This FOMC Was Less Hawkish Than It Appeared
Key Point 1: More important than the hold was the absence of a clear “restart of the hiking cycle”
The stance looked hawkish on the surface:
- The dot plot shifted higher.
- Markets began to reprice the probability of additional hikes this year.
However, the market did not materially dislocate because the shift resembled a marginal adjustment rather than a decisive 25 bp-style tightening signal. The message was closer to risk management against potential inflation re-acceleration in 2026 than a formal resumption of aggressive tightening.
Key Point 2: Reduced guidance likely aimed to limit market shock
The market focus was not only on tone but also on the reduced volume of forward signals. Relative to prior meetings, guidance through dots, commentary, and statement language was curtailed. This can be read as an effort to avoid adding noise and to reduce policy-interpretation volatility.
Key Point 3: Potential shift toward a “lower-frequency communication” Fed
A notable procedural element was that a specific figure did not directly participate in the dot plot. Beyond process, this may signal an evolution toward less frequent but more consequential communication. Near term, this can increase interpretive uncertainty; longer term, it may reduce excessive narrative swings.
2. The Primary Variable Is Not Today’s Rates, but Next Year’s Inflation Trajectory
Next year matters more than this year
Markets should focus less on whether the US enters a renewed tightening cycle this year and more on whether inflation could structurally re-accelerate in 2027.
Current stability partly reflects easing shelter inflation. However:
- Services inflation excluding housing is showing signs of re-acceleration.
- Core goods inflation appears to have bottomed.
- Fertilizer prices, a driver for food inflation, have surged.
These factors imply inflation risk may rebuild into next year.
Oil has reduced near-term pressure
Easing Middle East risk and negotiation progress helped bring oil down to around USD 75. If oil had been near USD 100 during this FOMC, the market reaction likely would have been more severe, as hawkish messaging would have appeared more actionable. The pullback in oil supports near-term stabilization in inflation pressure, yields, and the dollar.
3. Why Rate Hikes Are Not Automatically Bearish for Equities
Historically, the “reason for hikes” has mattered more than the hikes themselves
A mechanical “higher rates = lower equities” framework is incomplete. Since the 1990s, equities frequently advanced during hiking cycles when hikes reflected strong demand and improving earnings. Conversely, cost-push inflation (e.g., supply shocks, oil spikes) tends to compress margins and weigh more directly on equities.
The current regime is mixed
Growth indicators across Korea, the US, and China have been more resilient than expected, and manufacturing data have stabilized. AI and semiconductors are supporting the industrial cycle. This reduces the probability of immediate equity breakdown from modestly higher rates, though higher yields may cap upside while earnings provide downside support, reinforcing a range-bound risk profile. As the horizon moves into next year, inflation-policy combinations warrant closer monitoring.
4. Why 2H — Especially July to August — Could Be Stronger
Earnings are not fully reflected in prices
The market’s strength is supported less by sentiment and more by rapid and sizable earnings upgrades. Korea’s exports and profit expectations have improved materially, supported by:
- Strong daily-average export growth (as of May)
- Rising semiconductor prices
- Currency effects amplifying large-cap exporters’ earnings sensitivity
Semiconductor pricing has outpaced earnings revisions
A critical gap remains: the pace of earnings estimate upgrades has not fully caught up with memory price momentum. In 1Q, earnings growth exceeded what pricing alone implied; currently, prices are being acknowledged while earnings forecasts remain comparatively conservative. This preserves upside risk to estimates through 2Q reporting and the August confirmation window.
FX effects remain relevant
Up to May, currency dynamics provided a meaningful tailwind to exporters’ profitability. If KRW weakness persists, upside risk may extend beyond semiconductors to autos, select industrials, and IT hardware.
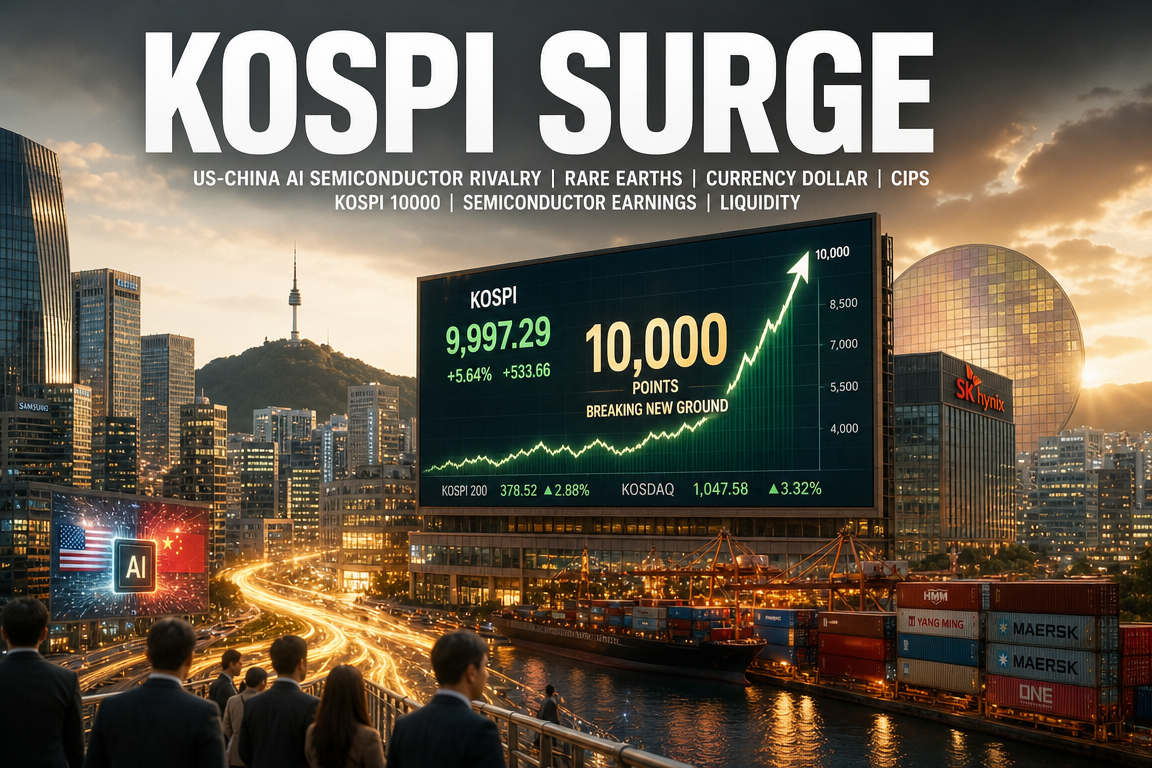
5. Is KOSPI 10,000 Realistic?
Index levels can change faster than expected if earnings support them
KOSPI 10,000 can appear excessive, but the current advance is not purely multiple expansion. Forward 12-month EPS has been revised upward rapidly. If this revision pace persists, the implied index ceiling can rise materially.
Valuation may be normalization rather than distortion
With higher earnings expectations, even a return to average market valuation can reprice the index higher than prior anchors suggest. Under an earnings-upgrade cycle coupled with multiple normalization, KOSPI 10,000 becomes analytically discussable rather than purely rhetorical.
The key question is duration, not a fixed target
In this regime, anchoring on a single index target can be less informative than monitoring how long the uptrend can persist. If earnings expectations continue to rise, targets will move. Fixing the upside in advance risks missing the dominant trend.
6. The Main Inflection Window: Late August to Early September
Markets peak on the deceleration of improvement, not on absolute weakness
Equity peaks typically occur not when earnings are poor, but when the pace of improvement slows. Markets respond to the “acceleration” of earnings more than the level. Forward 12-month EPS momentum is currently strong; given base effects, the rate of change may begin to slow around late August to early September. Even with solid absolute earnings, decelerating upgrades can transition the market into a range.
Jackson Hole and the September FOMC are key checkpoints
Late-August Jackson Hole often introduces broader policy framing. Liquidity balance-sheet direction (drain vs. tolerance) is a key variable. The September FOMC will revalidate dot-plot direction. This supports an interpretation of:
- July–August as a stronger phase
- Post-August as a phase of slower momentum and higher consolidation probability
7. Semiconductor Concentration: Why It Remains Manageable for Now
Concentration is a risk, but the cycle does not yet imply a terminal peak
KOSPI leadership is clearly semiconductor-driven, supported by memory pricing, AI server demand, and HBM-led expansion. The dependency is material; however, at present the more relevant risk is not an abrupt end but a slowdown in the rate of gains.
AI growth can persist while equity performance becomes volatile
Industry growth does not translate linearly into equity returns. Equities are sensitive to the speed of growth and expectation changes. Even if AI demand expands, upside can stall if growth undershoots elevated expectations, consistent with historical patterns seen in other high-expectation sectors. The key risk is expectation normalization rather than structural AI demand collapse.
8. “If Leaders End, the Market Ends”: What It Typically Means
Late-cycle behavior often involves leader fatigue and laggard rotation
Strong rallies often progress from:1) leaders driving the index, then
2) leaders consolidating while laggards catch up via rotation.
The index may appear stable, but internal momentum can weaken. A 2021-style pattern is a reference case: the index can retest highs within a range, but once leadership begins to deteriorate, risk management becomes more important.
The practical strategy is not to abandon leaders, but to pair them with selective laggards
Prematurely exiting core leadership due to eventual peak risk can be suboptimal. A more realistic posture is:
- maintain core positions in semiconductors and AI beneficiaries
- pursue incremental return potential through selective laggards
9. 2H Positioning: Semiconductors as Core, Growth as Optional Reversal
1) Core: semiconductors and AI-linked equities
The dominant drivers remain semiconductors and AI, supported by earnings, flows, and industrial policy/capex. Key areas include memory, HBM, AI infrastructure, servers, and power-related hardware. Autos may also qualify as a high-visibility earnings contributor.
2) Potential reversal candidates: internet, pharmaceuticals/biotech, and KOSDAQ
Sectors receiving limited attention may offer asymmetric rebound potential:
- internet
- pharmaceuticals/biotech
- selected KOSDAQ quality growth
These areas trade near historically depressed valuation levels, and earnings expectations are not uniformly weak. The primary headwind has been rates and higher bond yields; a stabilization in yields could trigger higher beta rebounds.
3) Additional KOSDAQ catalyst: expectations for a new quality index
Beyond cyclical rebound, a new “quality/blue-chip” style index could concentrate flows into firms with stronger fundamentals and governance profiles. If guidelines become concrete, markets may front-run candidate selection, potentially benefiting select equipment/materials, platform names, and large-cap biotech.
10. Why KOSPI May Be Less Prone to Full Mean-Reversion Declines
Governance reform and reduced free-float supply are meaningful
A key underappreciated element is market-structure change. Historically, expanding tradable supply limited the durability of rallies, contributing to repeated range-bound behavior. Recent policy direction (value-up initiatives), governance reforms, and treasury-share related changes may gradually reduce structural discount factors.
Corrections can occur, but full retracement risk may be lower than in prior cycles
This does not imply the absence of drawdowns after large gains. However, the probability of returning to prior lows may decline if structural discount compression persists. This framework supports the view of a higher long-term trading range.
11. News-Style Key Takeaways
Rates
The Fed appeared hawkish, but the meeting did not clearly signal a renewed hiking cycle. Lower oil and reduced guidance helped limit market shock.
Inflation
Next year is more important than this year. Ex-shelter services, goods inflation inflection, and fertilizer-driven food inflation pressures imply non-trivial risk of re-acceleration into 2027.
Equities
The driver is not hikes per se, but the rationale behind them. With growth and earnings support, 2H resilience is plausible.
Earnings
The August earnings window is critical. Earnings upgrades have not fully reflected semiconductor price momentum, leaving room for further revisions.
KOSPI 10,000
While it appears aggressive, it is explainable under a combined framework of forward EPS expansion and valuation normalization.
Inflection
Late August to early September concentrates multiple risks: slowing earnings-upgrade momentum, Jackson Hole, and the September FOMC.
Strategy
Maintain core exposure to semiconductors/AI; consider lagging growth segments (internet, pharma/biotech, KOSDAQ) as potential later-stage rebound candidates.
12. The Most Important Points Often Missed in Headlines
1) Market peaks align with slowing improvement, not with deteriorating earnings
Equities typically pause when the pace of earnings improvement rolls over, even if earnings remain strong.
2) The current regime is driven by “earnings upgrades + reduced liquidity-policy uncertainty”
The principal support has been rapid earnings upgrades. Additionally, the Fed did not force an immediate liquidity-tightening narrative, reducing uncertainty.
3) The key semiconductor risk is near-term speed, not immediate cycle termination
Premature “cycle over” calls are less relevant than monitoring whether expectations are decelerating. Maintaining leadership exposure while diversifying via laggards is more consistent with this phase.
4) Korea’s market-structure shift can be long-duration
Governance reform, value-up measures, and reduced tradable supply can contribute to structural discount compression. This cycle should not be evaluated as a short-lived thematic rally alone.
< Summary >
This FOMC was less hawkish than headline interpretation, and lower oil plus reduced guidance limited market disruption.
In 2H, earnings are more decisive than rates. Semiconductor and exporter earnings upgrades can support stronger performance through July–August.
A KOSPI 10,000 framework is not purely speculative; it can be justified by rising forward EPS and valuation normalization.
Late August to early September is a critical monitoring window due to likely deceleration in earnings-upgrade momentum and key policy events (Jackson Hole and the September FOMC).
Positioning favors maintaining core semiconductor/AI exposure while selectively adding lagging growth segments (internet, pharma/biotech, KOSDAQ) as potential rebound candidates.
[Related Articles…]
- Semiconductor Supercycle and KOSPI Re-Rating Framework
- AI Infrastructure Capex and Global Equity Market Impact
*Source: [ Jun’s economy lab ]
– 반도체에 의존하는 코스피 그래도 1만 넘길 수 있는 이유(ft.이경민 부장 1부)