
● Tesla Smashes Consensus, Near 500k Deliveries, ESS Soars
Tesla Q3 2025 Deliveries & ESS Performance Live Stream Key Highlights: 7 Elements More Important Than Numbers and the Next Trigger
This article contains everything: live Q3 delivery numbers, ESS installation trends, the impact of mix on margins, Kalshi prediction market vs. consensus, event calendar for October–November, the conditions that actually move robo-taxi valuations, and even the energy/data monetization points most people overlook.
The conclusion, ready for market use, is neatly summarized in chronological order.
It also provides a short- and mid-term checklist that bundles the global economic outlook with interest rate and inflation variables.
1) Market Sentiment and Consensus Range Just Before the Announcement
In the previous quarter, deliveries were around 384,000 units, which was widely regarded as disappointing.
ESS installations were around 9.6 GWh, confirming that they remained near their peak.
For this Q3, the consensus was revised upward as the announcement day approached.
The Bloomberg·FactSet range narrowed to the mid-440,000s to the high-450,000s, and independent estimates were adjusted upward from the low 400,000s to the high 400,000s.
In the prediction market Kalshi, although the trading volume was thin and the numbers showed volatility near the end, the real trades provided directional hints.
In pre-market trading, the stock price moved up by around 1–2%, reflecting these expectations.
2) Announcement Timeline and Pattern
Over the last six quarters, patterns show many announcements close to 8 a.m. EST (10 p.m. Korean time).
There have been a few slight delays, but generally updates repeatedly occur between 8:00 and 8:40 a.m.
For a few minutes immediately after the announcement, there may be discrepancies between the official report and media headlines, so it is safest to check the original PDF.
3) The Headline Just Released: Deliveries and ESS Installations
According to the live stream tally, the headline indicates approximately 480,000 deliveries (interpreted as nearly “500,000” in essence).
For energy storage (ESS), a comment mentioned about a +25% growth compared to the same period last year.
These figures need to be cross-checked with the company’s confirmed IR documents.
The numbers themselves exceed consensus expectations and, while partially offset by pre-market pricing, they may attempt an additional rally.
4) It’s the ‘Mix’ Behind the Numbers that Determines Margins
Vehicle Mix: A higher proportion of Y and 3, with lower proportions of S, X, and Cybertruck, generally yields neutral-to-average margins relative to overall volume.
Regional Mix: An increase in U.S. deliveries is favorable in terms of freight and pricing, although changes in subsidies add volatility.
Options & Software: The attachment rate of FSD subscription/sales is key to leveraging quarterly margins.
Price vs. Cost: The lag in passing on the decline in raw material costs (lithium, nickel, etc.) to production costs and the slope of the 4680 cell cost curve (yield, energy density, scrap recovery) mark the turning point.
IRA 45X Credit: The battery production tax credit acts as an invisible cushion against automotive margin pressure. However, monitoring is needed for policy change risks in 2025–2026.
5) The True Implication of ESS (Megapack·Powerwall) Growth: A Change in the Quality of Gross Profit
The +25% installation figure does not represent a mere shipment increase; it signifies the accumulation of recurring revenues based on 15–20-year long-term service contracts.
Grid service revenue (frequency regulation, peak reduction, capacity market bids) and software EMS licenses serve as the “second engine of profitability.”
As the utilization rates of the Latrop and Shanghai Megapack lines improve, economies of scale will drive down the unit cost rapidly.
ESS projects, thanks to the widening of power bill spreads even during inflationary periods, feature improved project IRRs, making them a hedge against global economic outlook risks.
A point most media overlook: ESS revenue recognition is spread out over time in accounting terms, so quarterly gross profit fluctuations are moderate while cumulative value builds up. This is the key to the multiple re-rating.
6) Checkpoint Calendar for October–November
Earnings Call: According to the announcement, it is scheduled around October 22 (final IR notice should be confirmed).
November 6 Special/Annual Shareholders Meeting: Issues around Elon Musk’s compensation plan reconfirmation can affect corporate governance premium and index demand.
FSD v14.x: After the initial stabilization of version 14.0, the management commented that version 14.2 is “a bit delayed.” This is directly linked to the conditions for removing the safety driver (or allowing teleoperation).
Robo-Taxi Pilot: Regulations are a patchwork by state and city. Simultaneous updates by CPUC and NHTSA guidelines and the design of insurance/liability frameworks are required.
Chinese Q4 Demand: There may be a front-loading effect before the year-end subsidy reduction.
Shanghai Megapack Ramp-Up: This is pivotal for ESS revenue visibility in 2025–2026.
7) The Three ‘Switches’ that Truly Activate Robo-Taxi Valuation
Safety Driver Removal Approval: Even on a city basis, achieving L4 status will transform revenue/cost structures.
Teleoperation Ratio: If the number of vehicles per supervisor (N) increases from 10 to 20 to 30, the per-unit cost will drop dramatically. This N value is the core variable in the investment idea.
Insurance & Liability Structure: In-house Tesla insurance and risk pricing based on safety scores will fundamentally lower the cost per mile.
Only when all three are met simultaneously does the “5x multiple” scenario become a reality. Key KPIs include the average distance between interventions, city-specific ride success rates, recovery rates, and the frequency of emergency remote interventions.
8) Five Overlooked Points This Quarter
Data Over Price: As FSD usage miles and intervention logs accumulate, model training accelerates exponentially, which directly improves overall software margins.
Grid Revenue Stack: With ESS, revenue is extracted from energy arbitrage plus frequency regulation and capacity market participation from the same asset, thereby defending project value even in a rising interest rate environment.
Platformization of the NACS Network: Opening up to other OEMs allows for additional revenue potential from charging earnings, memberships, advertisements, and payments.
4680 Cost Curve: With improvements in silicon, dry electrodes, and coating speed, once the per-kWh cost nears the target range, vehicle margins will see step-function re-rating.
Accounting Recognition Delay: Due to timing differences in revenue recognition for ESS and FSD, quarterly earnings may understate actual cash generation. Reading this discrepancy is the key to gaining alpha.
9) Macro Variables and Risks (Including Interest Rates and Inflation)
Risk of Prolonged High Interest Rates: Auto loan rates directly affect demand elasticity. Price cuts must be offset by increased software attachment rates.
Inflation Resurgence: Rising raw material and logistics costs for batteries could reintroduce margin pressure.
Competition in China: Local brands will continue aggressive price/spec strategies. A restructuring of the model lineup’s pricing structure may be needed.
Regulation & Safety: FSD-related accidents and recall issues could delay the robo-taxi timeline.
Corporate Governance: Risks associated with compensation plans and voting issues can increase valuation volatility.
10) Margin Bridge and Three Scenarios (Q3 → Q4)
Baseline: Approximately 480,000 deliveries, +25% ESS growth, automotive margins remain mix-neutral, and gradual increase in software attachment rates.
Upside: Increased U.S. delivery share + higher FSD subscription numbers + stable IRA credits → earnings surprise and multiple expansion.
Downside: Prolonged high interest rates + aggressive pricing competition in China + regulatory issues → promotional pricing and margin dilution.
11) Practical Checklist Until the Next Announcement
Confirm final delivery, production, and ESS installation numbers from the IR-approved documents.
Monitor vehicle and regional mix as well as inventory/lead times.
Track the deployment speed of FSD v14.x, intervention logs, and city-by-city expansion.
Review ESS orders, backlog, and the operational rates of the Latrop and Shanghai capacities.
Keep an eye on changes in U.S. and Chinese subsidies/tariffs, interest rate trends, and inflation.
Update monetization models and charging price maps for the NACS open platform.
12) Investment Interpretation of Today’s Numbers (For Information Purposes Only)
Delivery figures exceeding consensus are favorable for short-term stock momentum.
However, given that the recent rally has already priced in some gains, further re-rating requires confirmation via improvements in earnings, margins, FSD, and ESS quality.
In the mid-term, the multiple will hinge on whether the three prerequisites for robo-taxi—the removal of the safety driver, an increase in the teleoperation ratio, and insurance internalization—are met.
This article is not investment advice; it is recommended to concurrently review official documents and risk disclosures.
13) Bonus: The Essence of the ‘Hamburger’ Quip and Brand Tone
Mentions of ‘hamburger’ on social media reflect Tesla’s unique meme and humor code, serving as a light reminder of a shift in its core business trends.
Rather than over-interpreting its financial significance, it is more appropriate to view it as a marketing experiment aimed at boosting community engagement and brand participation.
< Summary >
- Q3 deliveries, based on the live stream, are around 480,000 units, exceeding consensus expectations.
- ESS installations saw a +25% year-over-year growth comment, marking a phase of improved profit quality.
- Short-term momentum remains intact, but further re-rating hinges on qualitative improvements in earnings margins, software, and ESS.
- Key events in October–November include earnings, the shareholders meeting (compensation plan), FSD v14.x, and Chinese Q4 demand.
- Robo-taxi valuation will fully activate only if the three conditions of safety driver removal, increased teleoperation ratio, and insurance internalization are met.
[Related Articles…]
Electric Vehicle Demand and the Transition in Interest Rates: Key Takeaways for the 2025 Global Economic Outlook
The Income Map of AI Trends Opened by Robo-Taxis
*Source: [ 허니잼의 테슬라와 일론 ]
– 테슬라, 2025 3분기 인도량 발표 생중계
● Tesla Blowout, NeoCloud MS Megadeal, Buffett OxyChem Buy – Wall Street Rewired
Tesla India’s Delivery Surprise, NeoCloud-Microsoft Long-term Contract, Berkshire’s OxyChem Acquisition: Interpreting October Wall Street Signals
My article contains three key points.
First, why Tesla’s Q3 deliveries surpassed consensus and what hidden risks lie in Q4.
Second, the true significance that the 5-year long-term contract between Navious’ “NeoCloud” and Microsoft signals for the AI infrastructure landscape and semiconductor supply chain.
Third, the ripple effects of Berkshire Hathaway’s $9.7 billion acquisition of OxyChem on cyclical chemical industries, inflation, and the U.S. equity style rotation.
1) Market Flow and Macroeconomic Background as of 2025-10-02
The Nasdaq rose by around 0.6%, the S&P 500 showed slight strength, and the Dow and Russell also moved higher.
With expectations that the U.S. government shutdown is “temporary,” bets on rate cuts have been reignited by the AI rally.
The futures market maintained a positive stance from the market open, with semiconductors and AI momentum driving the indices upward.
This week, though key indicators are absent due to the shutdown impact, the market is pricing in a shift in the Fed’s monetary policy and an expansion of the AI cycle.
The core keywords are U.S. equities, interest rates, AI, semiconductors, and inflation.
2) Tesla Q3 Deliveries: Points More Important Than the Numbers
Actual deliveries reached 497,000 units, surprising against the FactSet consensus of 447,600 vehicles.
This represents a 7.4% increase compared to the same period last year, with a recovery in European sales serving as a supporting trend.
The root cause of this surprise is largely the effect of accelerated demand in Q3 ahead of the reduction in U.S. EV tax incentives.
Therefore, Q4 may face low visibility due to the disappearance of base effects and deferred demand.
There are three key points that are even more important than the numbers.
First, the margin mix.
Automotive margins vary according to product mix, geographic mix, and the intensity of incentives.
If price cuts continue, an increase in delivery volumes may not directly translate into profits.
Second, whether the narrative premium continues.
Wall Street views Tesla as a narrative stock that bets on future growth potential rather than just vehicle sales.
Visibility into non-automotive businesses such as Optimus (humanoid robots), energy storage, FSD/robotaxi, and the integration of Grok AI supports its valuation.
Third, cash flow and investment in AI infrastructure.
If investments increase in computational resources for inference, licenses, and data pipelines to enhance AI software performance, short-term FCF may be volatile.
While the recovery in Europe is positive, the ongoing decline in North American EV market share and intensifying competition remain key checkpoints.
Thus, in the Q3 performance commentary, guidance on margins, the scale of deferred FSD revenue recognition, and trends in energy business profitability are expected to be crucial.
3) The Governance Signal Told by Musk’s Surge in Net Worth
According to reports, Musk’s net worth is estimated to be around $500 billion, with significant stakes of 12% in Tesla, 42% in SpaceX, and 53% in xAI.
The board’s re-discussion of a substantial compensation package could further strengthen his control.
From an investor’s perspective, there are two important points.
If the compensation package is equity-based, it may create dilution issues while simultaneously reinforcing the “Musk=Tesla” alignment, thereby enhancing the narrative premium.
It is also noteworthy that there is historical precedent where, after Musk’s time allocation reverted to focusing on Tesla, the stock price was re-rated.
4) Navious-Microsoft 5-Year Long-Term Contract: The Invisible Power Shift in AI Infrastructure
According to reports, Navious Group signed a 5-year long-term contract with Microsoft worth up to $19.4 billion, with an option to supply around 100,000 GB300 GPUs being mentioned.
The key is the rise of “NeoCloud.”
Companies such as Navious, CoreWeave, Enscale, and Lambda are expanding AI-dedicated clouds composed solely of the latest GPUs, maximizing efficiency in training and inference compared to traditional clouds.
This structure carries three implications.
First, it is a bypass of semiconductor supply constraints.
Due to the insufficiency of direct supply of Nvidia’s high-end GPUs, big tech companies like Microsoft secure capacity by “leasing” integrated capacity from NeoCloud on long-term contracts.
Second, power and cooling present bottlenecks.
What is in even shorter supply than GPUs is the power inflow to data centers, along with transformers, switchgear, and cooling infrastructure.
PPA agreements, grid expansion lead times, and the investment cost per MW in AI data centers become the true turning point for profitability.
Third, the redefinition of the cost curve.
NeoCloud, with multi-tenancy and optimization of the latest stack, reduces costs compared to traditional clouds, thereby accelerating the decline in AI unit costs.
This contract sends a “hard lock” signal of long-term demand to the entire semiconductor value chain including Nvidia, TSMC, HBM memory, high-bandwidth switching, and liquid cooling components.
Expectations of lower interest rates reduce leverage costs for this massive capital expenditure, further accelerating investment.
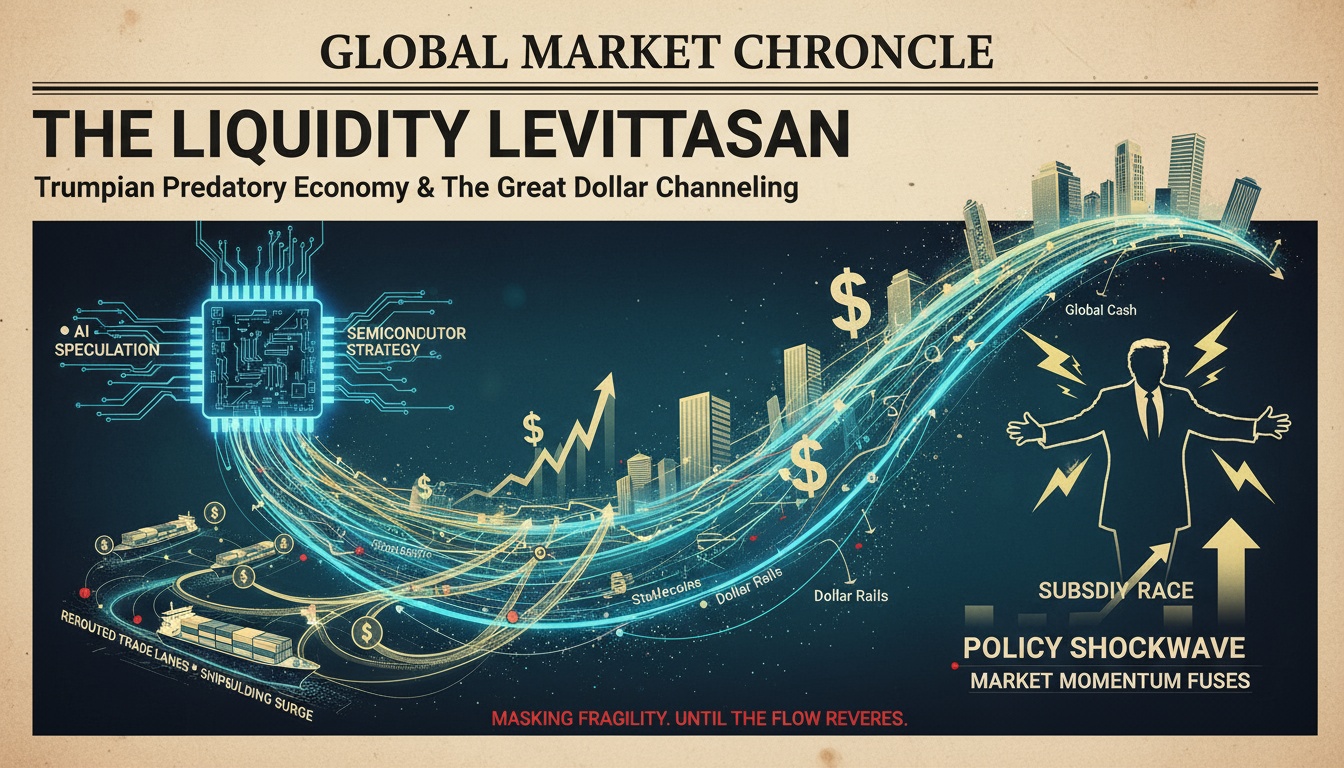
In short, the AI infrastructure cycle is evolving into a “supply-constrained supercycle” where power, delivery, and capital costs determine the upper end rather than demand.
5) Berkshire Hathaway’s $9.7 Billion Acquisition of OxyChem: The Crossroads of the Chemical Cycle and Inflation
According to reports, Berkshire acquired Occidental’s chemical subsidiary OxyChem for $9.7 billion.
OxyChem’s core lies in the PVC chain derived from chlorine, caustic soda, and ethylene, and it is closely linked to U.S. housing and infrastructure cycles.
This deal sends three signals.
First, it is a structural bet on the reshoring theme in U.S. manufacturing and construction.
The implementation of infrastructure legislation, power grid upgrades, and a boom in data center construction could support long-term PVC demand.
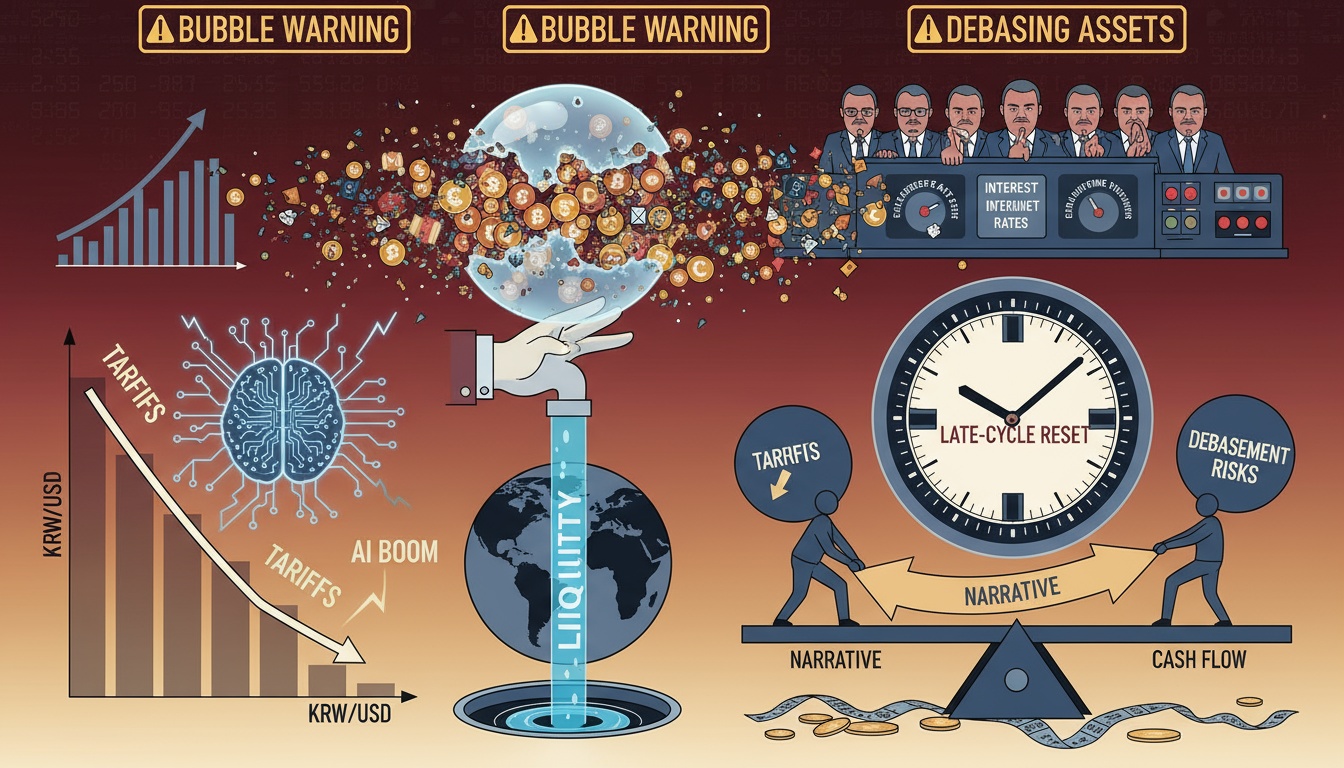
Second, the chemical industry acts as a tangible gauge for “late-cycle inflation.”
Energy and power costs, freight, and wages greatly impact price pass-through, and managing spreads becomes crucial during inflationary phases.
Third, from Buffett’s cash flow-centric perspective, it strengthens a business portfolio with robust cash generation even in an economic downturn.
In terms of style rotation, it suggests that there is room for a simultaneous re-rating of high-growth AI and cyclical value stocks.
6) Sector Snapshot and Trading Points
Semiconductors & AI
Nvidia, Broadcom, and AMD are leading the market.
The strength of the second and third tiers of the supply chain in areas such as HBM, packaging, switching, liquid cooling, and power equipment is key.
The news flow from the long-term contract with NeoCloud acts as an immediate catalyst for short-term momentum.
Automotive & Tesla
After the delivery surprise, key priorities are margin guidance and clarity on Q4 demand.
Re-rating hinges on the application of Optimus Pilot, FSD revenue recognition rate, and growth rate of the energy business.
Communications & Streaming
Short-term volatility has increased due to a Netflix criticism tweet from Musk’s X.
Rather than subscriber growth, ARPU and the mix of advertising are critical for stock direction.
Consumer Goods & Nike
With the “Win-Now” strategy, focus is on bestsellers, improved inventory efficiency, and recovery in wholesale channels, leading to re-rating.
It is necessary to check quarterly whether digital channel conversion rates and gross margin improvements continue.
Biotech & Healthcare
Strong performance was seen in the previous day; as shutdown variables ease, the defensive nature may combine with pipeline news.
7) Timeline: This Week → Checklist for October to December
This Week
Due to the shutdown, employment reports are delayed, and the market impact of secondary indicators such as factory orders is limited.
However, expectations of rate cuts and AI news flows will drive prices.
October
The earnings season for large tech stocks will kick off in earnest, with a focus on AI capital expenditure guidance and comments on power and delivery.
CPI and PPI will be events to reconfirm the extent of slowdown in service inflation and the contribution of rents.
November–December
FOMC communications and a re-guide on the rate path will directly influence the valuations of risky assets.
By year-end, news on the commencement of AI data center construction and power contracts is expected to reignite semiconductor supply expectations.
8) Portfolio Roadmap: 1 Week · 1 Month · 1 Quarter
1 Week
For Tesla earnings commentary, check the emphasis on margins, FSD recognition, and mentions of energy business.
The news about the NeoCloud–big tech long-term contract is seen as an immediate catalyst for semiconductor supply chain trading.
1 Month
Diversify positions across stocks benefiting from the AI infrastructure cash cycle, power and cooling equipment, and HBM and packaging capacity expansions.
For consumer goods, it is recommended to select and focus on tickers with confirmed improved inventory efficiency and channel mix as wholesale channels recover.
1 Quarter
Once the interest rate bottom is confirmed, expansion in multiples for duration-risk assets could resume.
At the same time, consider a basket approach to industrials and chemicals that have pricing power to pass on costs, as a hedge against inflation re-acceleration risks.
Risks and Opportunities: Points Others Overlook
The true ceiling of the AI cycle is constrained by the power infrastructure bottleneck, where lead times for grids and transformers are becoming the real price determinant rather than semiconductors.
While Tesla’s narrative premium remains, if Q4 sees a demand gap and increased dependency on incentives, volatility in margins and cash flows may widen.
Berkshire’s acquisition of OxyChem could be a signal of a recovery in PVC and chlorine chain spreads, which might retroactively pose a “material inflation” risk for construction and data center investments.
As bets on lower interest rates intensify, market sensitivity to surprise inflation data increases.
Therefore, a “barbell strategy” that includes both high-beta AI stocks and defensive, cash-generating sectors is valid.
Today’s Checklist
Check Tesla’s Q4 delivery guidance and updates on the range of automotive margins.
Verify whether the MS–NeoCloud partnership includes additional volume options and clauses regarding upfront payments/minimum usage.
Monitor news on capacity expansion in HBM and packaging as well as order tracking for power and cooling.
For consumer goods, review Nike’s recovery in wholesale channels and guidance on gross margins.
Reconfirm schedules for major price indicators and any developments surrounding the shutdown.
< Summary >
Tesla’s Q3 delivery surprise was largely driven by a pull-forward effect ahead of the reduction in tax incentives, making Q4’s margins and demand visibility key.
The Navious-Microsoft 5-year long-term contract symbolizes the rise of NeoCloud and a supply-demand dynamic in the AI supercycle dominated by power and delivery constraints.
Berkshire’s acquisition of OxyChem represents a bet on reshoring and the boom in construction and data centers, signaling inflation and style rotation trends.
Opportunities lie in high-quality semiconductor and AI stocks, power and cooling infrastructure, and HBM–packaging, while consumer goods should focus on stocks with improved inventory efficiency and channel mix.
As bets on lower interest rates intensify, a barbell strategy combining AI infrastructure and value sectors with robust cash flow is prudent.
[관련글…]
- What Tesla’s Delivery Surprise Means
- How the NeoCloud Long-term Contract Is Changing the AI Infrastructure Landscape
*Source: [ Maeil Business Newspaper ]
– 테슬라, 3분기 인도대수 예상치 상회ㅣ네비우스, MS 장기계약 5% 상승ㅣ버크셔해서웨이, 옥시켐 97억달러에 인수ㅣ홍키자의 매일뉴욕

Leave a Reply to Lola Goodman Cancel reply