● Crash,Shock,Surge
Why the KOSPI Breakout Felt Like a Worst-Case Market: FOMC Shock, Samsung Electronics and SK Hynix Dominance, and the Core Issue Behind Lagging Stocks
Today’s headline index performance appeared strong, but investor experience was largely negative. The index rose while a broad set of portfolios declined, reflecting a narrow, mega-cap-led market. This report summarizes: (i) how the latest FOMC signaling transmitted into Korean equities, (ii) why Samsung Electronics and SK Hynix disproportionately supported the index, (iii) why Apple’s pricing commentary was interpreted as a memory upcycle signal, and (iv) why internal market conditions can deteriorate even as the index advances.
1. One-line takeaway: The index was strong; market breadth was weak
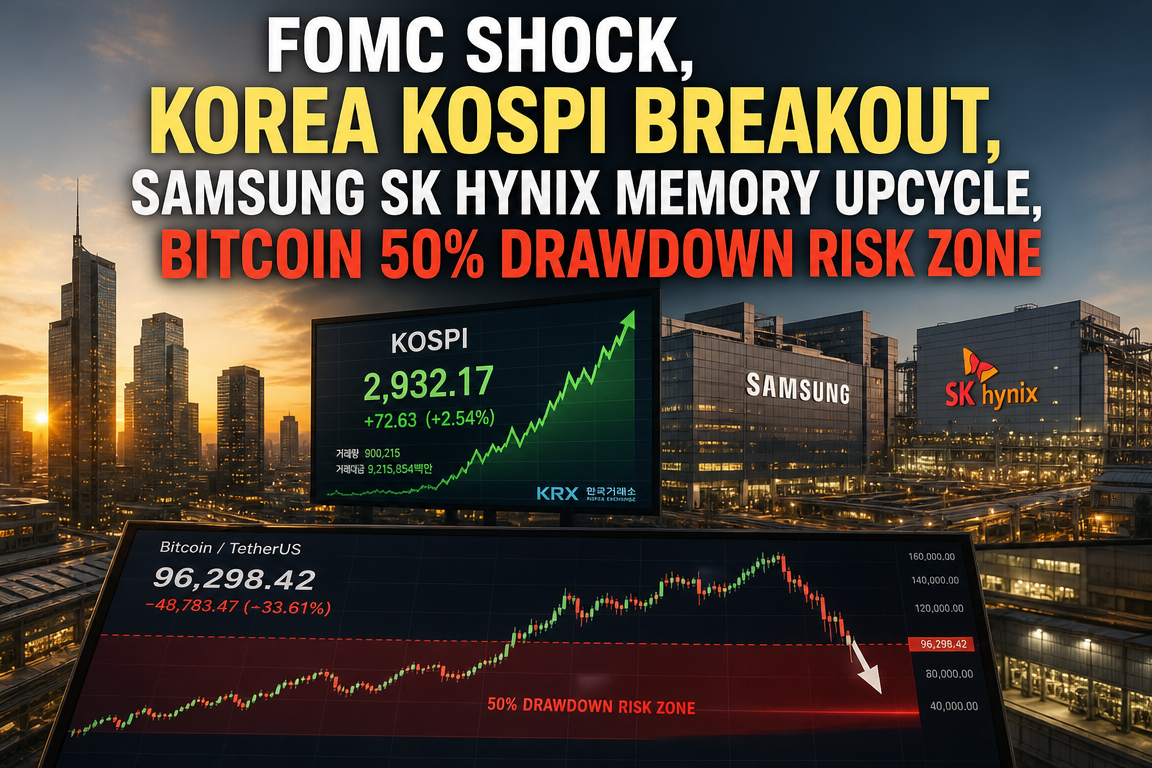
The KOSPI printed 9,000, but most constituents declined. Gains were concentrated in a small number of large-cap semiconductors that mechanically lifted the index.
This divergence between index levels and breadth tends to increase perceived risk: it can mask internal fragility, raise volatility sensitivity, and make security selection materially more difficult.
2. The FOMC shock: Why Korean equities reacted
The market focus from the latest FOMC communication was the renewed possibility of additional rate hikes. Even absent immediate action, tighter-policy risk typically pressures global risk assets.
Higher rates are generally negative for equities, particularly growth and technology stocks where valuation depends heavily on discounted future earnings. As U.S. tech weakened, the risk-off impulse transmitted to Korean markets.
Korean equities are highly sensitive to U.S. monetary policy via USD strength, foreign flows, higher sovereign yields, and declining risk appetite. As a result, the FOMC message functioned as a global macro reset for Korea-focused positioning.
3. Why the KOSPI rose: Index concentration in Samsung Electronics and SK Hynix
The primary stabilizer was Samsung Electronics and SK Hynix. Given their large index weights, strong performance in these two names can lift the KOSPI even when most stocks fall.
Accordingly, index gains should not be interpreted as broad market strength in a session characterized by semiconductor mega-cap outperformance and widespread declines elsewhere.
This pattern is consistent with capital concentrating in the most liquid, highest-visibility earnings streams during periods of elevated uncertainty.
4. First driver of semiconductor strength: Apple signaling tolerance for higher memory costs
A key catalyst was Apple-related commentary interpreted as: memory costs are sufficiently high that final product prices may rise.
Given Apple’s scale as an end-demand anchor in consumer electronics, such messaging was read as improved supplier bargaining power. The market interpreted this as evidence that memory pricing power is strengthening rather than reverting.
In memory semiconductors, pricing inflections can rapidly shift earnings expectations and valuation multiples. The Apple signal was therefore treated as supportive of an upward phase in the memory cycle.
5. Second driver of SK Hynix outperformance: HBM4 12-high sample shipments
SK Hynix reacted more strongly than Samsung Electronics on reports related to HBM4 12-high sample supply to customers. This was interpreted as a meaningful milestone beyond development progress, indicating movement into customer validation.
HBM is a critical component for AI servers, data centers, and high-performance accelerators. Competitive positioning in HBM increasingly functions as a proxy for relevance to AI infrastructure capex.
The market read the update as reinforcing SK Hynix’s lead into the next HBM generation, outweighing near-term macro headwinds in session-level price action.
6. Event-style summary: What occurred in today’s market
U.S.-driven factors
- The FOMC kept the door open to additional rate hikes, weakening global risk appetite.
- U.S. tech faced pressure, with spillover into Korean equities.
- Rate-sensitive growth and small-/mid-cap segments saw heavier selling.
Korea market dynamics
- The KOSPI exceeded 9,000, but decliners outnumbered advancers by a wide margin.
- Most of the index’s upside was attributable to Samsung Electronics and SK Hynix.
- The KOSDAQ and single-name performance were materially weaker than the headline index.
Semiconductor-specific catalysts
- Apple’s memory-cost commentary was interpreted as strengthening pricing leverage for memory suppliers.
- SK Hynix’s HBM4 12-high sampling news supported AI-memory competitiveness expectations.
- Price action suggested the market prioritized memory earnings visibility over near-term rate concerns.
Underperforming segments
- Most non-semiconductor sectors were weak.
- Portfolio-level drawdowns likely increased for investors not concentrated in index heavyweights.
- Interpreting market conditions solely from index performance risked misallocation.
7. Why this can be higher risk: Index optics versus internal deterioration
An index breakout is often interpreted as a healthy bull market. However, rising concentration can imply weaker internal stability.
First, leadership is narrow. If one or two mega-caps reverse, index downside can accelerate.
Second, opportunity breadth contracts. Weak participation can drive late-cycle chasing into the few outperformers.
Third, overall market quality deteriorates. Sustainable advances typically rotate across sectors; persistent single-sector dominance raises durability questions.
8. Under-discussed but material point: Capital concentration as a regime feature
The move was not only a one-day semiconductor rally; it reflected capital reallocating toward large-cap AI-linked earnings visibility under uncertainty. This is less a theme trade and more an observed preference for liquidity, scale, and near-term cash-flow credibility.
Memory pricing is a key variable. If large end customers signal willingness to pass through component inflation, it implies a higher degree of supplier power within the value chain, with potential implications for earnings momentum, exports, trade balance sensitivity, and FX linkages.
HBM4 developments are central because semiconductors are increasingly tied to AI infrastructure competitiveness rather than legacy consumer cycles. Mega-cap memory performance is therefore functioning as a barometer for Korea’s direct exposure to AI capex.
9. Key items to monitor
1) Post-FOMC rate path
Assess whether the rate-hike signal translates into action or remains guidance. Track U.S. Treasury yields, USD moves, and foreign flows into Korean equities.
2) Persistence of memory pricing
Determine whether Apple-related signaling is transient or consistent with a sustained memory price uptrend. Inventory and contract pricing remain critical.
3) HBM supply competition
Monitor HBM4 progress, 12-high stacking, customer qualification, and timing to volume production. These are core earnings drivers for AI-memory suppliers.
4) Market breadth and diffusion
The primary question is whether semiconductor strength broadens into other sectors. Index-only rallies without participation typically face durability constraints.
10. Investor interpretation
This market is not characterized by “index up = portfolio up.” Positioning should reflect sector dispersion and concentrated flows.
Semiconductor mega-caps remain supported by earnings visibility, cycle improvement signals, AI-driven demand, and supply-chain positioning. However, broad-market conditions are not yet consistent with a balanced advance.
A more reliable read requires monitoring KOSPI versus KOSDAQ behavior alongside semiconductors, AI-linked demand, rates, and USD dynamics.
11. Core message
The session displayed strong index optics with pronounced internal imbalance. Samsung Electronics and SK Hynix lifted the KOSPI while most stocks declined.
Apple’s pricing signal supported a more constructive view on memory pricing power, and SK Hynix’s HBM4 sampling update strengthened AI-memory leadership expectations.
Overall, the move highlighted capital concentration into AI-linked semiconductor bellwethers amid elevated global macro uncertainty.
< Summary >
- FOMC communication increased perceived odds of further tightening, pressuring global risk assets.
- The KOSPI’s 9,000 break was largely driven by Samsung Electronics and SK Hynix.
- Apple-related commentary was interpreted as evidence of stronger memory supplier pricing power.
- SK Hynix HBM4 12-high sampling supported AI-memory competitiveness expectations.
- Despite index gains, broad participation was weak and investor experience likely negative.
- Key monitoring points: rates, memory pricing persistence, HBM competitive dynamics, and breadth expansion.
[Related Articles…]
- FOMC Signals and Global Risk Asset Positioning
- HBM Roadmap: Supply, Qualification, and AI Infrastructure Demand
*Source: [ 내일은 투자왕 – 김단테 ]
– 코스피 9000 찍었지만 주식시장이 개판인 이유
● Bitcoin Crash, Risk, Rotation, Recovery
Is a 50% Bitcoin Drawdown a Genuine Risk Zone? Key Takeaways in a News-Style Brief
This report goes beyond the observation that “Bitcoin has fallen sharply.” It outlines why the current correction differs from prior crash regimes; why institutional capital has rotated from Bitcoin into AI semiconductors; how to interpret the Coinbase premium, ETF flows, and on-chain indicators; and why Bitcoin warrants renewed consideration within retirement planning and strategic asset allocation.
A critical point frequently missed in mainstream coverage is that downside magnitude matters less than (i) the speed of confidence restoration and (ii) the time lag between regulatory institutionalization and realized demand.
1. Current Snapshot: Why Markets Perceive This as a “High-Risk” Zone
A ~50% decline from the peak is significant in headline terms. For newer participants, the move challenges the assumption that institutional participation would structurally reduce drawdown depth.
Concurrently, strong performance in AI semiconductors and mega-cap technology has increased relative underperformance pressure for crypto allocations, amplifying risk aversion beyond absolute losses.
2. Primary Drivers of the Drawdown (4 Key Factors)
2-1. Weaker Confidence Within Crypto Markets
The correction reflects confidence erosion inside the ecosystem. While not equivalent to a systemic collapse, DeFi exploits and protocol-specific incidents can be interpreted by institutions as unresolved operational and security risk.
A slow recovery in TVL signals subdued participation and elevated risk premia across digital assets, not only in altcoins.
2-2. Institutionalization Expectations vs. Slow Implementation
Markets priced in progress on stablecoin legislation, market-structure clarity, and strategic Bitcoin reserve discussions. However, the path from legislative debate to passage, compliant industry execution, and sustained institutional inflows is typically lengthy.
The gap between expectations and implementation speed has contributed to repricing.
2-3. Liquidity Rotated Toward AI Semiconductors, Not Bitcoin
Bitcoin remains highly sensitive to liquidity conditions. In this cycle, even where liquidity expectations improved, incremental capital has not flowed directly into Bitcoin.
AI semiconductors, data centers, cloud infrastructure, and productivity-related equities have delivered stronger near-term earnings narratives and growth visibility. Bitcoin’s long-duration narrative remains intact, but its near-term relative appeal can weaken during risk-off and higher-rate regimes.
This is better framed as global asset-allocation rotation toward AI rather than a crypto-only downtrend.
2-4. Geopolitics, Rates, and Inflation Trajectory Deteriorated vs. Baseline
The market had anticipated easing and broader liquidity expansion around 2026. Geopolitical risk, inflation uncertainty, and higher sovereign yields disrupted that path.
Despite its long-term inflation-hedge framing, Bitcoin still trades as a risk asset in the short term and is sensitive to rates, the dollar, and liquidity conditions.
3. Is This “Systemic” Risk? Key Differences vs. Prior Cycles
A 30–50% correction has been common historically within Bitcoin uptrends. Notably, this decline occurred without a crisis on the scale of major prior systemic failures, suggesting a regime characterized more by capital rotation and sentiment adjustment than structural collapse.
Additionally, ownership has been shifting gradually toward institutional participation, implying a more complex cycle of accumulation and reallocation rather than purely retail-driven boom-bust dynamics.
4. Five Indicators to Monitor
4-1. Coinbase Premium
Often used as a proxy for US-based demand, including institutional activity. A weak premium suggests limited aggressive US spot demand, implying that the drawdown may reflect softening real demand rather than fear alone.
4-2. Spot Bitcoin ETF Flows
Spot ETFs are now a primary regulated demand channel. Persistent inflows can underpin spot demand and reinforce downside support; sustained outflows or a sharp slowdown typically indicates de-risking by institutions.
4-3. On-Chain Indicators
Metrics such as realized loss supply, long-term holder behavior, and exchange inflows help distinguish capitulation from re-accumulation. The current cycle may reflect mixed “rotation plus accumulation” rather than a single cascading unwind.
4-4. Stablecoin Supply
Stablecoin supply is closely linked to latent crypto liquidity. Expansion can serve as a forward indicator of improving risk appetite and potential recovery in digital asset activity.
4-5. US Treasury Yields and USD Trends
Bitcoin is increasingly driven by macro variables. Elevated yields can reduce Bitcoin’s relative attractiveness versus earnings-bearing equities, particularly in an AI-led equity regime.
5. Forward Outlook: End of the Downcycle or Early Stage?
A definitive call is not warranted; scenario framing is more appropriate.
5-1. Bearish Scenario
If market-structure clarity continues to stall, DeFi trust recovery remains slow, AI-driven capital concentration persists, and yields stay elevated, Bitcoin could face additional downside or an extended basing period. The more likely expression would be a prolonged range-bound adjustment rather than a linear decline.
5-2. Neutral Scenario
If ETF demand does not structurally reverse, stablecoin supply remains stable, and long-term holder metrics remain resilient, the current zone may represent fear alongside re-accumulation. Upside may require time and a subsequent liquidity regime shift.
5-3. Bullish Re-Acceleration Scenario
If policy uncertainty moderates, institutional demand improves, and AI capital concentration partially normalizes into broader diversification, Bitcoin’s setup could improve. A simultaneous recovery in ETF inflows and the Coinbase premium would be a key confirmation signal that the drawdown is a consolidation within a longer-term uptrend.
6. Bitcoin as a Retirement-Planning Asset: Framing and Constraints
The relevant question is portfolio construction, not maximal allocation. The underlying thesis is that long-horizon purchasing-power preservation is difficult with cash and deposits alone under persistent inflation.
Bitcoin can be positioned as a scarce digital asset with increasing institutional access. However, volatility remains high; implementation is generally more appropriate as a capped allocation within a diversified portfolio that includes equities, fixed income, and cash-flowing assets.
7. What Individual Investors Should Consider From an Asset-Allocation Perspective
7-1. Deposits Alone May Not Preserve Real Wealth
Cumulative inflation can erode purchasing power over time, even when nominal principal is stable.
7-2. Treat Bitcoin as a Strategic Allocation, Not a Short-Term Trading Instrument
Price-chasing increases behavioral risk. A rules-based approach (position sizing, periodic rebalancing, disciplined entry) is typically more robust than reactive trading.
7-3. Avoid Treating AI and Bitcoin as Pure Substitutes
Both can be viewed as capital magnets tied to long-duration themes. AI is linked to productivity and earnings, while Bitcoin is linked to scarcity and monetary-network adoption. A diversified framework that recognizes macro regime shifts is generally more resilient than single-theme concentration.
8. News-Style Key Summary
- A ~50% Bitcoin decline is significant but not unprecedented relative to historical cycles.
- The drawdown appears more driven by confidence erosion, delayed institutionalization, and liquidity rotation into AI semiconductors than by a single systemic failure.
- Coinbase premium, spot Bitcoin ETF flows, on-chain metrics, and stablecoin supply are core indicators for assessing stabilization and potential recovery.
- Elevated yields can be a headwind versus earnings-bearing risk assets.
- If institutional access and accumulation trends remain intact, the current correction may also be consistent with re-accumulation within a longer-term structural trend.
- In retirement planning, Bitcoin is more appropriately considered as a limited allocation within a diversified portfolio.
9. Most Material Point Often Underweighted in Media Coverage
The key issue is not drawdown size, but the speed of confidence restoration and the lag between regulatory progress and realized demand. In this cycle, macro conditions, policy trajectory, global liquidity, AI-led capital allocation, stablecoin regulation, and institutional portfolio constraints are increasingly determinative.
Price volatility may persist; however, if institutionalization and regulated access continue to advance, the long-term structural thesis may remain viable.
10. Interpretation: A High-Risk Zone That Requires Differentiation, Not Extremes
Near-term conditions remain challenging: liquidity preference has favored AI-linked equities, policy execution has lagged expectations, and confidence is not fully restored. At the same time, spot ETF access, regulatory discussion, institutional ownership trends, and broader acceptance of digital assets are more advanced than in prior cycles.
The practical focus is risk management and portfolio rules under macro uncertainty rather than binary positioning.
< Summary >
A ~50% Bitcoin drawdown is psychologically and tactically significant, but not necessarily abnormal versus prior cycles. Key drivers include weakened internal confidence, delayed institutionalization, liquidity rotation into AI semiconductors, and a less favorable rates/inflation trajectory.
Forward assessment should incorporate the Coinbase premium, spot ETF flows, on-chain indicators, stablecoin supply, and US rates. Volatility may persist; however, if institutionalization and regulated demand channels remain intact, the correction may also align with a re-accumulation phase within a longer-term trend.
In retirement and strategic allocation frameworks, Bitcoin is generally better approached as a measured portfolio sleeve rather than a primary holding.
[Related Articles…]
- Bitcoin Cycle Outlook and Digital Asset Market Positioning
- AI Semiconductors and Global Liquidity: Capital Rotation Signals
*Source: [ 경제 읽어주는 남자(김광석TV) ]
– 비트코인 50% 하락, 지금 정말 위험한 구간일까? | 경읽남과 토론합시다 | 이장우x박종한 [1편]