● KOSPI, KOSDAQ, Sidecar, Crash, Semiconductors, Oil, Leverage
Kospi and Kosdaq Trigger Back-to-Back Sidecars: A Multi-Factor Event Involving Semiconductors, Oil, and Leverage
This Kospi decline should not be reduced to a simple “U.S. market weakness dragged Korea lower” explanation.
The key drivers are threefold.
First, simultaneous declines in U.S. equities and semiconductor stocks undermined sentiment toward SK Hynix and Samsung Electronics, the core of the Korean market.
Second, heightened Middle East risk pushed international oil prices higher, reigniting inflation concerns and pressure on U.S. interest rates.
Third, reports that Apple tested CXMT DRAM for the Chinese market intensified fears of a stronger challenge from Chinese memory-chip makers.
In addition, leveraged ETFs, margin financing, foreign futures selling, and retail liquidation combined to trigger consecutive sidecar events in both the Kospi and Kosdaq.
1. What a sidecar is
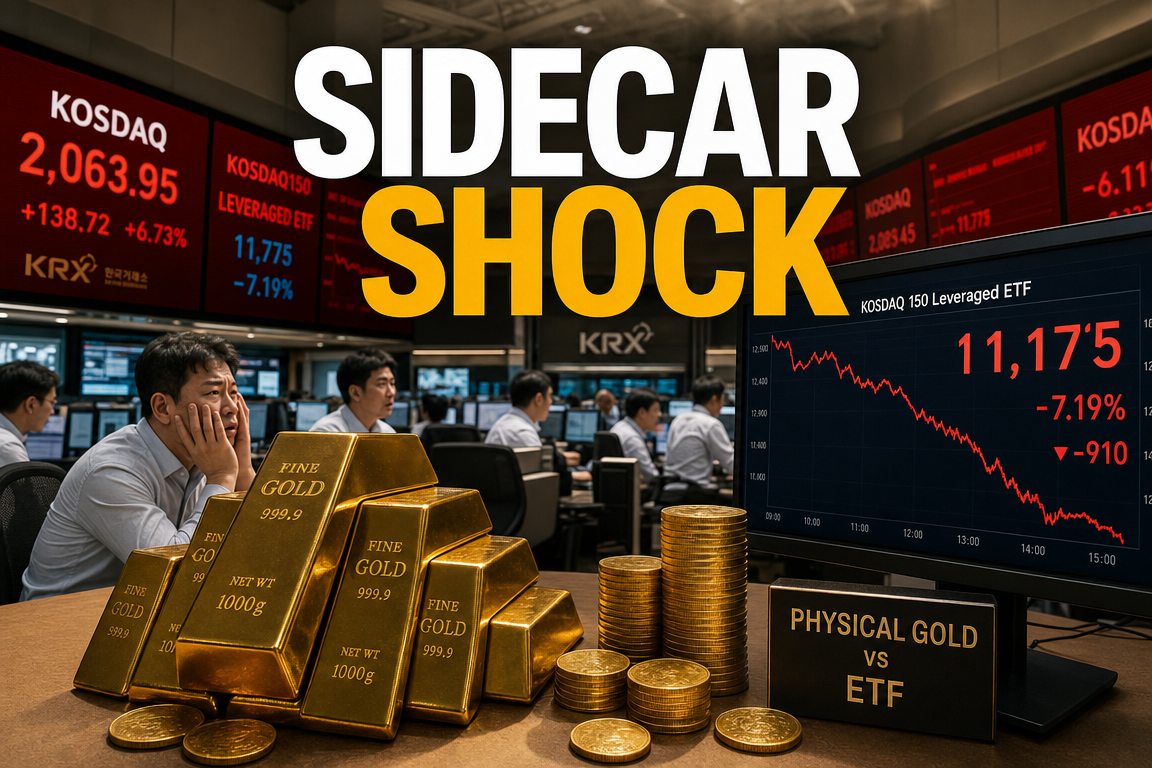
A sidecar is a mechanism that temporarily halts program trading when the market moves too sharply.
In practical terms, it is a safeguard that pauses trading for five minutes when the market becomes excessively volatile or panic-driven.
It is triggered when the Kospi 200 futures or Kosdaq 150 futures move beyond a preset threshold.
Sidecar activation in a sharp selloff indicates concentrated one-directional positioning by market participants.
Back-to-back sidecar triggers in the Kospi and Kosdaq suggest that the decline was driven not only by price action, but also by simultaneous stress in liquidity, sentiment, and macro conditions.
2. First driver: U.S. equity weakness and semiconductor declines
The starting point of the decline was the U.S. market.
Overnight losses in the U.S., especially in semiconductor stocks that are highly relevant to Korea, weighed on sentiment.
When Nvidia, AMD, and Micron weaken, pressure quickly spreads in Korea to SK Hynix, Samsung Electronics, Hanmi Semiconductor, and Isu Petasys.
Semiconductors carry substantial weight in the Korean market.
As a result, declines in U.S. chip stocks often translate into broad pressure on the Kospi.
The impact was amplified because AI semiconductors, HBM, and the expected recovery in memory demand had been major drivers of the recent rally.
Markets tend to shift from “AI demand is endless” to “prices have moved too far” very quickly during corrections.
That is a defining feature of growth-led markets.
3. Second driver: Middle East risk and higher crude oil prices
The second factor was crude oil.
Rising geopolitical tension in the Middle East raises concerns about supply disruption.
Supply risk tends to lift international oil prices.
Higher oil prices initially feed inflation pressure.
That, in turn, leads markets to scale back expectations for U.S. rate cuts.
This matters because markets had already priced in a significant probability of lower U.S. rates.
If oil-driven inflation concerns return, the timing of policy easing may be delayed.
Higher-for-longer rates remain a headwind for growth and technology stocks.
Because Kosdaq is heavily weighted toward biotech, secondary batteries, robotics, AI, and platform names, it is particularly sensitive to rate expectations.
When rates remain elevated, the present value of future earnings declines, which compresses growth-stock valuations.
4. Third driver: The Apple-CXMT report affected SK Hynix sentiment
Another market-sensitive headline was the report involving Apple and CXMT.
Reports suggested that Apple tested DRAM from Chinese memory supplier CXMT for products sold in China.
This should be viewed as a test phase rather than a confirmed large-scale supply arrangement.
However, market conditions were already fragile.
In a weak sentiment environment, even tentative headlines can be magnified.
SK Hynix and Samsung Electronics are central to the global memory market.
The possibility of a Chinese supplier entering Apple’s supply chain was enough to intensify concerns about rising competition in memory semiconductors.
The immediate issue was not earnings deterioration, but sentiment damage.
Equity markets discount future expectations before they reflect current performance.
The CXMT report was interpreted through the lens of “Chinese memory competition,” adding pressure across the semiconductor sector.
5. Why the Kosdaq was hit harder than the Kospi
The Kosdaq is more sensitive than the Kospi to rates and liquidity.
The Kospi is anchored by large-cap names such as Samsung Electronics, SK Hynix, Hyundai Motor, Kia, financials, and dividend stocks.
The Kosdaq, by contrast, is dominated by growth-oriented sectors such as biotech, battery materials, AI software, robotics, entertainment, and gaming.
Growth stocks tend to receive higher valuations when rates are low.
When U.S. rate pressure rises, the present value of future earnings falls and stock prices can decline sharply.
The Kosdaq also has a higher share of retail participation.
That makes it more vulnerable to clustered selling in down markets.
When margin financing and leveraged ETF flows are added, volatility increases further.
6. Why leveraged ETFs magnified the decline
Many reports stop at the explanation that “sentiment worsened.”
More importantly, leveraged ETFs and derivatives positioning intensified the move.
Leveraged ETFs are designed to amplify index gains and losses.
When the market moves sharply in one direction, rebalancing can create additional buying or selling pressure.
In a selloff, leveraged ETFs, inverse ETFs, futures positions, and program trading can push index moves beyond what fundamentals alone would justify.
In other words, this decline cannot be explained solely by corporate earnings.
It was a macro shock amplified by mechanical market flows.
This is the type of market in which investors often ask why the decline became so severe.
The answer is a self-reinforcing liquidity and positioning effect.
7. Foreign flows and the exchange rate also matter
Foreign investor behavior is critical during sharp Kospi declines.
Foreign investors trade heavily in Korean large-cap semiconductor names.
When the U.S. market weakens and the dollar strengthens, foreign investors often reduce exposure to emerging markets such as Korea.
A stronger won-dollar exchange rate increases currency risk for foreign investors.
As a result, Kospi weakness, won depreciation, and foreign selling often occur together.
This should be seen as part of global capital reallocation rather than a purely domestic event.
U.S. rates, dollar strength, oil prices, and Middle East risk can combine to expose structural vulnerabilities in Korea’s market.
8. Markets fear combinations of adverse factors
Markets can usually absorb a single negative catalyst.
For example, the U.S. market may fall without broad damage if oil is stable.
Likewise, higher oil prices may be manageable if semiconductor fundamentals remain strong.
But this time, multiple adverse factors arrived together.
- U.S. equity decline
- Weakness in U.S. semiconductor stocks
- Escalating Middle East risk
- Higher international oil prices
- Lower expectations for U.S. rate cuts
- Apple-CXMT DRAM test reports
- Weaker sentiment toward SK Hynix and other semiconductor names
- Pressure from leveraged ETFs and program trading
- Retail liquidation in growth stocks on the Kosdaq
When several negative factors align, markets often move from assessing each headline to a simple “reduce risk first” response.
That can push prices well below levels justified by fundamentals.
9. The key point often missed: this was more of a discount-rate shock than an earnings shock
The core of this selloff is better understood as a discount-rate shock than an earnings shock.
The discount rate is the rate used to convert future earnings into present value.
When rates rise or risk increases, the discount rate rises.
When that happens, stocks that depend heavily on future growth see the largest valuation compression.
This is why AI semiconductors, secondary batteries, biotech, robotics, and platform names were hit more severely.
The market is not necessarily assuming that companies will suddenly stop earning profits.
Rather, it is recalculating whether current valuations have become too demanding.
Understanding that distinction helps avoid panic-driven decisions.
10. Is SK Hynix and the semiconductor sector finished?
That conclusion would be premature.
SK Hynix’s core investment case still rests on HBM and AI-related semiconductor demand.
As long as global AI infrastructure investment continues, demand for high-performance memory is likely to remain structurally supported.
However, after a strong run, even small negative headlines can trigger sharp corrections.
Markets sell good companies when valuations are extended, and they react even faster to negative news.
The CXMT report is a reminder that Korean memory companies must continue monitoring Chinese competition.
Still, it is too early to conclude that Chinese suppliers can immediately replace Korean leaders.
Investors should instead focus on supply-chain adoption, qualification progress, yields, U.S. sanctions risk, and Apple’s sourcing strategy.
In short, the report does not imply an immediate displacement of SK Hynix.
It does, however, indicate that Chinese memory suppliers remain a competitive factor in global supply chains.
11. Key indicators to monitor going forward
First, the direction of the U.S. semiconductor index.
Stabilization in U.S. chip stocks is likely necessary for a rebound in Korean large-cap semiconductors.
Second, international oil prices and Middle East risk.
Persistently higher oil prices would revive inflation concerns and pressure rate expectations.
Third, the won-dollar exchange rate.
Sharp currency weakness could further unsettle foreign flows.
Fourth, foreign futures positioning.
Heavy foreign futures selling can amplify program-trading pressure during a market drawdown.
Fifth, Kosdaq margin balances.
Names with high margin exposure face higher forced-selling risk in a decline.
Sixth, follow-up reports on Apple and CXMT.
Investor sentiment will depend on whether the issue remains at the testing stage or evolves into a broader sourcing possibility.
12. What individual investors should be most careful about
In this kind of market, the biggest mistake is rushing to average down.
A sharp drop does not automatically mean a stock has become cheap.
Volatility can continue for several days after the initial selloff.
Leveraged ETFs, margin-financed positions, and short-term thematic stocks require particular caution.
In a down market, leverage magnifies losses faster than it helps recovery.
Investors with cash available may be better served by gradually reviewing high-quality names.
The priority is not to call the exact bottom.
The priority is to maintain a portfolio that can survive volatility.
In markets, survival comes before returns.
13. Core conclusion from the Kospi sidecar event
This decline in the Kospi and Kosdaq cannot be explained by a single factor.
It was a composite shock involving U.S. equity weakness, semiconductor losses, higher oil prices, greater rate pressure, the CXMT report, and leveraged positioning.
Korea’s market is especially sensitive because of its heavy exposure to semiconductors.
The Kosdaq is more vulnerable because it is concentrated in growth sectors that respond strongly to rates and sentiment.
The key is not to panic and sell everything, nor to assume that every decline is a buying opportunity.
Investors should distinguish between events that damage fundamentals and events that mainly reflect sentiment and positioning.
That distinction is especially important in the current environment.
< Summary >
Kospi and Kosdaq sidecar events were driven by a combination of U.S. market declines, weaker semiconductor stocks, higher oil prices, the CXMT report, and leveraged ETF flows.
SK Hynix and Samsung Electronics were at the center of the selloff as semiconductor sentiment deteriorated.
The Kosdaq reacted more sharply because of its higher exposure to growth stocks and its sensitivity to rates and sentiment.
This decline appears more consistent with a higher discount-rate and weaker liquidity environment than with a direct earnings shock.
Key indicators to monitor include the U.S. semiconductor index, international oil prices, the won-dollar exchange rate, foreign futures positioning, and follow-up developments related to CXMT.
[Related Articles…]
- Kospi Selloff and Sidecar Triggers: Key Signals for Investors
- AI Semiconductor Cycle and SK Hynix Outlook: Core Investment Takeaways
*Source: [ 내일은 투자왕 – 김단테 ]
– 코스피 연이틀 사이드카의 3가지 이유 #하이닉스 #코스피 #사이드카
● Gold-Shock, ETF-Vs-Bullion, Fed-Fear
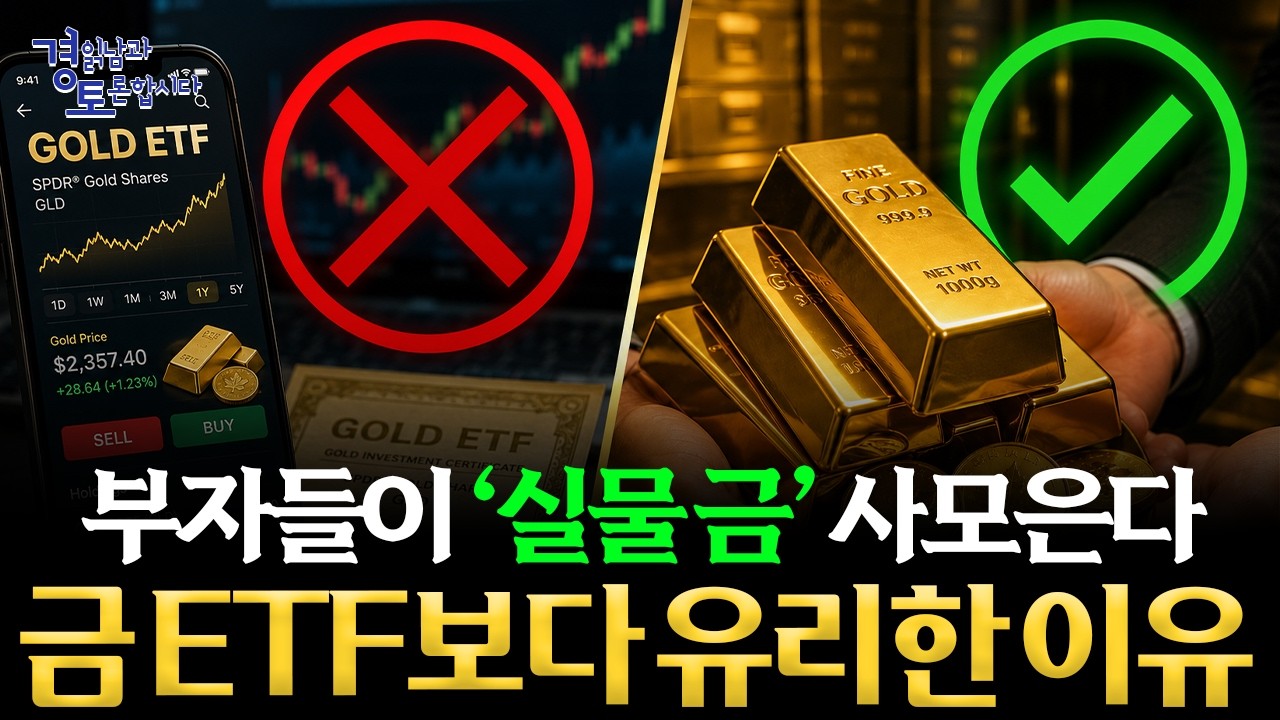
Gold Investment: Why Physical Gold Can Be More Advantageous Than ETFs — Gold Price Outlook, U.S. Rates, CPI, and Long-Term Strategy
The key point in this discussion was not simply whether a gold ETF is better than physical gold.
The central issue was the real variable driving gold investment returns: not the product itself, but whether the investor has a structure that allows them to hold through volatility over time.
In particular, it was notable that physical gold can support long-term investing by providing a behavioral discipline, even though it carries costs such as 10% value-added tax, fabrication expenses, and distribution costs.
The discussion also covered how U.S. interest rates, CPI, inflation, FOMC decisions, and a stronger dollar affect the outlook for gold prices.
In summary, this article reviews the differences between gold ETFs and physical gold, KRX gold market investment methods, long-term versus short-term return dynamics, the link between U.S. policy rates and gold prices, and the behavioral factors that are often overlooked in gold investing.
1. Core Differences by Gold Investment Method: Physical Gold, Gold ETFs, and the KRX Gold Market
Gold investment can be broadly divided into three approaches.
The first is buying and holding physical gold, such as a gold bar.
The second is investing in gold through financial products such as gold ETFs.
The third is investing in physical gold through the KRX gold market.
At a glance, all three are tied to gold price appreciation.
In practice, however, investor behavior tends to differ significantly.
Gold ETFs are easy to buy and sell, which increases the likelihood of short-term trading.
Physical gold, by contrast, is often held for longer periods once purchased.
This difference may translate into different long-term outcomes.
2. Why Gold ETFs May Appear More Rational from a Pure Cost Perspective
From a cost standpoint alone, gold ETFs or the KRX gold market may appear more efficient than physical gold.
Purchasing a physical gold bar typically involves a 10% VAT.
Additional costs may include fabrication, distribution, appraisal, and dealer margins.
By contrast, gold ETFs eliminate storage burdens and are easier to trade.
There is no theft risk.
Capital gains can also be realized more easily when gold prices rise.
From a purely economic perspective, gold ETFs or the KRX gold market may appear to be the more efficient choice.
For short-term trading or asset allocation purposes, gold ETFs can be a rational option.
3. Why Physical Gold Remains Attractive: The Psychological Value of Direct Ownership
One of the most important points in the discussion was that the satisfaction of holding physical gold has economic value.
Gold is not just an investment product.
For many conservative investors, especially older investors, it is a tangible safe-haven asset.
A gold bar in a safe or storage location may provide more reassurance than a number on a screen.
That reassurance is not merely emotional; it is a form of utility.
In other words, the psychological stability gained from holding physical gold can be viewed as an additional return.
This does not apply equally to all investors.
For some, storing physical gold may be a burden.
There are also concerns about theft, loss, and storage arrangements.
Accordingly, physical gold is not universally superior.
However, if the investor derives substantial comfort from direct ownership, physical gold may be the better option for that individual.
4. A Hidden Advantage of Physical Gold: It Encourages Long-Term Holding
The real strength of physical gold is that it changes investor behavior.
Gold ETFs can be sold with a few clicks.
As a result, investors may be more inclined to sell when prices fluctuate.
Physical gold, however, is more cumbersome to liquidate.
Selling may require visiting a dealer or identifying a buyer.
The process is less convenient than trading an ETF.
That inconvenience can encourage long-term holding.
In investing, the challenge is often not buying a good asset, but holding it without reacting to short-term volatility.
The same applies to gold.
For investors who believe in the long-term trend, a structure that reduces impulsive selling can be valuable.
Physical gold can create that structure.
5. The Return Difference Between Gold ETFs and Physical Gold May Be Driven More by Holding Period Than by Product Type
An important interpretation from the discussion was not that physical gold outperforms ETFs, but that investors in physical gold are more likely to hold longer, which can improve outcomes over time.
This is similar to equity investing.
Long-term investors are more likely to benefit from major trends.
Short-term investors are more exposed to volatility.
If gold prices correct, investors who sell out of fear may miss the subsequent rebound.
Ultimately, the difference between physical gold and gold ETFs may lie less in the product and more in investor behavior.
Physical gold tends to make investors less reactive.
In some cases, being less reactive can produce better outcomes.
6. Practical Challenges for KRX Gold Market Investors: Buying the Low Is Harder Than It Seems
The KRX gold market provides a relatively efficient way to invest in physical gold.
However, practical execution is more difficult than it appears.
Gold prices move in global markets.
Because of time differences between New York, London, and the Korean market, it is difficult for domestic investors to buy precisely at the global low.
In theory, buying low and selling high is straightforward.
In practice, identifying exact turning points is nearly impossible.
This is especially true because gold prices can shift rapidly in response to U.S. rate expectations, dollar strength, and inflation data.
For that reason, many professionals prefer not to wait for the absolute bottom if they have conviction in the long-term trend.
7. The Main Drivers of Gold Prices: U.S. Interest Rates and Inflation
One of the most important factors in the outlook for gold prices is the U.S. policy rate.
When U.S. interest rates rise, gold may face downward pressure.
The reason is simple.
Gold does not generate yield.
As rates increase, interest-bearing assets such as bonds and deposits become more attractive.
As a result, gold may lose relative appeal.
Conversely, when rate hikes appear less likely or expectations shift toward a pause, gold may gain upward momentum.
Gold price outlook is therefore closely linked to expectations for U.S. interest rates.
8. Why CPI and PPI Matter: They Are the Starting Point for Rate Decisions
The Federal Reserve places significant weight on inflation data when determining policy rates.
Two key indicators are CPI and PPI.
CPI is the consumer price index.
It reflects the inflation pressure experienced by consumers.
PPI is the producer price index.
It captures price changes faced by firms during production.
When CPI and PPI rise, markets begin to price in the possibility of higher rates.
When inflation stabilizes, expectations for rate pauses or cuts may strengthen.
These shifts in expectations are quickly reflected in gold prices.
Gold investors should therefore monitor U.S. inflation data, not only gold prices themselves.
9. The Current Gold Correction: More About Rate-Hike Fear Than Actual Rate Hikes
One important interpretation in the discussion was that the current correction in gold may not be driven solely by actual rate increases.
Markets are also reacting to the possibility of additional hikes.
Between FOMC meetings, uncertainty tends to rise.
During this period, expectations and fear can move prices more than actual policy changes.
When rate-hike concerns intensify, gold may correct.
However, if rates are ultimately held steady, sentiment can change.
Once rate-hike fears subside and expectations shift toward a pause, gold prices may recover.
Investors should therefore assess the actual probability of rate changes rather than relying only on headline language.
10. A Temporary Rise in Inflation Does Not Automatically Lead to Higher Rates
U.S. inflation may rise temporarily.
However, a short-term increase in prices does not automatically prompt the Fed to raise rates.
If policy rates are already at a restrictive level designed to curb inflation, the Fed may prefer to hold rather than tighten further.
The key question is whether inflation is temporary or structural.
If CPI and PPI show a brief rebound but then stabilize, the case for additional hikes weakens.
In that scenario, markets may again price in rate stability or cuts.
Gold could then regain upward support.
11. Internal Fed Variables: Efforts to Create an Environment for Lower Rates
The discussion also touched on possible changes within the Federal Reserve framework.
The key issue is whether conditions can be created that would allow rate cuts.
One factor may be how inflation is measured and interpreted.
If metrics such as trimmed-mean PCE receive greater emphasis than core PCE, inflation may appear more stable.
More stable inflation readings would strengthen the case for rate cuts.
That said, this is not something that can be dictated by one individual alone.
It depends on disagreement among Fed officials, task force research, and external expert input.
As a result, rate forecasts remain uncertain.
Still, if markets are overpricing inflation pressure and rate hikes, any easing in expectations could support gold.
12. Wars, Pandemics, and Geopolitical Risk Are Better Addressed Than Predicted
Gold has traditionally been viewed as a safe-haven asset.
Demand for gold often increases during wars, financial stress, pandemics, and geopolitical tension.
The problem is that these events are difficult to predict precisely.
Very few investors anticipated COVID-19 in advance.
The same applies to the Russia-Ukraine war and Middle East risks.
When unexpected shocks hit markets, investors often respond with fear.
Many short-term investors sell at such moments.
Paradoxically, successful investors often avoid panic selling, or even buy during periods of fear.
Gold investing also requires the ability to withstand fear.
13. The Typical Behavior of Physical Gold Investors: They Tend Not to Sell Easily During Drawdowns
Investors in physical gold tend not to sell easily when prices decline.
In the past, gold was often viewed less as a trading instrument and more as a store of surplus wealth.
As a result, it was commonly held for long periods regardless of price movement.
This habit may seem inefficient in the short term.
However, if gold is in a long-term uptrend, it can be advantageous.
By contrast, more recent gold investors are far more sensitive to price changes.
They want to buy at the bottom and become anxious during short-term corrections.
Yet identifying the exact low is nearly impossible.
From a long-term perspective, a price that is reasonable matters more than a perfect entry point.
14. A Behavior to Avoid in Gold Investing: Selling Out of Fear
The most dangerous behavior in gold investing is selling out of fear.
When gold corrects, investors face two choices.
One is to hold based on the long-term trend.
The other is to sell in anticipation of further declines.
Short-term investors are more likely to choose the second option.
However, markets often rebound after fear peaks.
Investors who sell in panic may lock in losses and miss the recovery.
Long-term investors, by contrast, can ride through corrections.
More active investors may even use corrections as opportunities to add exposure.
15. How to Interpret Last Year’s Rally Followed by the Current Consolidation
The discussion suggested that gold rose excessively last year and may have shown signs of bubble-like behavior.
After a sharp rally, consolidation or correction is natural.
For investors who entered near the peak, the current range may feel prolonged.
However, if one has confidence in the long-term upward trend in gold prices, selling mid-cycle should be approached carefully.
Gold prices are influenced by U.S. rates, dollar strength, inflation, geopolitical risk, and central bank demand.
Short-term fluctuations are possible, but long-term safe-haven demand may remain intact.
16. The Most Important Point Often Missing from Other Coverage
Most reports on gold prices focus on U.S. rates, CPI, the dollar index, and geopolitical developments.
These variables are important.
However, the more important determinant of individual investor returns is often different.
The key question is whether the investor can hold the chosen product long enough.
Even if a gold ETF is efficient, frequent monitoring may lead investors to act too soon.
By contrast, physical gold may encourage longer holding periods, even at a higher cost.
That behavioral effect can support long-term outcomes.
In other words, the main question in gold investing is not simply whether to buy an ETF or a gold bar.
The real question is which structure allows the investor to hold through volatility.
Without that perspective, a gold strategy is incomplete.
17. Gold Investment Strategy by Investor Type
1) Investors seeking short-term price gains
Gold ETFs or the KRX gold market may be more suitable.
They offer convenience and liquidity.
However, U.S. rates, CPI, FOMC schedules, and dollar strength should be monitored closely.
Short-term trading offers opportunity, but also significant risk.
2) Investors seeking long-term safe-haven exposure
Physical gold may be a better fit.
Direct ownership can provide reassurance and reduce the tendency to trade impulsively.
However, investors should account for the 10% VAT, fabrication costs, and storage risk.
3) Investors focused on asset allocation
A combination of gold ETFs and physical gold may be appropriate.
Liquidity needs can be met through ETFs, while long-term exposure can be held in physical form.
This approach improves flexibility.
4) Investors with low tolerance for market volatility
Physical gold may actually be the better option.
A structure that allows frequent trading can be harmful for investors who are prone to anxiety.
The inconvenience of physical gold can serve as a discipline for long-term holding.
18. Key Indicators to Watch in the Gold Outlook
First, U.S. CPI.
If inflation re-accelerates, concerns about additional rate hikes may increase.
Second, U.S. PPI.
Rising producer prices can pass through to consumer prices later.
Third, FOMC rate guidance.
Expectations for a pause can support gold prices.
Fourth, dollar strength.
A stronger dollar generally weighs on gold.
Fifth, geopolitical risk.
War, financial stress, and political uncertainty can increase demand for safe-haven assets.
19. Conclusion: In Gold Investing, Behavior Matters More Than Product Selection
Gold ETFs offer advantages in cost and liquidity.
The KRX gold market provides domestic investors with an efficient way to access physical gold.
Physical gold entails higher costs, but it can improve behavioral discipline and support long-term holding.
Accordingly, there is no single correct answer in gold investing.
The choice depends on whether the investor can withstand short-term volatility, whether direct ownership provides stability, and what the allocation objective is.
However, if one believes in the long-term upward trend in gold prices, the most important factor is avoiding impulsive selling during periods of uncertainty.
In gold investing, the decisive factor is less about finding the bottom than about enduring volatility over time.
[Related Articles…]
Gold Price Outlook and Safe-Haven Allocation Strategy
U.S. Rate Shifts and Global Economic Outlook
*Source: [ 경제 읽어주는 남자(김광석TV) ]
– 금 투자, ETF 말고 실물로 사야 하는 이유| 경읽남과 토론합시다 | 금남일 대표님 [3편]