● Tesla-300-Breakdown, Fed-Hawkish-Shock, AI-Cost-Surge
Tesla Falls Below $300 as Rising AI Investment Costs and U.S. Rate Risk Hit Growth Stocks
Tesla’s share price has dropped below $300, sharply increasing market caution.
On the surface, this may look like another routine correction in Tesla shares. In reality, the decline reflects broader pressures beyond the company itself.
The key factors are threefold.
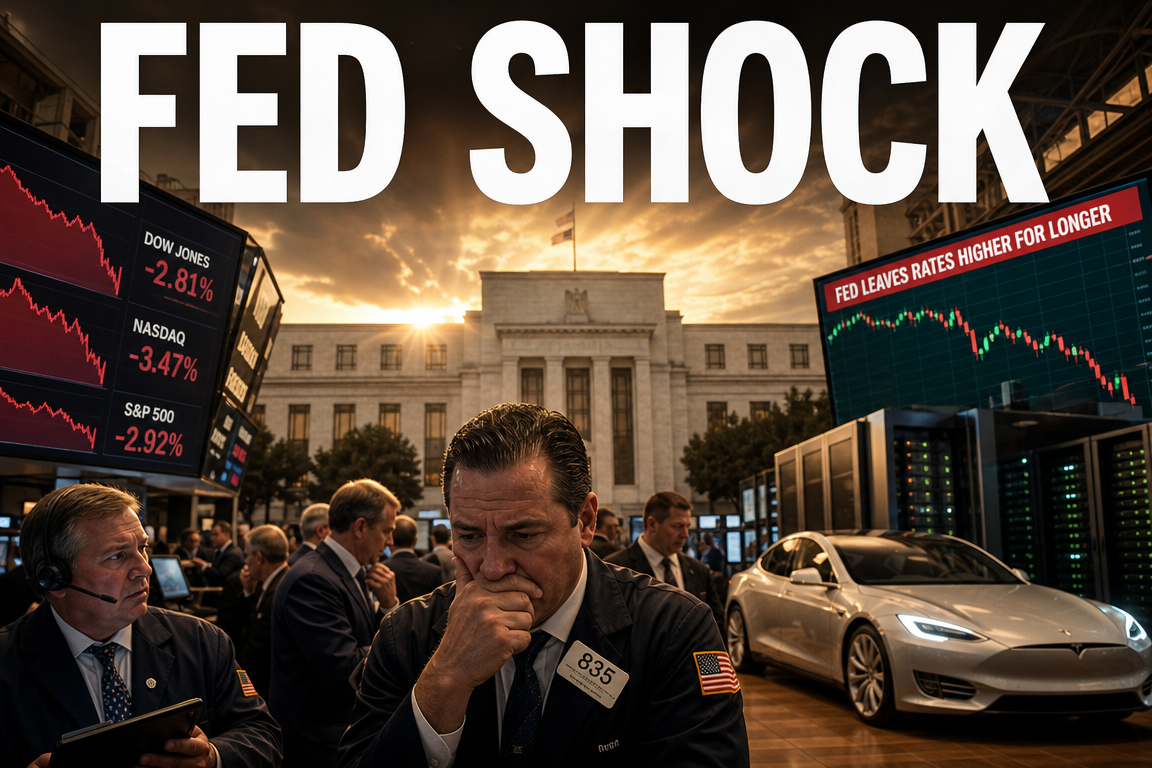
First, despite the Federal Reserve keeping its policy rate unchanged, several members voted in favor of a rate hike.
Second, rising oil prices and renewed inflation pressure are weakening growth-stock valuations.
Third, both Tesla and Meta posted revenue growth, but rapidly rising AI investment costs have raised concerns about near-term profitability.
In other words, Tesla’s drop below $300 is not simply a result of weaker vehicle sales.
It is better understood as a correction driven by the combined effects of U.S. interest rates, inflation, AI spending, Big Tech earnings, and growth-stock valuation pressure.
1. Tesla Shares Fall Below $300
Tesla closed at $298.32, down 2.97% on the day.
After holding above the $300 level for several sessions, the stock ultimately broke through this psychological support zone.
Tesla had reached $319 on July 23 and declined to around $309 by July 27.
Buying and selling pressure continued around the $300 level, but selling pressure ultimately prevailed.
- Tesla closing price: $298.32
- Daily decline: -2.97%
- Recent high range: $319
- Psychological support level: $300
- Decline since Q2 earnings: approximately 14.5%
The difference between $298 and $300 may appear small in numerical terms.
However, in the stock market, round numbers such as $300 often act as psychological reference points.
Once such a level breaks, short-term investors may treat it as a stop-loss signal, while algorithmic trading systems may respond with additional selling.
As a result, volatility often increases beyond what underlying fundamentals alone would justify.
2. This Was Not Tesla-Specific
Importantly, the decline was not limited to Tesla.
According to the source text, the Nasdaq, S&P 500, and Dow Jones Industrial Average all fell on the same day.
- Nasdaq: -1.4%
- S&P 500: -1.45%
- Dow Jones Industrial Average: -2.18%
The fact that the Dow fell more sharply than the Nasdaq is notable.
This suggests that the market was not simply selling AI or EV-related names, but was broadly reducing exposure to risk assets.
Tesla’s drop below $300 occurred alongside a wider market correction, amplifying investor concern.
In short, Tesla’s move reflected both company-specific and macroeconomic pressure.
3. The Fed Held Rates, but Markets Became More Cautious
The source states that the Federal Reserve kept its benchmark rate in the 3.5% to 3.75% range for a fifth consecutive meeting.
Normally, a rate hold would be viewed positively by equity markets.
This time was different.
The vote was 9 to 3, with three members favoring a rate hike.
Markets reacted to those three dissenting votes.
Investors had largely assumed that the risk of another hike had faded.
The confirmation that a meaningful hawkish faction still exists within the Fed weakened sentiment toward growth stocks.
Growth stocks are often valued on future earnings expectations rather than current profits.
Tesla, Meta, and Nvidia are leading examples.
If the market sees a renewed risk of tighter monetary policy, the discount rate used to value future cash flows rises.
That mechanically lowers fair-value estimates for growth stocks.
This is a major reason Tesla came under pressure.
4. Oil Prices and Inflation Risks Reemerge
The source also highlights Middle East tensions, declining U.S. crude inventories, and the possibility that OPEC+ may pause production increases.
Although expectations for easing between Israel and the United States improved, renewed concerns involving Iran brought geopolitical risk back into focus.
At the same time, U.S. crude inventories reportedly fell by about 3.3 million barrels.
Expectations that OPEC+ may halt output increases from October added further upward pressure on oil prices.
Higher oil prices raise transportation costs, production costs, and consumer prices.
This can reignite inflation.
If inflation rises again, the Fed may delay rate cuts or adopt a more hawkish stance.
That would be unfavorable for growth stocks, including Tesla.
Tesla is not only an automaker. It is also valued on expectations for autonomous driving, robotaxis, Optimus, energy storage, and AI infrastructure.
Companies with high future growth expectations are more sensitive to changes in rates and inflation.
5. Meta’s Selloff Reflected the Same Concern
Meta is the most relevant comparison in this market move.
According to the source, Meta reported second-quarter revenue of $60.8 billion.
That represented 28% year-over-year growth.
Ad impressions rose 14%, and ad pricing increased 12%.
Its core advertising business remained strong.
Even so, the market reaction was negative.
Meta’s net income fell 14% year over year to $15.85 billion, and operating margin declined from 43% to 31%.
The main reason was capital spending to expand AI infrastructure.
- Meta revenue: $60.8 billion
- Revenue growth: +28%
- Net income: $15.85 billion
- Net income decline: -14%
- Operating margin: 43% to 31%
- AI infrastructure capex: $31.08 billion
- Free cash flow: $8.55 billion to $780 million
Meta’s business remained strong operationally.
However, the market focused more on rising AI investment costs than on revenue growth.
Mark Zuckerberg argued that AI is accelerating core business performance and is already generating benefits.
Wall Street, however, is asking when those benefits will translate into earnings.
As a result, Meta also sold off after earnings.
This is highly similar to Tesla’s case.
6. Tesla and Meta Share a Common Pattern: Revenue Growth, Cash Flow Pressure
Tesla also reported revenue growth in the second quarter.
According to the source, Tesla posted revenue of $28.2 billion, up 26% year over year.
Quarterly deliveries reached 481,126 units, a record level.
On the surface, these were not weak results.
The issue was profitability.
Tesla’s operating margin fell to around 1.4%.
Capital spending rose 142% year over year as the company increased investment in AI and robotics.
As a result, free cash flow turned negative at $1.1 billion.
- Tesla revenue: $28.2 billion
- Revenue growth: +26%
- Quarterly deliveries: 481,126 units
- Operating margin: 1.4%
- Capex growth: +142%
- Free cash flow: -$1.1 billion
The common theme across Tesla and Meta is clear.
Both companies are growing revenue.
However, rising AI investment is weighing on near-term earnings and cash flow.
Markets understand that AI investment is necessary for long-term competitiveness.
At the same time, they are increasingly concerned about the short-term cost burden.
That tension is now a central driver of Big Tech valuation risk.
7. Why Tesla Faces Greater Pressure Than Meta
Both Tesla and Meta are under pressure because of AI spending.
However, their financial profiles differ.
Meta still has a high-margin advertising business.
Even with higher AI spending, it continues to generate substantial cash from its core operations.
Tesla, by contrast, is facing lower margins in its automotive business.
Price competition in EVs, sales incentives, manufacturing costs, and a lack of major new models are all weighing on profitability.
If Tesla increases spending on AI, robotics, autonomous driving, and supercomputing infrastructure in this environment, cash flow pressure could intensify further.
In short, Meta is closer to a company that earns significant cash and reinvests heavily in AI, while Tesla is making forward-looking investments from a lower-margin automotive base.
That distinction makes Tesla more sensitive to market stress.
8. The Market Dislikes One Phrase Above All: “We Have No Plan to Reduce AI Investment”
Tesla and Meta share another important trait: neither appears ready to slow AI investment.
From a corporate perspective, that is rational.
Falling behind in AI could damage long-term growth prospects.
For investors, however, it is a concern.
AI infrastructure spending includes servers, data centers, semiconductors, power, cooling systems, software, and talent acquisition.
Once underway, it is difficult to scale back quickly.
Generative AI and autonomous-driving AI also require high upfront costs and take time to monetize.
This means current earnings pressure may not be a one-quarter event.
It may represent a structural cost increase that persists over several quarters.
That is one of the market’s main concerns.
9. SpaceX Had Positive News, but the Market Remained Cautious
The source also mentioned SpaceX-related news.
Raymond James initiated coverage on SpaceX with an outperform rating and an $800 target price.
Given the source’s reported SpaceX share price of $112.5, that target implies a highly aggressive upside view.
The rationale was the success of the 13th Starship test flight.
The Super Heavy booster landed in the Gulf of Mexico as planned, and Starship deployed 20 Starlink V3 satellites before landing safely in the Indian Ocean.
Heat shield testing and successful engine relight in space were highlighted as key achievements.
Technically, this was a strong result.
Even so, the market reaction was muted.
According to the source, SpaceX-related shares fell 3.32%.
This suggests that investors are prioritizing cash flow, earnings, and rate risk over long-term growth narratives.
Even strong future potential is being weighed against near-term financial discipline.
10. The Key Point Missed by Many Reports: The Market Is Not Rejecting AI, but Questioning the Payback Period
The central issue is not whether AI investment is negative.
The market is not rejecting AI.
AI remains one of the strongest long-term growth themes.
The issue is the payback period.
Meta can use AI to improve ad efficiency, recommendation systems, and user engagement.
As a result, its AI spending may translate into measurable results relatively quickly.
Tesla, however, needs more time before autonomous driving, robotaxis, Optimus, and Cybercab meaningfully contribute to revenue and profit.
That is why the market applies a stricter standard to Tesla.
Tesla’s AI investment is essentially being treated as a long-dated option on future value.
On the current balance sheet, however, it is a cash outflow today.
The wider that gap becomes, the more Tesla’s stock may react to interest rates and market sentiment.
For Tesla to re-rate meaningfully, management will need to provide evidence, not just strategic intent.
- Higher FSD usage
- Improved autonomous-driving performance data
- Clear robotaxi commercialization timing
- Optimus production and deployment evidence
- A visible path from AI investment to revenue
- Potential recovery in automotive margins
If any of these become clearer, market sentiment could shift quickly.
Without measurable evidence, recovery above $300 may take time.
11. Key Variables for a Return Above $300
To assess whether Tesla can move back above $300, chart levels alone are not enough.
Four variables matter most.
1) Whether hawkish views increase at the next Fed meeting
There were three votes in favor of a rate hike at this meeting.
If that number rises next time, the market may price in greater rate risk.
Tesla is highly sensitive to changes in rates.
More hawkish dissent would make a return above $300 more difficult.
2) Oil and inflation trends
If oil prices continue to rise, inflation concerns could intensify.
Higher inflation would weaken expectations for rate cuts.
That would pressure growth stocks broadly.
Oil prices and inflation data therefore remain important for Tesla investors.
3) How Wall Street reassesses Big Tech AI spending
Meta, Microsoft, Alphabet, Amazon, and Tesla are all increasing AI infrastructure investment.
The key question is whether markets view this as long-term growth investment or near-term margin pressure.
If concerns about AI spending spread across Big Tech, Tesla is unlikely to be spared.
4) Tesla’s own AI and robotics execution
Ultimately, Tesla must prove its own case.
FSD, robotaxi, Optimus, and Cybercab updates need to become more specific.
Investors want commercialization timelines and monetization models, not only technical demonstrations.
Clear revenue pathways would materially improve sentiment toward Tesla’s AI investment.
12. How to Interpret the Drop Below $300
It would be too strong to conclude that Tesla’s fundamentals have suddenly deteriorated.
Tesla still shows revenue growth and higher deliveries.
However, the market is not currently focused on revenue.
It is focused on profitability, cash flow, and the return on AI investment.
Those concerns were amplified by U.S. rate risk and renewed inflation pressure.
The $300 level remains an important psychological marker in the short term.
More important, however, is whether the market is willing to restore a premium for Tesla’s future investments.
At present, the market is effectively saying: AI is attractive, but the cost is too high.
To offset that concern, Tesla must show concrete progress in robotics and autonomous driving.
Until then, even if the stock recovers above $300, volatility is likely to remain elevated.
< Summary >
Tesla closed at $298.32, falling below the $300 psychological support level.
The decline was not Tesla-specific. It reflected hawkish Fed voting, higher oil prices, inflation concerns, and valuation pressure across growth stocks.
Meta also sold off after reporting strong revenue but weaker net income and free cash flow due to AI infrastructure spending.
The common issue for Tesla and Meta is that AI investment costs have become a central market concern, despite revenue growth.
Tesla appears more exposed than Meta because it is investing heavily in AI and robotics while operating with weaker automotive margins.
The key variables for Tesla’s stock recovery are the Fed’s policy stance, oil and inflation trends, market sentiment toward Big Tech AI spending, and execution on FSD, robotaxi, and Optimus.
For Tesla, the more important question is not whether it can regain $300, but whether it can show the market that AI investment can be converted into earnings.
[Related Articles…]
*Source: [ 오늘의 테슬라 뉴스 ]
– 테슬라 결국 300 깨졌습니다 — 근데 메타도 같은 이유로 ? $298 주주는?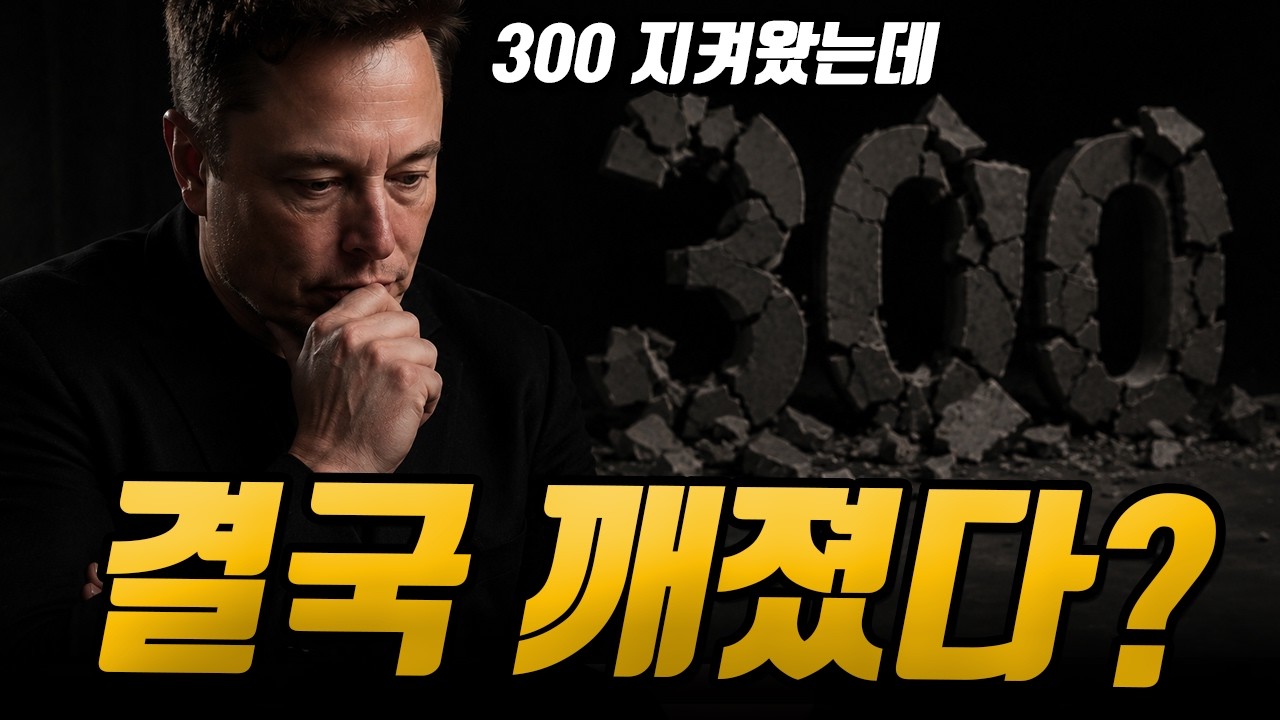
● Surge, Shock, Risk
Why Samsung Electronics Shares Did Not Rally Despite an Earnings Surprise: Market-Structure Risks Matter More Than Semiconductor Results
Samsung Electronics reported record quarterly results, yet the market reaction was unusually subdued.
On revenue and operating profit alone, the company delivered a clear earnings surprise, but Samsung Electronics and SK Hynix shares failed to rebound sharply, and the KOSPI did not recover meaningfully.
The key issue is not simply whether earnings were strong or weak.
The substance of semiconductor equities now extends beyond the memory-price cycle to include AI data center investment, HBM market share, global capital concentration, and leveraged single-stock ETF dynamics.
Most importantly, the key point in this release is not that Samsung Electronics generated exceptionally high profits, but that nearly all of those profits came from a single semiconductor division.
This structure is likely to influence the KOSPI outlook and volatility across the Korean equity market.
1. Samsung Electronics’ Final Q2 Results: The Numbers Alone Show a Clear Earnings Surprise
-
Samsung Electronics reported consolidated revenue of KRW 171.5 trillion.
-
This was slightly above the preliminary figure of KRW 171 trillion.
-
Operating profit came in at KRW 89.5 trillion.
-
This also slightly exceeded the preliminary estimate of KRW 89.4 trillion.
-
Operating profit increased by approximately 1812-1814% year on year.
-
Revenue rose 28% quarter on quarter, while operating profit increased 56% quarter on quarter.
Because the preliminary earnings release had already been disclosed on July 7, the final results were not viewed as a completely new shock by the market.
However, the company did exceed the preliminary figure, so the release still qualified as an earnings surprise.
The issue is that the results were so strong, yet the share price did not react forcefully.
2. 99.7% of Operating Profit Came from Semiconductors: Samsung’s Strength and Weakness
The standout segment in this release was the DS division, or semiconductors.
-
DS division revenue was KRW 127.5 trillion.
-
DS division operating profit was KRW 89.2 trillion.
-
That means about 99.7% of total operating profit of KRW 89.5 trillion came from semiconductors.
-
The semiconductor division posted an operating margin of about 70%.
-
Memory revenue accounted for KRW 120.8 trillion out of the DS division’s KRW 127.5 trillion in revenue.
On these figures, Samsung Electronics appears to be a major beneficiary of the global semiconductor supercycle.
Rising memory prices and stronger AI server demand clearly supported earnings.
In an environment of expanding HBM demand and higher-performance DRAM demand, Samsung Electronics has again demonstrated strong earnings power.
However, the market is asking a different question.
The issue is not whether Samsung Electronics earned more, but whether this profit structure is sustainable.
When nearly all operating profit is concentrated in semiconductors, the company can deliver explosive results in an upcycle, but total earnings can also weaken quickly when the cycle turns.
3. DX Division Turned to a Loss: Semiconductor Strength Became an Internal Cost Burden
Another important point in the release was the DX division.
The DX division includes mobile devices, TVs, and home appliances.
-
The DX division posted an operating loss of roughly KRW 800 billion.
-
This was described as the first quarterly loss since the DX division was established in 2021.
-
One reason cited was chipflation, driven by sharply higher memory costs.
This creates an internal contradiction.
Rising memory prices are highly beneficial for the DS division.
At the same time, they raise input costs for DX products such as smartphones, TVs, and appliances.
In other words, one part of the company benefits from higher semiconductor prices while another absorbs the cost pressure.
This is not a minor detail.
Samsung Electronics is simultaneously a beneficiary of higher memory prices and a victim of them.
If memory prices continue to rise, DS earnings may improve further, but DX profitability could face additional pressure.
4. EPS Came in Below Expectations: Why the Market Remained Cautious
Earnings per share, or EPS, came in below market expectations.
-
Reported EPS was approximately KRW 10,849.
-
This was below the consensus estimate of KRW 11,123.19.
EPS falling short of expectations, despite record operating profit, is a concern for investors.
The absolute scale of earnings was large enough that this alone does not justify a negative view.
Still, equity markets tend to focus on earnings per share rather than headline operating profit.
This helps explain why the stock did not rally strongly despite the earnings beat.
5. Why Samsung Electronics and SK Hynix Did Not Rebound Sharply
The market reaction looked unusual because the results were outstanding, yet shares did not move accordingly.
However, the market is already pricing in several risks.
5-1. The Preliminary Release Was Already Priced In
Since the July 7 preliminary earnings release was already public, the market had largely anticipated strong results.
The final figures only modestly exceeded the preliminary numbers, so the incremental information shock was limited.
Equities tend to react more to how much better results are versus expectations than to results alone.
In this case, the surprise was not large enough to trigger a strong rerating.
5-2. Competition in the Memory Market Is Intensifying
Samsung Electronics and SK Hynix remain major players in the DRAM market.
However, competitors such as Micron, ChangXin Memory Technologies, and Nanya continue to close the gap.
China is expanding investment to build a self-sufficient semiconductor supply chain.
The United States is also strengthening its supply chain around Micron.
At this stage, all major semiconductor firms are benefiting from the upcycle.
But if market share is being lost even during an upcycle, that becomes a long-term headwind for valuations.
Investors are focusing less on current earnings and more on future market-share gains.
5-3. Micron’s Push into HBM Is Accelerating
The core of the AI semiconductor cycle is HBM.
HBM is regarded as a critical component for Nvidia GPUs and AI data center expansion.
Samsung Electronics’ HBM market share was cited at around 21%.
That is lower than the prior 22-23% range, which is another area of concern.
SK Hynix has also maintained a dominant position, but Micron is quickly catching up.
SK Hynix initially had an advantage in Nvidia’s supply chain, Samsung Electronics later entered the market, and Micron has recently become more visible.
HBM is more technically demanding than standard memory and requires customer qualification.
As a result, even small changes in market share can have a large impact on share prices.
5-4. The Gap with TSMC Remains Large in Foundry
Unlike SK Hynix, Samsung Electronics also operates a foundry business.
That remains a key differentiator.
However, TSMC continues to dominate the foundry market.
Samsung Electronics previously held more than 20% of the foundry market, but current conditions suggest that it has ceded significant share to competitors and to TSMC.
Foundry is highly strategic in the AI era.
Companies such as Nvidia, AMD, Apple, and Qualcomm design chips and outsource production to foundries.
If Samsung Electronics cannot narrow the gap with TSMC, its share of the AI semiconductor value chain will remain limited.
6. The Real Issue Is Capital Concentration in the Korean Market
The most important structural issue in this discussion is capital concentration in the Korean equity market.
The combined weight of Samsung Electronics, Samsung Electronics preferred shares, SK Hynix, and SK Square was described as exceeding 50% of the KOSPI.
This means that if Samsung Electronics and SK Hynix weaken, the entire KOSPI will inevitably be affected.
The United States also has a concentration in large technology stocks.
The M7 companies account for a significant share of the U.S. market.
However, the share of the M7 in the U.S. market was cited at around 35%.
China’s major technology names also have meaningful weight, but the degree of concentration around just two companies in Korea is more extreme and more sensitive.
In this structure, even if Samsung Electronics reports strong earnings, the KOSPI can still fall sharply once investors question the sustainability of the semiconductor cycle.
For that reason, KOSPI analysis must include the market-cap structure, not just Samsung Electronics’ results.
7. Single-Stock Leveraged ETFs Increased Volatility
The release also highlighted the role of single-stock leveraged ETFs.
When 2x leveraged products are linked to major KOSPI constituents such as Samsung Electronics or SK Hynix, volatility increases materially.
A leveraged ETF does not simply move twice as much as the underlying stock over a longer period.
Because it tracks daily returns, repeated declines and rebounds create compounding effects.
In a sharp downturn, negative compounding can become severe, and the ETF may not recover even if the underlying stock later rebounds.
This can be unfavorable for retail investors.
It can also amplify selling pressure and market volatility.
That is one reason leveraged ETFs linked to Samsung Electronics and SK Hynix have moved more sharply than the underlying stocks.
8. The More Important Question Than Semiconductor Earnings: Is AI Actually Generating Returns?
The key demand driver for semiconductor equities is now AI.
AI data center investment and hyperscaler server expansion are driving semiconductor demand.
However, the market is increasingly asking a more important question.
Are AI companies actually generating profits?
The original analysis referred to the LLM token expenditure indicator.
This measure can be interpreted as capturing AI service usage and pricing together.
Rising token usage and higher spending would indicate active AI adoption.
By contrast, a decline would raise concerns about usage growth and monetization.
According to the original analysis, semiconductor stocks weakened during periods when LLM token expenditure softened.
If AI usage does not continue expanding, data center investment may slow.
If data center investment slows, demand for HBM, DRAM, SSDs, and server semiconductors will also be affected.
9. Big Tech Capex Is Still Rising, but Declining FCF Is the Risk
Alphabet, Meta, Microsoft, and other global technology companies continue to spend heavily on capital expenditures.
They are investing heavily in AI data centers, GPUs, and server capacity.
This spending flows through to semiconductor suppliers such as Samsung Electronics and SK Hynix.
However, the key issue is not capex itself.
The market is focused on whether these companies can sustain that spending through future cash flow.
If free cash flow, or FCF, weakens or turns negative, the outlook changes.
So far, these companies have generated enough cash to reinvest aggressively in AI infrastructure, but weaker cash flow could slow the pace of capex growth.
For semiconductor companies, the most concerning scenario is one in which AI investment has already been front-loaded, monetization is delayed, and Big Tech cash flow starts to decline.
In that case, current semiconductor earnings may remain strong, but the market may assign a lower valuation to future earnings.
10. AI Value Chains Could Shift Toward China
Another risk is a geographic shift in the AI value chain.
AI model usage continues to grow, but questions remain about whether the U.S.-centered AI value chain could partially migrate toward China.
China’s major technology names have not been increasing capex as aggressively as U.S. hyperscalers.
If AI demand shifts toward China and Chinese companies strengthen their own semiconductor supply chains, the benefits for global memory companies could be limited.
ChangXin Memory Technologies, or CXMT, is cited as a company rapidly increasing its DRAM share.
According to the original analysis, CXMT’s DRAM share could rise from 8% in 2025 to 11% in 2026.
If Chinese firms move into HBM and higher-value DRAM, Samsung Electronics and SK Hynix will face not only cyclical competition but also industrial-policy competition at the national level.
That is another factor limiting semiconductor valuation multiples.
11. The Most Important Points Not Fully Covered in Other Coverage
The real significance of Samsung Electronics’ earnings surprise is not the headline figure.
Most coverage only notes record operating profit, semiconductor-led earnings, and a loss in the DX division.
From an investment perspective, the more important issues are the following four points.
11-1. Earnings Are Strong, but Profit Quality Is Too Concentrated
When 99.7% of total operating profit comes from semiconductors, that is both a strength and a risk.
If the semiconductor cycle turns, consolidated earnings can weaken quickly.
The market is therefore treating the record results cautiously.
11-2. DS Strength Has Become a Cost Burden for DX
Higher memory prices are a positive for the DS division.
But they also increase input costs for the DX division.
This internal offset is an important factor in assessing Samsung Electronics’ overall profitability.
11-3. The Correction in Shares Is Driven More by Market Structure Than by Earnings
Samsung Electronics and SK Hynix are not weakening because earnings are poor.
The KOSPI is highly dependent on these two companies, so even modest sentiment shifts can produce large index moves.
Single-stock leveraged ETFs further amplify volatility.
11-4. The Sustainability of the AI Investment Cycle Is the Key Driver of Semiconductor Stocks
Going forward, Samsung Electronics and SK Hynix will be driven less by memory prices alone and more by continued AI data center investment.
The crucial question is whether AI is generating real monetization and whether token usage and revenue conversion remain strong.
That will likely determine the durability of the semiconductor supercycle.
12. Key Indicators for Investors to Monitor
-
Whether Samsung Electronics can maintain a DS operating margin near 70%.
-
Whether Samsung Electronics and SK Hynix can defend HBM market share against Micron.
-
Whether Korean memory companies maintain their position in Nvidia’s supply chain.
-
Whether capex growth and FCF trends at Alphabet, Meta, Microsoft, and Amazon remain supportive.
-
The pace of CXMT’s DRAM market-share gains.
-
Whether the KOSPI concentration in Samsung Electronics and SK Hynix continues to rise.
-
Whether inflows and outflows in single-stock leveraged ETFs continue to amplify market volatility.
13. One-Sentence Summary of This Samsung Electronics Release
Samsung Electronics delivered a record earnings surprise.
However, the market is already looking ahead to the next cycle.
The current question is not how much Samsung Electronics earned.
The question is whether AI semiconductor demand can continue at this pace.
Another key question is whether the Korean market can absorb the concentration in Samsung Electronics and SK Hynix.
That is why the lack of a sharp share-price rebound, despite the earnings surprise, is unusual but understandable.
Earnings reflect the past and present, while share prices reflect the future and structural risks.
< Summary >
Samsung Electronics reported Q2 revenue of KRW 171.5 trillion and operating profit of KRW 89.5 trillion, delivering a record earnings surprise.
Approximately 99.7% of total operating profit came from the DS semiconductor division, which posted an operating margin of about 70%.
By contrast, the DX division recorded a loss due to higher memory costs and chipflation.
The share-price reaction remained muted because investors are focused on HBM competition, foundry share, the durability of AI data center investment, and concerns over declining Big Tech free cash flow.
In addition, the heavy concentration of Samsung Electronics and SK Hynix within the KOSPI, together with single-stock leveraged ETFs, has become a major source of market volatility.
Going forward, investors should monitor AI monetization, Big Tech capex, HBM market share, and the pace of China’s semiconductor expansion alongside Samsung Electronics’ earnings.
[Related Articles…]
-
AI Semiconductor Supercycle and the Outlook for Korean Equities
-
KOSPI Volatility and the Risk of Global Capital Concentration
*Source: [ 경제 읽어주는 남자(김광석TV) ]
– [속보] 삼성전자 어닝 서프라이즈. 역대급 실적에도 삼전닉스 급반등은 없는 이상한 시장 [즉시분석]