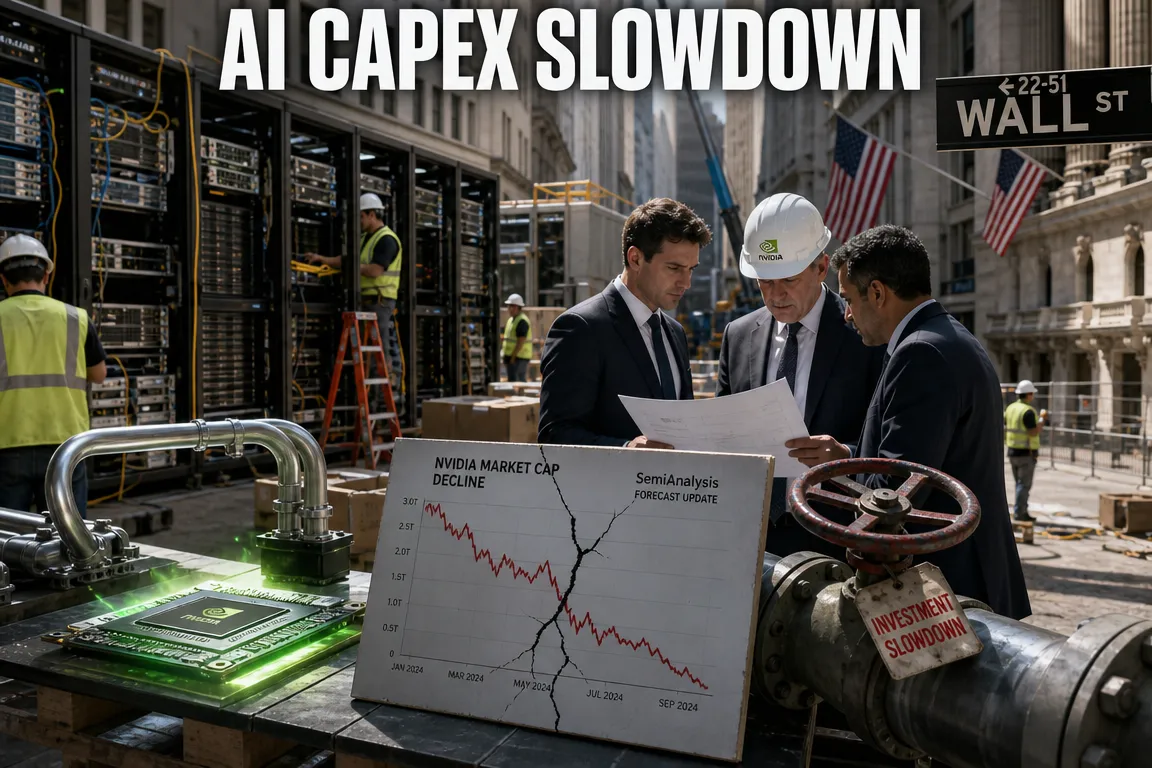
● AI Capex Shock, Nvidia Reckoning
Slowing AI Capex Growth: Investment Returns Matter Before Nvidia’s Outlook
Lower AI investment forecasts do not necessarily indicate a contraction in the AI market.
The central issues are how effectively AI companies convert revenue into cash, who provides credit support for data center construction, and how firmly Nvidia GPU orders are committed.
1. The Central Question: Is AI Investment Declining, or Are Expectations Being Revised?
The source material states that semiconductor research firm SemiAnalysis substantially lowered its medium- and long-term AI capital expenditure forecasts.
AI capital expenditure covers servers, GPUs, networking equipment, data center buildings, and power infrastructure.
Comparisons require consistent coverage of companies, facilities, and spending categories.
| Year | Revision from Previous Forecast | Interpretation |
|---|---|---|
| 2026 | No significant change | The reported adjustments primarily affect the medium- and long-term outlook |
| 2027 | Approximately 19% lower | Investment would be below the previous estimate |
| 2028 | Approximately 28% lower | This is not a year-over-year decline in investment |
| 2029 | Approximately 41% lower | The revision may reflect substantial changes in long-term growth assumptions |
A downward forecast revision is not the same as a year-over-year decline.
If investment is 100 this year and next year’s forecast falls from 200 to 150, the forecast has been cut by 25%, but investment would still increase by 50%.
Without the absolute values of the previous and revised forecasts, a contraction in AI investment cannot be established.
The source also claims that SemiAnalysis’s estimates have converged toward those of other Wall Street institutions.
If accurate, this could represent a shift from unusually optimistic assumptions toward a more conservative baseline, rather than an industry collapse.
Comparisons with Morgan Stanley, UBS, and Goldman Sachs require consistent forecast dates, company coverage, and treatment of leases and power infrastructure.
2. AI Demand: Revenue, Usage, and Profitability Require Separate Assessment
The first reason cited for the downgrade is slower revenue growth at frontier AI companies such as OpenAI and Anthropic.
The underlying mechanism is straightforward.
If end-customer revenue falls short of expectations, AI companies may have less capacity to expand long-term computing commitments.
An estimated revenue chart alone is insufficient to assess overall AI demand.
- Annualized revenue: Extrapolates a particular month’s or quarter’s revenue over a year and differs from actual annual revenue.
- ARR: Generally means annual recurring revenue, but some sources use it interchangeably with annualized revenue. Definitions require verification.
- Third-party estimates: Payment data and usage samples may exclude enterprise contracts, cloud-mediated revenue, and private transactions.
- Revenue growth: Absolute revenue additions can increase even as the percentage growth rate slows.
- Cash collection: Higher revenue may not generate sufficient investable cash if payment terms and operating costs remain unfavorable.
AI usage and AI revenue do not necessarily grow at the same rate.
Rapid growth in processed tokens may produce more moderate revenue growth if prices per token decline.
Conversely, profitability can improve despite slower revenue growth if inference costs fall more rapidly.
AI monetization should therefore be assessed through paying customers, retention, revenue per customer, inference costs, and gross profit.
The investment focus is shifting from usage volume to sustainable earnings.
3. Financing Conditions Are a Critical Variable in Data Center Investment
The second reason cited is deteriorating financing conditions for data center projects.
Demand for AI services does not translate into investment without funding for servers and facilities.
Large cloud providers can draw on internal cash flow and strong credit profiles. GPU-focused neocloud providers and individual project developers may rely more heavily on external financing.
Capital structures vary, however, and neocloud providers should not be assigned a uniform risk profile.
Lenders typically assess the following factors.
- Customer creditworthiness: Whether customers under long-term contracts can continue making payments.
- Contract certainty: Whether commitments are reservations, cancellable agreements, or contracts with minimum payment obligations.
- Equipment residual value: How well existing hardware retains value after next-generation GPUs are introduced.
- Debt maturities: Whether repayment schedules align with the period over which equipment generates cash.
- Operational readiness: Whether power, cooling, and networking capacity are secured.
Higher market interest rates and wider credit spreads increase financing costs.
Even with unchanged demand expectations, fewer projects may meet investment return thresholds.
Insufficient AI demand and inadequate investment returns under current financing conditions are different issues.
The source’s assertion that all projects without hyperscaler guarantees cannot proceed is overly broad.
A more precise interpretation is that anchor-customer credit quality and long-term usage contracts may become increasingly important to project financing.
4. Power and Permitting Constraints Should Not Be Confused with Weaker Demand
The source also raises the possibility of weaker data center construction following the U.S. midterm elections.
The election’s conclusion alone does not establish a construction slowdown.
Assessment requires evidence of changes in local permitting, electricity cost allocation, environmental rules, community opposition, and grid-connection requirements.
Securing GPUs is insufficient to make a data center operational.
Substations, transmission capacity, cooling systems, water supplies, and communications infrastructure must also be ready.
- Cancellations caused by insufficient demand: May indicate deteriorating project economics.
- Deferrals caused by grid-connection delays: May postpone spending and revenue recognition while underlying demand remains intact.
- Relocation: Lower investment in one region may be offset by higher investment elsewhere.
This distinction also matters for the global economic outlook.
AI data center investment supports demand for semiconductors, electrical equipment, construction, cooling, and telecommunications infrastructure.
When annual investment estimates fall, the first question is whether spending has been eliminated or deferred to a later year.
5. Nvidia’s Downside Scenario: Slower Market Growth and Market Share Pressure
The source argues that tighter AI budgets could encourage customers to prioritize cost efficiency and adopt proprietary AI accelerators instead of Nvidia products.
This is plausible, but the assumption that Nvidia GPUs are always less cost-effective is not justified.
Customers evaluate total cost of ownership, not chip prices alone.
| Factor | Key Question |
|---|---|
| Acquisition and development costs | Which option is more economical after including chip prices and in-house design costs? |
| Software migration | How much time and engineering effort are required to migrate existing models and services? |
| Real-world performance | What throughput is achievable at the required accuracy and latency? |
| Utilization | How consistently can the hardware support a range of workloads? |
| Power and operating costs | What are the electricity and cooling costs per unit of service? |
| Time to market | What costs arise if hardware migration delays service launches? |
Proprietary accelerators may offer better economics for specific, repetitive inference workloads at scale.
GPUs may retain advantages where rapid experimentation, software ecosystem support, and operational flexibility are priorities.
The most challenging combination for Nvidia would be slower overall AI investment growth alongside increased customer adoption of proprietary chips.
Financing difficulties among GPU rental providers could add pressure to orders from those customers.
However, wider adoption of proprietary chips does not automatically guarantee stronger results for Broadcom or other suppliers.
Benefits could be limited if market contraction outweighs share gains or customer chip-design schedules slip.
The same applies to high-bandwidth memory and advanced packaging.
Assessment requires consideration of memory content per chip, packaging architecture, and supply contracts, as well as the mix between GPUs and proprietary accelerators.
6. Remote-Access Restrictions Could Target End Users Rather Than Chip Sales
The source claims that the United States is pursuing restrictions on remote access to advanced AI chips located in overseas data centers.
Without verification of official documents and scope, the measure cannot be treated as a finalized regulation currently in force.
If introduced, such restrictions would have a clear implication.
Regulatory scrutiny could extend beyond chip export destinations to the ultimate users of computing resources.
- Cloud providers: Customer verification, intended-use screening, and access-control obligations could increase.
- Data center operators: Utilization and contract continuity could be affected by customer composition.
- Semiconductor suppliers: Order uncertainty could rise in particular regions or customer segments.
- AI developers: Computing procurement locations and suppliers may require reassessment.
Policy development, proposed rules, final rules, and implementation must be distinguished.
Impacts would depend on targeted countries and entities, performance thresholds, and exemptions. A decline in global GPU demand should not be assumed.
7. Claims About Jensen Huang and Anthropic’s IPO Require Separate Verification
The source includes multiple claims concerning Nvidia leadership changes, support for a return, government responses, and investment policy changes.
Given their potential impact on company value and personal reputation, these claims should not be presented as established news without official evidence.
The following verification sequence is appropriate before incorporating them into investment decisions.
- Check Nvidia’s official newsroom and investor relations materials for leadership changes.
- Review U.S. Securities and Exchange Commission filings for relevant disclosures and financial implications.
- Compare government officials’ statements with full interview transcripts and official releases.
- Cross-check reported investment reductions and advance-payment policies against earnings materials and contract disclosures.
Petition counts, online polls, and prediction-market probabilities do not substitute for formal executive appointment procedures.
Anthropic’s reported IPO timetable and initial trading time should not be treated as confirmed without registration documents, exchange notices, or company announcements.
Nvidia’s earnings schedule should likewise be verified using the official release date and the corresponding time in Korea, rather than relative references such as “early Thursday morning.”
8. Earnings Priorities: Assess Reported Results Alongside Future Commitments
The source argues that forward strategy matters more than headline earnings figures.
In practice, financial results and strategic commentary must be assessed together to evaluate management’s statements.
| Metric | Investment Significance |
|---|---|
| Data center revenue and next-quarter guidance | Assess current demand and near-term shipment trends |
| Gross margin | Evaluate product-transition costs, competition, and pricing conditions |
| Inventory and purchase commitments | Assess supply commitments relative to expected demand |
| Accounts receivable and cash flow | Determine whether recognized revenue is converting into cash |
| Customer concentration | Evaluate dependence on individual cloud providers or operators |
| Investments, guarantees, and long-term contracts | Assess the contractual links between ecosystem financing and sales |
| Cloud provider capex composition | Separate buildings and power infrastructure from servers and accelerators |
Rising inventory may indicate oversupply or preparations for new product launches.
Higher receivables may simply reflect revenue growth. Receivables relative to sales and collection periods are more informative than a single quarter’s balance.
Assessment of the Nasdaq outlook should distinguish changes in earnings estimates, interest rates, credit conditions, and valuations rather than focus solely on individual share-price declines.
9. The Underlying Issue: Who Ultimately Pays for AI Investment?
Several connections may receive less attention in the headline debate.
① The same funding can appear across multiple AI transactions.
A supplier may invest in an AI company, which signs a cloud contract, prompting the cloud provider to purchase equipment. Simply adding these transactions together can overstate final demand.
Such arrangements do not inherently indicate financial distress or misconduct.
However, growth in cash payments from end customers outside the financing ecosystem requires separate assessment.
② Stable capex does not guarantee stable GPU budgets.
Higher grid-connection and construction costs can reduce funds available for servers and semiconductors even if total investment is unchanged.
Conversely, once facilities are completed, server purchases may represent a larger share of spending despite slower growth in total capex.
Total AI capex alone is therefore an incomplete basis for estimating Nvidia’s revenue.
③ Greater chip efficiency does not necessarily reduce total computing demand.
Lower resource requirements per task can reduce costs and support new services and additional usage.
Aggregate demand depends on whether resource savings per task outweigh growth in usage.
④ A decline in wafer area is not equivalent to a decline in revenue.
Changes in die size, process technology, yields, packaging, memory configuration, and selling prices can cause wafer requirements and corporate revenue to diverge.
The source’s wafer-area projections should not be interpreted directly as Nvidia revenue decline estimates.
⑤ Industry growth does not preclude falling share prices.
Equity prices respond to the gap between embedded expectations and actual performance, not simply to whether an industry grows.
Semiconductor investment analysis must assess both the sustainability of AI growth and the growth assumptions already reflected in valuations.
10. Conclusion: Monitor Increasing Investment Selectivity Rather Than Assume a Collapse
The available material is insufficient to establish that the AI investment cycle has ended.
If the reported forecast reductions are verified, however, they would justify reassessing long-term investment assumptions and financing conditions.
- Upside scenario: Improving AI service profitability and continued access to financing support further infrastructure investment.
- Base scenario: Investment continues to rise at a slower pace, with spending concentrated among large customers and higher-return projects.
- Downside scenario: Lower revenue expectations, tighter financing conditions, and project cancellations combine to pressure equipment orders.
The key question is not simply how much capital enters AI, but who earns a return on that capital and which contractual commitments support subsequent investment.
This framework treats Nvidia, proprietary AI chips, neocloud providers, and power infrastructure as businesses with distinct cash flows and risks rather than as a single investment theme.
< Summary >
- The reported SemiAnalysis forecast reductions require verification against the original report and its methodology.
- A downward revision from a previous forecast differs from a year-over-year investment decline.
- AI demand should be assessed through revenue, usage, pricing, profitability, and cash collection.
- Financing and power availability are critical variables in data center investment.
- Nvidia faces greater risk if slower market growth coincides with proprietary chip adoption, but competitiveness must be evaluated through total cost of ownership.
- Leadership claims, remote-access restrictions, and IPO schedules require confirmation from official sources.
- End-customer payment capacity and contractual certainty are central to investment assessment.
[Related Articles…]
*Source: [ 내일은 투자왕 – 김단테 ]
– AI Capex 성장 둔화? 초긍정적이던 Seminanalysis 너마저???
● Nvidia Meltdown, AI Bubble Shock
Assessing the Claim of a $1.9 Trillion Decline in Nvidia’s Market Capitalization: AI Investment, U.S. Equities, and the Semiconductor Outlook
Before focusing on Nvidia’s share price, investors should assess whether AI investment remains adequately funded and which companies are converting rising AI revenue into earnings.
This report examines the key issues in the supplied New York market briefing, Nvidia’s earnings indicators, implications for Korean semiconductor companies, and the assumptions underlying Wall Street’s optimism.
It also distinguishes AI industry growth from the sustainability of Nvidia’s profitability and considers whether data center restrictions could support replacement demand for certain semiconductors.
1. Distinguishing Market Analysis from Fact Verification
The briefing covers the U.S. technology-sector correction and uncertainty surrounding AI investment, but its central events and figures require verification.
Incorrect starting assumptions can materially alter investment conclusions.
| Item | Reason for Verification | Primary Sources |
|---|---|---|
| $1.9 trillion decline in Nvidia’s market capitalization | The comparison dates are unclear, and the reference to “since early December” is ambiguous relative to the publication date. | Share prices and shares outstanding at the relevant dates; exchange data |
| Jensen Huang’s departure and an interim CEO arrangement | This potentially material claim cannot be verified from the supplied material. | Nvidia investor relations announcements and relevant SEC filings |
| Anthropic IPO and SpaceX listing claims | Listing status, timing, and offering size have not been independently verified. | Registration statements, official company announcements, and exchange notices |
| Federal Reserve officials’ rate-hike comments and economic data | Potential transcription errors, statement context, and reporting periods require verification. | Official Federal Reserve, Bureau of Labor Statistics, and Census Bureau releases |
| JPMorgan and Morgan Stanley forecasts and price targets | Publication dates, forecast horizons, responsible research divisions, and underlying assumptions are unverified. | Original investment bank reports |
A decline in market capitalization does not represent an equivalent cash outflow from the company.
It reflects a lower market valuation of equity and must be distinguished from weaker operating cash flow or reduced financing capacity.
Any conversion into Korean won should specify both the dollar amount and the exchange rate used.
2. Market Conditions Described in the Briefing: AI Semiconductor Weakness and Defensive Resilience
The briefing describes semiconductor-led selling → broader weakness in large-cap technology → relative resilience in selected defensive sectors.
It combines early-session futures prices with later intraday prices. These changes should not be presented as closing returns.
- United States: The briefing highlights weakness in Nvidia, AMD, Broadcom, Micron, and other semiconductor stocks.
- Korea and Taiwan: It describes deteriorating sentiment spreading to AI supply-chain companies, including Samsung Electronics, SK hynix, and TSMC.
- Europe: It attributes smaller declines relative to U.S. technology stocks partly to differences in technology-sector exposure.
- Defensive sectors: Consumer staples and healthcare reportedly showed relative resilience.
- Other assets: The briefing also cites weaker Bitcoin and selected commodities, higher volatility, and lower U.S. Treasury yields.
If verified, these movements could indicate a reassessment of elevated valuations and investment payback prospects, rather than a rejection of AI’s technological utility.
Smaller declines in defensive stocks do not, by themselves, establish substantial capital inflows.
Sector fund flows, trading volumes, and market breadth are needed to substantiate a rotation thesis.
3. Why Treasury Yields and Inflation Affect AI-Related Equities
AI-related valuations often depend heavily on expected future earnings.
Higher Treasury yields can therefore pressure share prices even when current operating performance remains sound.
- Valuation pressure: Higher discount rates reduce the present value of future cash flows, even with unchanged growth expectations.
- Higher data center financing costs: Operators reliant on loans and corporate bonds face increased interest expenses.
- Stricter customer investment criteria: AI projects with long payback periods may face delayed approval or execution.
AI companies’ borrowing costs can rise even when Treasury yields decline modestly.
Corporate funding costs reflect both benchmark Treasury yields and credit spreads associated with issuer-specific risk.
Concerns about a cloud operator’s financial condition could widen its credit spread enough to offset lower Treasury yields.
Inflation and consumption data also require balanced interpretation.
Strong retail sales can support corporate revenue while reinforcing concerns about persistent inflation and restrictive interest rates.
Weaker consumption may ease tightening concerns but undermine earnings expectations.
4. The Critical Link in AI Investment: Purchasing Capacity, Not Just Demand
Demand for AI semiconductors does not necessarily imply the immediate financial capacity to purchase them.
This distinction is central to assessing the investment cycle.
AI infrastructure requires funding for GPUs, data center construction, power, networking, cooling, and working capital.
Supplier equity investments, bank lending, and long-term customer contracts can jointly accelerate investment deployment.
Weakness in any component can delay orders and revenue recognition even when underlying demand persists.
- Tighter financing conditions: Borrowing rates rise or collateral and guarantee requirements increase.
- Cloud investment adjustments: Operators postpone GPU orders or data center construction.
- Supply-chain timing changes: HBM, server, networking, and cooling equipment delivery schedules are revised.
- Semiconductor earnings effects: Orders may remain intact while revenue conversion and cash collection slow.
Equity investments, loan guarantees, purchase commitments, and proposed joint funds represent distinct financial arrangements.
The amounts cited in the briefing should not be aggregated as Nvidia’s direct cash expenditure or recognized debt.
Announced commitments must be distinguished from actual disbursements, and guarantee limits from realized loss exposure.
Even if a management change occurs, existing contracts do not automatically become invalid.
Contract continuity depends on contractual terms and legal obligations; the pace and terms of new transactions may be affected separately.
5. Seven Indicators to Monitor in Nvidia’s Earnings
The earnings date and presenters cited in the briefing require confirmation against the official schedule.
Beyond revenue and earnings-per-share surprises, investors should examine the following indicators.
| Indicator | Key Question |
|---|---|
| Data center revenue and guidance | Is growth supported by actual shipment increases, and can it continue into the next quarter? |
| Gross margin | How are product transition costs, competition, and pricing power affecting profitability? |
| Operating cash flow and accounts receivable | Is reported revenue converting into cash? |
| Customer mix and concentration | What proportion of sales comes from cash-rich hyperscalers versus customers dependent on external financing? |
| Equity investments, guarantees, and commitments | What do disclosures indicate about customer support, contractual terms, and contingent loss exposure? |
| Next-generation product availability | What are the official roadmap milestones and production and deployment readiness for products such as the Rubin family? |
| Export controls and addressable markets | How do covered products, effective dates, and exemptions affect revenue opportunities? |
If receivables grow faster than revenue while cash collection weakens, earnings quality warrants closer examination.
If customer usage, cash collection, and product competitiveness remain intact despite a share-price decline, valuation adjustment should be distinguished from business deterioration.
Strong cash generation is positive but does not independently establish that the shares are undervalued.
6. Interpreting JPMorgan and Morgan Stanley’s Optimism
The supplied briefing attributes a positive global equity outlook to Morgan Stanley and an emphasis on Nvidia’s cash generation to JPMorgan.
Because the original reports have not been verified, the following represents an interpretation of the investment arguments conveyed in the briefing.
Morgan Stanley-related argument: A correction can improve medium- to long-term investment appeal if corporate earnings continue to grow.
JPMorgan-related argument: Competition and uncertainty do not necessarily eliminate Nvidia’s profitability and cash generation in the near term.
Dividing the cited S&P 500 target of 8,700 by the cited EPS forecast of $420 implies a price-to-earnings multiple of approximately 20.7 times, assuming comparable reference periods.
This calculation illustrates the relationship between the supplied figures; it does not verify them as official forecasts.
A year-end 2027 target and a 12-month target represent different forecast horizons and should not be combined.
An index target can be decomposed into expected earnings × the valuation multiple investors are willing to pay.
Even with earnings growth, higher interest rates could compress multiples and limit equity returns.
The Nvidia PEG figure is ambiguous in the transcription and should not be quoted without verification. Price-target revisions also require confirmation against original reports and applicable stock-split adjustments.
Japanese wage and price growth, corporate governance improvements, European relative valuations, and AI adoption are relevant to geographic diversification.
However, lower multiples can reflect weaker growth prospects and sector composition rather than undervaluation.
7. AI Semiconductor Competition: Industry Growth and Nvidia’s Market Share Are Distinct
AI market expansion does not guarantee that Nvidia will grow at the same rate.
Alternatives such as AMD GPUs, Google TPUs, Amazon Trainium, and custom ASICs could distribute growth across more suppliers.
A declining market share does not necessarily imply declining revenue.
If the total market expands from 100 to 150 while a company’s share falls from 80% to 65%, its implied revenue rises from 80 to 97.5.
However, stronger price competition could reduce margins despite revenue growth.
A key limitation in the briefing is its direct comparison of historical revenue share with future contracted compute-capacity share.
Differences in contract scope, performance measurement, pricing, and deployment timing make these metrics unsuitable for describing a like-for-like collapse in market share.
CUDA’s competitive position also extends beyond the time required to port code.
- Maturity of libraries and development tools
- Reliability of large-scale distributed training and inference
- Networking and system integration
- Availability of skilled developers and operational support
- Incident response and total operating costs
AI coding tools may reduce switching costs, but the cited reduction from months to days requires verification of project scope and testing conditions.
Successfully running a model is distinct from reliably operating a large-scale commercial service.
8. Implications for Samsung Electronics, SK hynix, and TSMC
Nvidia’s share price alone is insufficient to assess the Korean semiconductor outlook.
Changes in Nvidia’s market share and aggregate AI memory demand do not necessarily move in the same direction.
- Samsung Electronics and SK hynix: AI accelerators beyond GPUs can generate HBM demand, but memory configurations and customer qualification remain critical.
- TSMC: Manufacturing for multiple AI chip designers may support customer diversification, subject to process technology, packaging requirements, and customer volumes.
- Equipment, substrates, and packaging: These segments are sensitive to actual capacity expansion and capital expenditure timing.
- Power, cooling, and networking: Demand depends on data center investment, deployment architecture, and changes in rack-level power density.
HBM suppliers should be assessed on shipment volumes, higher-value product mix, yields, customer qualification, and contract pricing.
Foreign investor selling should be evaluated alongside exchange rates, global risk reduction, and index rebalancing, rather than attributed solely to weaker company competitiveness.
9. In-Depth Analysis: Five Issues Beyond the Headlines
Headline coverage of share-price declines may underemphasize the following issues.
① Data center restrictions affect new construction and replacement demand differently.
Restrictions on new facilities could reduce equipment orders while increasing demand for more computing capacity within existing power and space limits.
However, newer chips may require greater rack-level power density and cooling capacity, limiting straightforward replacements.
The relevant investment criteria are performance per watt and total cost of ownership, including retrofit expenses, rather than peak performance alone.
② Low vacancy rates do not guarantee profitability for every data center operator.
Contracted space may differ from energized, operational capacity.
Power-connection delays, tenant credit quality, long-term contract pricing, and construction cost inflation require separate assessment.
③ Supplier investment in customers can accelerate growth while linking financial risks.
A supplier investing in a customer that subsequently purchases its equipment is not inherently improper.
However, evaluating sustainability requires distinguishing externally funded end-customer revenue from demand supported by financing within the ecosystem.
④ Lower computing costs can expand demand while weakening supplier pricing power.
Lower inference costs may increase AI service usage.
The extent to which higher usage translates into revenue and earnings growth for individual semiconductor suppliers remains a separate question.
⑤ AI infrastructure providers and AI adopters can have divergent equity performance.
Competition-driven reductions in computing costs may pressure semiconductor margins while benefiting software, financial services, and retail companies through cost savings.
Investment analysis should therefore consider both infrastructure suppliers and companies benefiting from productivity improvements.
10. Can Bitcoin Weakness Be Attributed to Large IPOs?
The briefing suggests that asset sales to fund participation in large IPOs may have contributed to Bitcoin weakness.
The listings and their timing must first be verified. Temporal coincidence does not establish causation.
- Spot ETF flows: Verify the size and duration of net outflows.
- Leveraged liquidations: Review futures open interest, funding rates, and liquidation volumes.
- Macroeconomic conditions: Dollar strength, interest rates, and risk aversion may be common drivers.
- IPO-related reallocations: Separate evidence is needed to establish that Bitcoin sale proceeds funded IPO subscriptions.
Large IPOs can trigger short-term portfolio reallocations, but they do not imply a permanent disappearance of capital from the broader market.
11. Integrating the Week’s Economic Data and Corporate Earnings
The release dates cited in the briefing require confirmation against official institutional and corporate calendars.
The analytical priority is to connect indicators rather than assess each release in isolation.
| Category | Indicators and Companies | Analytical Focus |
|---|---|---|
| Consumption | Retail sales; Walmart, Target, TJX, and Ross | Distinguish aggregate spending from shifts toward lower-priced products. |
| Housing | Housing starts and building permits; Home Depot and Lowe’s | Assess the effects of high interest rates on housing transactions and repair and remodeling demand. |
| Production | Industrial production and regional manufacturing indicators | Determine whether output growth reflects final demand or inventory accumulation. |
| Employment and inflation | Jobless claims, inflation expectations, and FOMC minutes | Assess monetary policy constraints arising from slower growth and persistent inflation. |
| Corporate IT investment | Nvidia and Palo Alto Networks | Distinguish AI infrastructure investment from essential IT spending, including cybersecurity. |
| Chinese and global consumption | Alibaba, PDD, NetEase, and Disney | Evaluate domestic demand, advertising, e-commerce, and entertainment separately. |
Although private consumption accounts for a large share of the U.S. economy, retail sales do not represent total consumer spending.
Personal consumption expenditures, including services, provide a broader assessment.
Strong discount-retailer results may indicate resilient demand or a shift toward cheaper shopping channels.
Average transaction values, unit volumes, customer traffic, and discretionary product trends help distinguish these explanations.
12. U.S. Equity Outlook: Three Scenarios
- Recovery scenario: AI customer investment and cash collection remain intact, interest-rate pressures ease, and earnings expectations stabilize.
- Selective growth scenario: AI demand expands, but competition and financing conditions widen performance differences across companies.
- Downside scenario: Investment delays, wider credit spreads, and downward earnings revisions occur simultaneously.
The scale of a share-price decline matters less than whether earnings expectations and financial resilience remain intact afterward.
A favorable industry outlook also does not make a stock attractive at any valuation.
Assessing Nvidia and Korean semiconductor companies requires separate evaluation of demand, competitiveness, cash flow, financing, and valuation.
< Summary >
- The reported market capitalization decline, management changes, IPO schedules, and investment bank forecasts require verification against official sources.
- AI demand may remain strong while financing and power constraints delay revenue conversion.
- Nvidia’s earnings should be assessed through margins, cash collection, and customer-support commitments as well as revenue growth.
- AI industry expansion is distinct from the sustainability of Nvidia’s market share and profitability.
- For Korean semiconductor companies, customer diversification, HBM competitiveness, and actual investment deployment are more informative than Nvidia’s share price alone.
- Data center restrictions and declining computing costs create different opportunities and risks across companies.
*Source: [ Maeil Business Newspaper ]
– 엔비디아 시총 1.9조달러 증발, 젠슨 황 없는 첫 실적 발표|증시 불안 속 JP모건·모건스탠리가 주목한 가능성|홍혜진의 뉴욕 브리핑