● Tesla, Soars, SpaceX, Deal, Shock
Tesla Shares Surge 9% in Two Days: What the SpaceX Exchange Ratio Increase From 2.52 to 2.74 Really Means
Tesla shares rose to $407.46, changing not only the company’s market valuation but also the negotiating dynamics of a hypothetical merger with SpaceX.
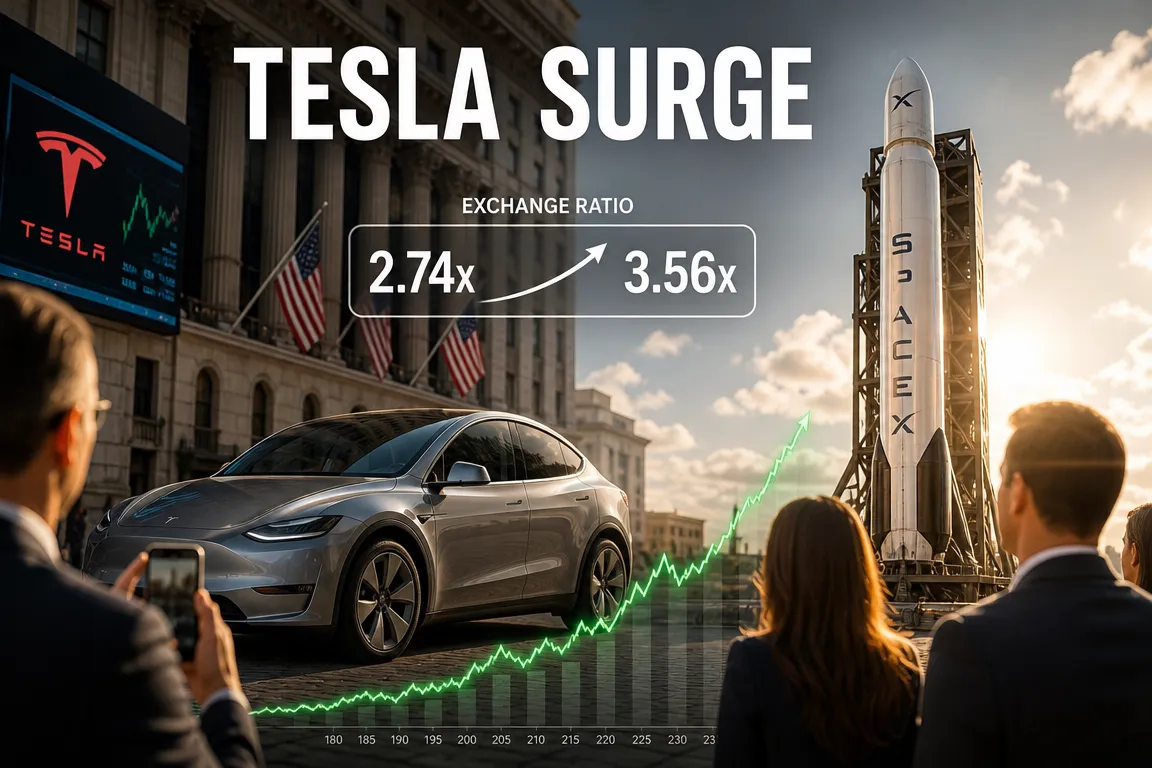
The relative value of one Tesla share increased from 2.52 to 2.74 SpaceX shares. With a 30% premium, the implied consideration would rise to approximately 3.56 SpaceX shares.
The rally also coincided with higher Wall Street price targets, increased Cybercab registrations, expanded robotaxi operations, expectations for an Optimus demonstration, and changes in the U.S. interest-rate outlook.
However, one distinction is critical.
A simple price ratio is not an actual merger exchange ratio, and SpaceX shares do not trade continuously on a public exchange.
This analysis should therefore be viewed as a scenario based on the prices and assumptions presented in the source, not as confirmation of a merger.
1. Factors Behind Tesla’s Gain of More Than 9% in Two Days
Tesla closed 4.04% higher at $407.46, according to the source.
The two-day cumulative gain exceeded 9%, representing an increase of approximately $35 per share.
For an investor holding 100 Tesla shares, the position’s value increased by approximately $3,500.
Assuming an exchange rate of KRW 1,340 per dollar, the gain would be approximately KRW 4.69 million.
According to the source, this was Tesla’s first close above $400 since July.
The rally cannot be attributed solely to third-quarter earnings.
Tesla reported third-quarter operating income of $718 million, but its current valuation reflects expectations for robotaxis, Optimus, and artificial intelligence more heavily than near-term automotive earnings.
- Barclays upgraded its rating and price target for Tesla.
- BNP Paribas and CLSA reportedly moderated their previously negative views.
- The proportion of analysts assigning Tesla a sell rating fell to its lowest level in approximately 11 years.
- Monday’s trading volume was approximately 47% above normal levels.
- A breakout above the technically significant $386 level may have attracted trend-following capital.
The rally appears to have been driven primarily by improving Wall Street sentiment and expectations for future businesses rather than current earnings growth.
2. What a $450 Price Target Means for Tesla Shareholders at $407
Barclays’ $450 price target is $42.54 above Tesla’s current price of $407.46.
This represents potential upside of approximately 10.4%.
| Category | Price | Difference From Current Price |
|---|---|---|
| Tesla current price | $407.46 | – |
| Barclays price target | $450.00 | Approximately 10.4% upside |
| Value with 20% premium | $488.95 | Additional $81.49 |
| Value with 30% premium | $529.70 | Additional $122.24 |
A $450 analyst price target and a 20% merger premium are not equivalent concepts.
A price target represents an analyst’s estimate of a stock’s value over a specified period.
A merger premium is additional consideration offered by an acquirer to complete a transaction.
If $450 represents a 20% increase from approximately $375, Tesla’s advance to $407 indicates that a significant portion of the anticipated upside has already been priced in.
This benefits Tesla shareholders in the short term, but it would also increase the transaction cost if SpaceX were required to offer an additional premium.
3. Why Tesla’s Relative Value Increased From 2.52 to 2.74 SpaceX Shares
The source used $148.58 as the reference price for SpaceX shares.
Dividing Tesla’s closing price of $407.46 by that reference price produces the following result:
$407.46 ÷ $148.58 = approximately 2.74 shares
On a simple price basis, one Tesla share is therefore equivalent to approximately 2.74 SpaceX shares.
If the previous ratio was 2.52, Tesla’s relative value increased by approximately 8.7%.
This change resulted from Tesla’s rally while the assumed SpaceX reference price remained largely unchanged.
| Assumption | Value of One Tesla Share | Required SpaceX Shares |
|---|---|---|
| No premium | $407.46 | Approximately 2.74 shares |
| 10% premium | $448.21 | Approximately 3.02 shares |
| 20% premium | $488.95 | Approximately 3.29 shares |
| 30% premium | $529.70 | Approximately 3.56 shares |
Applying a 30% premium values one Tesla share at approximately $529.70.
Dividing this amount by the $148.58 SpaceX reference price produces an exchange ratio of approximately 3.56 shares.
This is broadly consistent with the approximately 3.6 shares cited in the source.
As Tesla’s share price rises, the number of SpaceX shares required as consideration increases, potentially creating greater dilution for existing SpaceX shareholders.
4. Why a Higher Tesla Share Price Does Not Necessarily Support a Merger
For Tesla shareholders, a higher share price strengthens the basis for demanding more favorable transaction terms.
From the perspective of the overall transaction, however, the increase could make a merger more difficult to complete.
If SpaceX issued more shares to Tesla shareholders, the ownership percentages of existing SpaceX shareholders could decline.
A SpaceX special committee would be required to prioritize the interests of SpaceX shareholders.
A Tesla special committee would need to ensure that Tesla shareholders received adequate value and an appropriate premium.
Continued changes in the companies’ relative valuations would make it more difficult to establish an exchange ratio acceptable to both shareholder groups.
Gary Black of The Future Fund argued that if SpaceX trades at a lower earnings multiple than Tesla, a 15% to 20% premium might not materially increase the economic value received by Tesla shareholders.
Conversely, a premium that is too low could make Tesla shareholder approval difficult to secure.
A rising Tesla share price and an increased probability of completing a transaction are therefore separate issues.
5. The Key Distinction: A Price Ratio Is Not a Merger Exchange Ratio
The 2.74 ratio derived by dividing $407.46 by $148.58 is only a simple price comparison.
An actual stock exchange ratio would require analysis of several additional factors.
- Each company’s fully diluted share count must be included.
- Stock options, convertible securities, and employee equity awards must be reflected.
- Enterprise values must be compared after accounting for cash and debt.
- SpaceX’s private share classes and differences in voting rights must be assessed.
- Differences between preferred and common shareholder rights must be incorporated.
- Shareholder agreements and transfer restrictions must be reviewed.
- Tax treatment, accounting implications, and regulatory approvals must be evaluated.
- Potential conflicts of interest involving Elon Musk and the independence of special committees must be examined.
SpaceX shares do not trade daily on a public securities exchange.
If the $148.58 reference price originated from an internal transaction, private secondary market, tender offer, or specific valuation process, it may differ from the company’s effective market value.
The 2.74-share and 3.56-share calculations should therefore be treated as sensitivity analyses rather than definitive valuation benchmarks.
Until formal merger disclosures, board approvals, and special committee reports are released, the transaction itself should not be considered confirmed.
6. A Higher SpaceX Valuation Would Reduce the Exchange Ratio
The current calculation assumes that SpaceX’s reference price remains at $148.58.
If SpaceX’s value increases, fewer SpaceX shares would be required for each Tesla share.
Using Tesla’s implied value of $529.70 after a 30% premium, the results would be as follows:
| SpaceX Reference Price | Required Shares per Tesla Share |
|---|---|
| $148.58 | Approximately 3.56 shares |
| $200.00 | Approximately 2.65 shares |
| $300.00 | Approximately 1.77 shares |
| $500.00 | Approximately 1.06 shares |
The central issue is not Tesla’s share price alone, but how and when both companies are valued.
The outcome could differ materially depending on whether the transaction uses an average price over a specified period or an enterprise valuation provided by an independent adviser.
7. What 544 Cybercab Registrations and Robotaxi Expansion Indicate
According to the source, 1,051 vehicles were registered for Tesla robotaxi operations in Texas.
The total consisted of 544 Cybercabs and 507 Model Y vehicles.
The key development was that registrations of the purpose-built Cybercab, which has no steering wheel or pedals, exceeded Model Y registrations for the first time.
A total of 801 vehicles were reportedly added in one registration batch, while Cybercab registrations increased by approximately 200 in one week.
Tesla’s Houston robotaxi service area reportedly expanded approximately tenfold, from about 25 square miles to 254 square miles.
An area of 254 square miles is approximately 658 square kilometers, larger than the total area of Seoul.
However, modified Model Y vehicles remain the primary platform in Houston, while Cybercabs were reportedly limited to passenger operations in Austin.
Registration data indicate production and deployment readiness, but do not necessarily confirm authorization for fully commercial autonomous service.
The economic value of the robotaxi business should be assessed using paid ride volumes, vehicle utilization, accident rates, remote intervention frequency, and operating cost per mile.
8. Limitations in Comparing Tesla and Waymo Mileage
The source stated that Tesla’s driverless robotaxis traveled 438,000 miles in Austin during the week ending October 18.
This exceeded Waymo’s reported weekly Austin average of 406,000 miles.
However, the comparison periods and measurement methodologies may not be consistent.
Waymo’s figure represented a three-month second-quarter average, while Tesla’s figure covered a specific week or recent period.
It is also necessary to determine whether the data included both testing mileage and paid passenger operations.
The presence of safety personnel, the use of remote assistance, and the proportion of fully driverless mileage are also material factors.
Mileage alone is insufficient to conclude that Tesla has surpassed Waymo operationally.
Nevertheless, the apparent expansion in operating scale may support the long-term value of Tesla’s autonomous-driving business.
9. Cybercab’s Primary Challenge Has Shifted From Production to Operations
Lars Moravy, Tesla’s vice president of vehicle engineering, indicated that the production line operates so quickly that it does not need to run every day.
The source estimated Cybercab’s annual production capacity at more than 125,000 units.
Dividing that figure by 365 implies theoretical daily production of approximately 342 units.
The 544 registered Cybercabs could theoretically be produced in less than two days.
The principal constraint is no longer vehicle production but sustained urban operations.
- Employees reportedly still need to connect Cybercab charging equipment manually.
- Autonomous-driving authorization must be secured separately in each jurisdiction.
- Operating zones must be expanded incrementally.
- Cleaning, maintenance, charging, and incident-response systems must be established.
- Tesla must improve vehicle utilization while demonstrating safety.
A fleet of approximately 1,000 vehicles is unlikely to materially affect Tesla’s consolidated financial results.
For robotaxis to become financially significant, Tesla would need tens of thousands of vehicles, high utilization, and stable paid revenue.
10. Could Optimus Address Cybercab’s Charging Constraints?
Tesla has raised the possibility of using its Optimus humanoid robot to automate Cybercab charging.
Elon Musk referenced a future demonstration in which Optimus could assemble a precision watch while catching a baseball traveling at 100 miles per hour with its other hand.
He also cited more speculative examples involving chainsaw juggling and unicycle riding, which the market interpreted as indications of a next-generation demonstration.
According to the source, Tesla began operating an Optimus production line at its Fremont factory and produced its first production-quality robot.
Musk also indicated that an updated Optimus model could be presented within one or two months.
A proposed “Optimus Academy,” involving 10,000 to 20,000 robots in one location for task-data training, has also attracted investor attention.
However, external commercial deliveries of Optimus are not expected until late 2027, according to the source.
At present, Optimus remains driven more by expectations than by revenue.
A successful demonstration could support Tesla’s AI and robotics valuation, while disappointing results could pressure its elevated valuation.
11. What Tesla’s 159-Times Valuation Implies
According to an investment publication cited in the source, Tesla trades at approximately 159 times expected earnings for the next 12 months.
General Motors was valued at approximately six times earnings on the same basis.
The difference cannot be explained solely by automotive sales volume.
Tesla’s valuation includes expectations for robotaxis, full self-driving, Optimus, energy storage, and AI platforms.
Growth companies whose valuations depend heavily on distant cash flows are particularly sensitive to U.S. interest-rate expectations.
Higher rates reduce the present value of earnings expected further in the future.
Conversely, expectations for lower rates can reduce the discount rate applied to high-growth companies and support equity valuations.
Tesla’s elevated price-to-earnings ratio reflects substantial growth expectations but also increases sensitivity to operational or financial underperformance.
12. How Federal Reserve Policy and Oil Prices Affect Tesla
The source indicated that the market was pricing in an approximately 10% probability of an additional Federal Reserve rate increase.
Forward guidance regarding future tightening may be more important than the current policy rate.
Persistent inflation and more restrictive guidance would create pressure for companies such as Tesla, whose valuations depend heavily on future growth.
Conversely, a lower probability of additional tightening could support Tesla and other major technology stocks.
International oil prices were cited at approximately $100 per barrel.
Higher oil prices can increase internal-combustion vehicle operating costs and support electric-vehicle demand.
However, higher energy prices can also contribute to inflation and increase the probability of tighter monetary policy.
High oil prices may support electric-vehicle demand while creating an offsetting interest-rate risk for Tesla.
13. AI Financing by Large Technology Companies and Tesla’s Position
The source stated that Meta raised $37.5 billion through equity issuance and planned to raise up to an additional $60 billion.
It also indicated that third-quarter cash spending exceeded internally generated cash for the first time in a decade.
This illustrates the rapid increase in investment required for generative AI data centers, semiconductors, and power infrastructure.
AI-related capital expenditure plans remain central variables in the earnings outlooks for Microsoft, Alphabet, and Amazon.
By comparison, Tesla reportedly retained approximately $1.5 billion in cash after third-quarter capital expenditures.
This supports the argument that Tesla can finance robotaxi and robotics investments through internal cash generation rather than relying heavily on external financing.
However, a complete comparison requires consistent free-cash-flow methodologies and consideration of stock-based compensation and debt financing.
14. Strong Earnings Do Not Always Produce Share-Price Gains
Seagate reported revenue and earnings above market expectations but declined approximately 6% in after-hours trading, according to the source.
This illustrates that companies whose shares have already appreciated substantially may not benefit from results that merely exceed consensus estimates.
Maintaining an elevated valuation requires continued outperformance in both earnings and guidance.
The same principle applies to Tesla.
Tesla’s valuation already reflects substantial expectations for robotaxis and Optimus, increasing the potential for volatility if execution falls short.
15. Capital Gains Tax Issues in Overseas Stock Mergers
The source referenced a public petition requesting that capital gains tax arising when overseas shares are exchanged in a merger be deferred until the replacement shares are sold.
The petition had 14,206 participants, approximately 28% of its target, after gaining more than 5,000 participants in one day.
An overseas stock merger may be treated as a taxable disposal even when the investor receives no cash.
Tax treatment depends on the transaction structure, country of residence, stock exchange mechanism, and applicable domestic tax law.
If a merger proceeds, investors should assess not only the exchange ratio but also deemed-disposal treatment and the basis assigned to replacement shares.
Where tax is triggered, after-tax returns may be lower than the headline transaction premium suggests.
16. Key Events and Indicators for Tesla Investors
- Federal Reserve meetings: Monitor the probability of additional tightening and the direction of long-term interest rates.
- Fourth-quarter deliveries: Assess whether higher oil prices and improving electric-vehicle demand translate into sales.
- Robotaxi operating data: Review paid rides, utilization rates, accident rates, and intervention frequency.
- Cybercab deployment: Determine whether vehicle registrations convert into commercial operations.
- Optimus demonstrations: Distinguish controlled demonstrations from repeatable real-world tasks.
- SpaceX reference price: Monitor changes in private-market transaction prices and formal valuations.
- Official disclosures: Watch for board resolutions, special committee appointments, and shareholder voting schedules.
- U.S. Treasury yields: Track changes in the discount rate applied to Tesla’s long-term growth expectations.
17. The Central Investment Interpretation
Tesla’s share-price increase strengthened Tesla shareholders’ negotiating position while simultaneously increasing the potential transaction cost for SpaceX.
Comparing Tesla’s $407.46 share price with SpaceX’s assumed reference price of $148.58 produces a simple ratio of approximately 2.74 shares.
Applying a 30% premium increases the implied ratio to approximately 3.56 SpaceX shares.
However, this is a hypothetical relative-valuation scenario, not a confirmed merger exchange ratio.
Investors should focus not only on merger expectations but also on robotaxi revenue conversion, Optimus commercialization, AI investment efficiency, and interest-rate developments.
< Summary >
- Tesla closed at $407.46 after gaining more than 9% over two days.
- Using a SpaceX reference price of $148.58, one Tesla share is equivalent to approximately 2.74 SpaceX shares.
- With a 30% premium, the implied consideration rises to approximately 3.56 SpaceX shares per Tesla share.
- A higher Tesla share price strengthens Tesla shareholders’ negotiating position but increases potential dilution for SpaceX shareholders.
- A simple price ratio is not an actual merger exchange ratio, particularly because SpaceX is privately held.
- Cybercab’s primary constraints have shifted from production to charging, regulatory approval, and operating infrastructure.
- Optimus and robotaxis are central growth drivers, but expectations remain ahead of demonstrated revenue.
- Federal Reserve guidance and U.S. Treasury yields remain key short-term variables for Tesla’s elevated valuation.
- Until formal merger disclosures are released, the calculations should be treated as scenarios rather than confirmed transaction terms.
[Related Articles…]
- How Tesla Robotaxis and Optimus Could Reshape the Company’s Valuation
- SpaceX Valuation and Key Considerations for Private-Market Investors
*Source: [ 오늘의 테슬라 뉴스 ]
– 테슬라만 이틀 9%, 스페이스X는 제자리 — 합병 비율 2.52가 2.74로, $407 주주는?
● SK hynix Soars on HBM Boom, AI Surge
Two Drivers Behind SK Hynix’s Share Price Surge and the Outlook for the KOSPI and AI Semiconductors
SK Hynix’s share price surge was driven by more than a positive earnings result.
More significant than the earnings beat were indications that HBM supply constraints could continue through 2029 and the company’s large-scale investment plan.
Foreign capital also moved into AI hardware companies, including Samsung Electronics and Samsung Electro-Mechanics, strengthening the broader KOSPI’s upward momentum.
However, upcoming interest-rate decisions in the United States and earnings announcements from Microsoft, Alphabet, and Samsung Electronics could increase volatility. Forward guidance is likely to have a greater market impact than reported earnings.
1. First Driver of SK Hynix’s Share Price: Earnings Above Market Expectations
SK Hynix reported results that exceeded market expectations.
Semiconductor stocks generally respond to the difference between consensus expectations and actual results rather than to headline earnings alone.
Even strong earnings can trigger a decline if they fall short of expectations. A clear earnings beat, by contrast, can lead institutional and foreign investors to raise their forecasts.
The market reaction suggests that investors increasingly view SK Hynix’s earnings growth as structural, supported by expanding AI data center investment, rather than as a temporary improvement.
- Revenue and operating profit exceeded market expectations.
- A higher share of premium HBM products improved profitability.
- AI server products made a larger earnings contribution than conventional memory products.
- The probability of further upward earnings revisions increased.
However, the reported figures of KRW 104 trillion in revenue and KRW 83 trillion in operating profit may reflect errors in the reporting period, decimal placement, translation, or transcription.
In particular, KRW 83 trillion in operating profit would imply an unusually high operating margin. Investors should verify the figures using SK Hynix’s official investor relations materials and regulatory filings.
2. Second Driver: Indications That HBM Capacity Is Effectively Sold Through 2029
The market reacted strongly to indications that HBM production capacity may be effectively committed through 2029.
If supply volumes for approximately the next three years have already been discussed with customers or have a high degree of sales visibility, SK Hynix increasingly resembles a long-term AI infrastructure supplier rather than a conventional memory manufacturer.
HBM is high-bandwidth memory that processes large volumes of data at high speed alongside GPUs and AI accelerators.
As generative AI models expand, both GPU performance and the capacity and speed of connected memory must increase.
The HBM market outlook is therefore directly linked to Nvidia’s GPU shipments, capital expenditure by major technology companies, and the computing requirements of next-generation AI models.
- Greater earnings visibility: Long-term supply arrangements improve the predictability of future revenue and profit.
- Stronger pricing power: Supply constraints strengthen manufacturers’ negotiating position on pricing and product mix.
- Deeper customer relationships: Next-generation HBM requires joint validation with GPU and accelerator companies from the development stage.
- Higher barriers to entry: Competitors must simultaneously achieve competitive yields, thermal management, stacking, and packaging capabilities.
However, investors should distinguish among final contracts, long-term supply agreements, and customer demand forecasts when interpreting the term “sold out.”
Long-term semiconductor supply plans may be adjusted based on customer product schedules and changes in market demand.
3. Why the Additional KRW 60 Trillion Investment Plan Matters
SK Hynix was reported to have announced an additional investment of approximately KRW 60 trillion.
The investment scope and execution period require confirmation through official company disclosures. Nevertheless, the plan indicates that management expects sustained expansion in AI semiconductor demand rather than a temporary demand increase.
HBM capacity expansion requires more than additional production lines.
The entire supply chain must expand, including advanced DRAM processes, through-silicon vias, wafer stacking, testing, thermal management, and advanced packaging.
SK Hynix’s investment could therefore benefit semiconductor equipment, materials, packaging, substrate, and inspection-equipment suppliers.
Conversely, large-scale investment raises depreciation and cash expenditure. If HBM pricing or demand underperforms expectations, the investment could place pressure on profitability.
4. Why Foreign Investors Bought SK Hynix, Samsung Electronics, and Samsung Electro-Mechanics
A strong Nasdaq session often supports foreign capital inflows into major South Korean semiconductor stocks.
Global investors use the South Korean market as an alternative vehicle for exposure to the AI hardware supply chain.
When Nvidia and major US technology stocks rise, earnings expectations may also improve for South Korean companies involved in memory, components, substrates, camera modules, power systems, and semiconductor packaging.
SK Hynix is viewed as a direct beneficiary of demand for HBM and high-performance memory.
Samsung Electronics operates across memory, foundry services, advanced packaging, and mobile components, making the recovery of the AI semiconductor cycle particularly important to its outlook.
Samsung Electro-Mechanics may benefit from demand for premium multilayer ceramic capacitors used in AI servers and vehicles, as well as semiconductor package substrates.
If foreign buying expands beyond a small number of stocks to the broader AI hardware sector, it could provide additional support for the KOSPI.
5. Key Events Likely to Determine the Next Phase of Volatility
The recent share price increase does not eliminate near-term market risks.
The Federal Reserve’s interest-rate decision and earnings from Microsoft and Alphabet could affect both the AI investment cycle and global equity valuations.
Samsung Electronics’ earnings will also provide important evidence on the semiconductor cycle and the competitive structure of the HBM market.
Investors should verify the Korean Standard Time schedules for the Federal Open Market Committee meeting and each company’s earnings announcement.
6. Factors to Monitor in the US Interest-Rate Decision
The policy decision alone may be less important than the Federal Reserve chair’s comments and the projected path of interest rates.
- Whether inflationary pressure is accelerating again
- Whether the possibility of future rate cuts remains intact
- How the Federal Reserve assesses labor-market weakness
- Whether quantitative tightening or liquidity policy will change
- Whether AI investment and rising asset prices are viewed as financial risks
If interest rates remain elevated longer than expected, the present value of future earnings could decline, pressuring technology and growth-stock valuations.
A more accommodative policy signal could support additional capital inflows into the Nasdaq and major South Korean semiconductor stocks.
7. Key Metrics in Microsoft and Alphabet Earnings
Investors should prioritize AI data center investment and cloud growth over headline revenue when reviewing Microsoft and Alphabet’s results.
Continued capital expenditure growth would support demand for GPUs, HBM, networking equipment, and power infrastructure.
- Microsoft Azure growth and the contribution from AI services
- Google Cloud revenue and operating margin
- Data center capital expenditure and forward investment guidance
- The pace at which AI services are converting into revenue
- Whether power and GPU shortages are identified as growth constraints
If capital expenditure rises while AI revenue and monetization fall short of expectations, investors may interpret the spending as excessive.
The key issue is therefore not only whether AI investment is increasing, but also how rapidly it generates revenue and cash flow.
8. Why Samsung Electronics’ Earnings Matter to SK Hynix
Samsung Electronics’ results provide information on global memory supply and HBM competition, not only on the company’s standalone performance.
If Samsung accelerates HBM customer qualification and supply expansion, it would confirm broader market growth but could increase pressure on SK Hynix’s market share and pricing power.
If Samsung’s HBM expansion remains delayed, SK Hynix’s market leadership and supply-scarcity premium could persist longer.
- HBM revenue growth and customer diversification
- Development and qualification schedules for next-generation HBM
- DRAM and NAND pricing outlook
- Potential reduction in foundry losses
- Semiconductor capital expenditure and production changes
9. The Most Important Issue Often Overlooked in Other Coverage
The central issue is not merely that HBM is selling rapidly, but that customers are reserving production capacity years in advance.
This indicates that competition in the AI semiconductor industry is shifting from product sales toward advance capacity reservation.
To expand AI services, major technology companies must secure not only GPUs but also HBM, advanced packaging, networking capacity, and power infrastructure.
AI data center bottlenecks therefore depend on the simultaneous expansion of the entire supply chain rather than on the availability of a single semiconductor product.
If SK Hynix has demand visibility through 2029, its competitive advantage lies not only in production volume but also in its ability to co-develop next-generation products with customers and coordinate long-term supply schedules.
Large-scale investment will not immediately resolve supply constraints.
Even after facilities and equipment are installed, manufacturers require substantial time to stabilize yields and complete customer qualification.
Leading suppliers may maintain elevated profitability while shortages persist. However, pricing pressure could return if competitors’ expanded capacity enters the market simultaneously in later years.
10. Upside Scenario for Investors
- Major technology companies continue expanding AI data center capital expenditure.
- HBM supply constraints persist longer than expected.
- Next-generation product yields and customer qualifications progress as planned.
- A recovery in conventional DRAM pricing broadens earnings growth.
- US monetary policy becomes more accommodative, supporting foreign inflows into the KOSPI.
Under this scenario, capital rotation could extend beyond SK Hynix to equipment, materials, packaging, substrate, and power-infrastructure companies.
11. Key Downside Risks
- The Federal Reserve may provide a more restrictive interest-rate outlook than expected.
- Growth in AI capital expenditure by major technology companies may slow.
- AI service monetization may fail to keep pace with investment.
- Competitors’ HBM capacity expansion may pressure pricing and market share.
- Large-scale investment may increase depreciation and cash expenditure.
- Profit-taking and foreign selling in index futures may follow the short-term rally.
Immediately after an earnings announcement, positive developments may already be reflected in the share price.
Rather than pursuing the stock solely on strong reported earnings, investors should assess whether forward earnings estimates are being revised upward, foreign cash-equity buying is continuing, and HBM pricing remains stable.
12. Key Indicators to Monitor
- SK Hynix’s HBM revenue share and operating margin
- Customer qualification schedules for HBM3E and next-generation HBM products
- Shipment forecasts from Nvidia and major AI accelerator companies
- Capital expenditure guidance from Microsoft, Alphabet, Amazon, and Meta
- DRAM contract prices and inventory levels
- Foreign net buying in KOSPI cash equities and futures
- The KRW-USD exchange rate and US Treasury yields
- SK Hynix’s capital expenditure and free cash flow
< Summary >
The primary drivers of SK Hynix’s share price surge were earnings above market expectations and visibility into HBM demand potentially extending through 2029.
The large-scale investment plan signals confidence in the long-term growth of the AI memory market, although the reported investment and earnings figures should be verified through official investor relations materials.
Foreign buying has expanded from SK Hynix to other AI hardware companies, including Samsung Electronics and Samsung Electro-Mechanics.
The next market direction will likely depend on US monetary policy, data center investment by major technology companies, and the pace of Samsung Electronics’ HBM supply expansion.
Investors should monitor HBM pricing, customer qualification, returns on capital expenditure, and foreign capital flows rather than pursuing the stock solely on short-term momentum.
[Related Articles…]
*Source: [ 내일은 투자왕 – 김단테 ]
– 하이닉스 폭등시킨 ‘2가지’ #하이닉스 #코스피 #실적발표