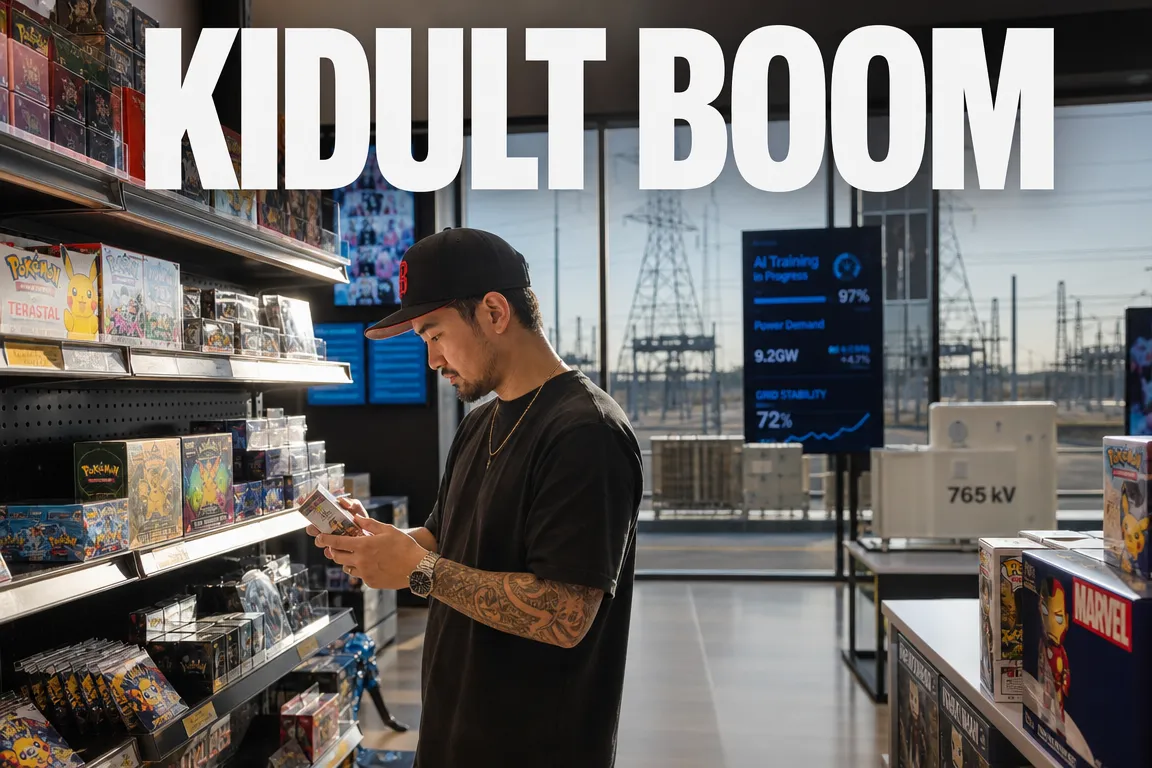
● Kidult Boom, Toy Stocks Soar, IP Power Shifts
How the Kidult Economy Is Reshaping Toy Companies’ Earnings and Valuations: Hasbro, Pokemon, and Bandai Namco
Adult spending on toys is no longer a temporary consumer trend.
Trading cards, figures, and character merchandise are growing faster than traditional toys, changing the revenue mix and profitability of major toy companies.
This report examines three drivers of the kidult market, Hasbro’s business transformation, and the potential beneficiaries among Pokemon-related companies, Bandai Namco, and Nintendo.
The analysis focuses on IP ownership, recurring purchase models, and operating profit contribution rather than headline revenue growth.
It also considers the market environment ahead of the 2026 U.S. midterm elections, consumer polarization, and the impact of AI adoption on physical collectibles.
1. Kidults Have Become a Core Consumer Segment in the Toy Market
The term “kidult” combines “kid” and “adult.”
It refers to adults purchasing and collecting cards, figures, dolls, building sets, and character merchandise for themselves rather than for children.
The toy industry was traditionally considered highly seasonal, with demand concentrated around Christmas and the year-end holiday period.
Adult collectors, however, make recurring purchases throughout the year in response to product launches, limited editions, new characters, and collaboration events.
This shift is improving revenue stability and changing how toy companies are valued.
- Children’s toys are highly exposed to birth rates and year-end gift demand.
- Kidult products are driven by fandom and collecting behavior.
- Limited editions and scarcity encourage repeat purchases.
- Companies can use the same IP to launch recurring card and merchandise releases.
- Popular products can generate active secondary markets.
U.S. market data cited in the source indicates that recent toy-market growth has been led by trading cards, collectibles, licensed products, and character merchandise rather than traditional children’s toys.
U.S. toy sales were also reported to have reached one of their strongest levels in six years.
Individual statistics may vary depending on the research provider, survey period, and product classification.
The key issue is not simply that the toy market is growing, but that growth is shifting from children’s toys toward adult-oriented collectibles.
2. Pokemon Cards Compete with K-Pop Photo Cards in South Korea
Kidult consumption in South Korea is expanding through online marketplaces, specialty retailers, and offline pop-up stores.
Pokemon cards and K-pop idol photo cards are among the most prominent product categories.
Data cited in the source showed Pokemon cards accounting for 47.1% of transactions, exceeding the share of K-pop cards.
Consumers in their 30s represented 34.4% of total spending, while consumers in their 20s accounted for 40.2% of purchase frequency.
These figures suggest that the core customer base consists primarily of consumers in their 20s and 30s with disposable income rather than children.
These figures should not be interpreted as nationwide market shares without confirming whether they represent a specific platform or the broader retail market.
Investors should assess transaction growth, buyer demographics, repurchase rates, and average spending alongside market-share estimates.
2026 marks the 30th anniversary of the Pokemon franchise.
Anniversary editions and limited releases could generate a short-term increase in transaction volume.
However, demand after the anniversary cycle will be a more important indicator of structural growth.
Investors should distinguish temporary anniversary effects from sustained expansion in the kidult market.
3. Stress Relief Is a Primary Driver of Adult Toy Purchases
The first major driver of kidult consumption is self-care.
A survey cited in the source found that 52% of Americans and 66% of millennials viewed kidult activities as a form of self-care and stress relief.
A significant share of millennial respondents preferred purchasing toys or merchandise they enjoyed over paying for more expensive counseling services.
The survey also reported that 74% of respondents believed play provided hope when the broader environment felt burdensome.
High counseling and healthcare costs in the United States may make hobbies a relatively accessible form of emotional relief.
Assembling figures, organizing cards, and purchasing preferred merchandise can provide a temporary break from daily stress.
This pattern resembles small, discretionary purchases intended to provide immediate satisfaction.
Housing costs and asset-price inflation are additional economic factors.
As the average age of first-time homebuyers rises in the United States and South Korea, younger consumers may view homeownership as increasingly difficult to achieve through long-term savings.
A home purchase requiring substantial capital may appear distant, while a collectible costing approximately $40 to $80 provides immediate utility.
The source reported that 51% of millennials might choose spending on kidult products over additional savings.
This trend creates opportunities for consumer companies but may also reflect broader macroeconomic pressure.
When confidence in long-term asset accumulation weakens, consumers may prioritize smaller, immediate rewards over distant financial goals.
The expansion of the kidult market can therefore be viewed as a product of both fandom economics and widening housing and wealth disparities.
4. Blind Boxes Combine Collecting Behavior with Probability-Based Consumption
A blind box contains a randomly selected character that remains unknown until the package is opened.
Consumers may purchase multiple units to obtain a preferred item.
This model can increase both purchase frequency and average transaction value.
Blind boxes sell not only the product but also the anticipation associated with opening it.
Rare characters and limited editions can raise secondary-market prices and encourage social-media sharing.
This content can then attract additional buyers, creating a recurring demand cycle.
Investors should also monitor the regulatory risks associated with probability-based products.
Consumer-protection rules may tighten in response to concerns involving minors, probability disclosure, and excessive repeat purchases.
High repurchase rates should therefore be evaluated alongside brand trust and regulatory exposure.
5. Nostalgia Is the Second Growth Driver
Many of the strongest franchises in the kidult market originated in the 1990s and 2000s.
Examples include Pokemon, Magic: The Gathering, Dragon Ball, One Piece, Star Wars, and Marvel.
Consumers who engaged with these franchises during childhood now have adult incomes and purchasing power.
A survey cited in the source found that 87% of millennials felt stronger attachment to brands associated with childhood memories.
Approximately 46% identified nostalgia as a direct reason for purchasing related products.
Some consumers also buy products they could not afford during childhood.
This pattern extends beyond toys.
Music remakes and reissues, anniversary projects by long-running groups, remastered games, and film sequels follow a similar model.
Companies are monetizing content that succeeded 20 to 30 years ago through modern technology and distribution channels.
Reactivating an established franchise generally carries less risk than developing unproven IP because the audience already exists.
Nostalgia is therefore both an emotional driver and an economic asset that can reduce customer-acquisition costs.
6. Digital Fatigue in the AI Era Is the Third Driver
The third factor supporting kidult consumption is digital detoxification.
According to the source, 68% of Americans collect at least one category of physical products, including toys, figures, and cards.
Approximately 84% reported greater satisfaction from owning physical products than digital goods.
Another 80% preferred real-world experiences to screen-based activities, while 75% said physical collecting helped reduce digital fatigue.
In addition, 79% said physical collections made them feel more connected to the real world.
As generative AI, robotics, digital assets, and online content become more prevalent, the perceived value of tangible products may increase.
In an environment where images and videos can be generated at scale, a limited-edition physical item can provide authenticity and a stronger sense of ownership.
AI adoption may therefore support certain physical-product categories rather than displacing them entirely.
Accelerating digital transformation may also increase demand for analog experiences and physical ownership.
The kidult market could become an indirect beneficiary of digital fatigue rather than an industry left behind by technological development.
7. Hasbro Is No Longer Only a Traditional Toy Company
Hasbro is traditionally known for board games, action figures, and children’s toys.
Its current valuation, however, increasingly depends on Wizards of the Coast.
Wizards of the Coast owns major franchises including Magic: The Gathering and Dungeons & Dragons.
Traditional toys are exposed to raw-material costs, manufacturing expenses, dependence on Chinese production, logistics costs, and tariffs.
Forecasting errors can result in discounting, inventory write-downs, and significant margin pressure.
Trading cards generally have lower manufacturing costs and can command premium prices based on scarcity, game utility, and fandom.
Recurring expansion sets built around the same IP also support repeat revenue.
The source stated that card-game-related operations account for approximately 70% of Hasbro’s profit.
This should not be interpreted as 70% of total revenue.
Wizards of the Coast contributes a substantially larger share of operating profit than of consolidated sales.
Hasbro should therefore be assessed using Wizards’ revenue growth and operating margin separately from traditional toy volumes.
The source reported that Hasbro shares had gained approximately 43% year to date.
The exact return depends on the measurement date and should be verified against market data and earnings-release dates.
The principal valuation driver has been Hasbro’s repositioning as a higher-margin gaming and IP company rather than a simple recovery in toy sales.
8. Why Trading Card Games Can Generate High Margins
- Low unit production costs: Material and assembly costs are generally lower than for plastic toys.
- High willingness to pay: Pricing reflects scarcity and game utility rather than paper costs.
- Recurring releases: New expansion sets can be launched on a regular schedule.
- Network effects: A larger user base supports tournaments, communities, and secondary-market activity.
- Digital expansion: Physical cards can be integrated with online games and platforms.
- IP collaborations: Film, gaming, and character franchises can be converted into card products.
The economics depend on more than low production costs.
Game rules and active communities retain consumers within the ecosystem.
Trading cards with functional gameplay generally have stronger long-term revenue potential than products designed solely for collection.
Excessive product releases can nevertheless create consumer fatigue.
Oversupply may reduce scarcity and weaken secondary-market prices for existing collections.
A higher release frequency is therefore not automatically positive.
9. Potential Beneficiaries and Company-Specific Constraints
Hasbro
Hasbro is transitioning from a traditional toy manufacturer toward a higher-margin IP business supported by Magic: The Gathering and Dungeons & Dragons.
Key indicators include Wizards’ revenue growth, operating margin, product reception, and inventory levels.
Bandai Namco
Bandai Namco operates across games, cards, model kits, and figures using global franchises including Dragon Ball, One Piece, and Gundam.
Its ability to extend a single franchise across multiple products and media formats is a competitive advantage.
Key earnings variables include the Japanese yen, international sales, and the performance of new game releases.
Mattel
Mattel owns major brands including Barbie and Hot Wheels, but not every established franchise benefits equally from kidult-market growth.
Investors should assess whether merchandise demand remains durable after major content releases.
Strong brand recognition does not necessarily translate into sustained profit growth.
Nintendo
Nintendo has equity and commercial ties to Pokemon, but Pokemon card growth does not determine its consolidated earnings.
Nintendo’s valuation is more sensitive to console cycles, game launches, and hardware adoption.
It should not be treated as a pure-play beneficiary of Pokemon card demand.
The Pokemon Company
The Pokemon business structure involves Nintendo, Game Freak, and Creatures.
Public-market investors cannot invest directly in The Pokemon Company as an independent listed entity.
Any attempt to link Pokemon demand to listed companies should account for the actual allocation of revenue and profit among stakeholders.
10. Key Factors Frequently Overlooked by the Market
First, the primary beneficiaries of the kidult market are companies that control IP and distribution rather than manufacturers alone.
Manufacturers bear raw-material, labor, and tariff costs, while IP owners can generate licensing income.
Investors should determine which company captures the largest share of operating profit from incremental sales.
Second, the core assets of a trading card game are its rules and community, not the physical cards.
Products supported by organized play, tournaments, and active communities are better positioned to generate repeat purchases and long-term customer retention.
Third, rising secondary-market prices can support demand but also signal speculative risk.
If resale prices increase too rapidly, speculative buyers may displace end users.
A subsequent price correction could weaken both new-product demand and collector confidence.
Fourth, declining birth rates do not necessarily imply the decline of the toy industry.
Adult consumers with stronger purchasing power may offset a shrinking child population.
However, demand is likely to concentrate among companies that own franchises with established adult fan bases.
Fifth, broader AI adoption could increase the scarcity premium attached to physical goods.
As digital content becomes easier to reproduce, official authentication, limited supply, and physical ownership can become stronger differentiators.
Products combining physical cards with digital authentication may also expand over time.
11. U.S. Midterm Elections and Investment Variables
Policy uncertainty and short-term market volatility may increase around the 2026 U.S. midterm elections.
The source presented a personal preference for maintaining liquidity before the election.
Election timing alone, however, is not a sufficient basis for investment decisions.
Investors evaluating U.S.-listed kidult-related companies should consider the following factors:
- Compare reported earnings with market expectations.
- Monitor changes to annual management guidance.
- Separate revenue and operating profit for traditional toys and card-game operations.
- Determine whether inventory growth exceeds revenue growth.
- Assess dependence on Chinese production and exposure to U.S. tariffs.
- Compare reliance on new IP with the reuse of established franchises.
- Evaluate whether forward valuation multiples already reflect optimistic growth assumptions.
In an uncertain global economy, consumers may be unable to increase spending across all categories.
They may instead reduce general living expenses while concentrating discretionary spending on preferred fandom products.
Core-fan loyalty and repeat-purchase behavior may therefore be more relevant than aggregate consumer-spending trends.
12. Risks Associated with Kidult-Related Equities
- Trend reversal: Demand for specific characters and card games can weaken rapidly.
- Oversupply: Excessive limited-edition releases can undermine scarcity.
- Inventory exposure: Forecasting errors in traditional toys can result in significant discounting.
- License expiration: Revenue can decline sharply when major IP agreements end.
- Regulatory risk: Blind boxes and probability-based products may face stronger consumer-protection rules.
- Currency and tariffs: Global production and sales structures create exposure to exchange rates and trade policy.
- Elevated valuation: Strong industry growth may not generate attractive returns if expectations are already reflected in the share price.
Growth in the kidult market does not automatically make every related company an attractive investment.
Industry growth, company market share, profitability, and valuation should be assessed separately.
This report is intended for industry and corporate analysis and does not constitute a recommendation to buy or sell any security.
< Summary >
Kidults have evolved from a secondary consumer segment into a core customer base that supports recurring purchases throughout the year.
Key growth drivers include stress relief, housing affordability constraints, childhood nostalgia, and digital fatigue.
Hasbro’s central transformation is the rising profit contribution of its high-margin Magic: The Gathering and Wizards of the Coast operations relative to traditional toys.
Bandai Namco benefits from strong character IP, but ownership of established brands does not guarantee equal benefits for companies such as Mattel and Nintendo.
Investors should prioritize IP ownership, operating margins, recurring purchase models, inventory exposure, and licensing risk over headline revenue growth.
As digital products proliferate in the AI era, physical collectibles may command a higher premium based on scarcity, authenticity, and tangible ownership.
[Related Articles…]
*Source: [ 소수몽키 ]
– 큰 손이 된 키덜트 덕에 주식도 부활? 장난감 사는 어른 시대의 수혜주들
● AI Power Crunch, Transformers First, Big Tech Rush
AI Data Center Power Shortages: Why Big Tech Is Securing Transformers First
The next bottleneck for the AI industry is not GPUs, but electricity.
Data center buildings can be completed within two to three years, but commercial operations may take more than five years when grid permitting and extra-high-voltage transformer procurement are included.
This timing gap is prompting companies such as OpenAI, Amazon, Google, Oracle, and xAI to secure transformers and switchgear directly rather than wait for utilities.
This report examines the causes of AI data center power shortages, the strategic importance of 765 kV transformers, the growth potential of on-site generation, the competitive positioning of Korean electrical equipment manufacturers, and key investment risks.
Two frequently overlooked factors are that on-site generation and the conventional grid are complementary rather than competitive, and that order-to-revenue conversion periods vary significantly by company.
Key Development | Power Infrastructure Takes Longer to Build Than AI Data Centers
AI data centers cannot begin operating immediately after server racks and GPUs are installed.
Reliable operations require generation capacity, transmission networks, substations, extra-high-voltage transformers, circuit breakers, switchgear, and power cables.
Data center construction can generally be completed within two to three years, while large transformers alone may require approximately two years for production and delivery.
Including site selection, transmission-line design, negotiations with state and local governments, environmental reviews, and grid-connection approvals, the full process can exceed five years.
This creates a structural mismatch between the expansion of AI data centers and the pace of grid investment.
GPU supply can be increased through additional manufacturing capacity, but transmission constraints cannot be resolved through factory expansion alone.
Grid projects also require community consent, land acquisition, regulatory approvals, and utility capital expenditure.
As a result, the focus of AI infrastructure competition is shifting from semiconductor procurement to power availability.
Three Drivers of AI Data Center Power Shortages
First, AI computing density is rising rapidly.
Generative AI and large language models consume substantially more electricity than conventional cloud services.
Large-scale GPU clusters increase demand not only from servers but also from cooling systems and networking equipment.
Second, the U.S. power grid is aging.
The U.S. electrical equipment market is facing simultaneous demand from replacement of aging infrastructure and construction of new AI data centers.
This is increasingly a structural expansion in electricity demand rather than a conventional replacement cycle.
Third, power plants and transmission networks have long development periods.
Nuclear plants and large gas-fired facilities can supply substantial power, but site acquisition, permitting, construction, and commissioning require significant time.
Big Tech companies risk delaying data center operations if they wait exclusively for the most efficient long-term generation solutions.
Why Big Tech Is Purchasing Transformers Directly
Regional utilities have traditionally been the primary customers for electrical equipment in the United States.
More recently, power producers, engineering, procurement, and construction companies, on-site generation providers, and Big Tech companies have emerged as direct purchasers.
This does not mean that Big Tech companies intend to install transformers or construct transmission networks independently.
Instead, they may procure long-lead-time equipment in advance and provide it to utilities such as AEP, Duke Energy, and Dominion Energy or to construction partners.
By funding part of the required infrastructure, Big Tech can accelerate grid connections for its data centers.
Utilities can also reduce the burden of large capital expenditures, aligning the interests of both parties.
Direct transformer procurement is therefore a strategy to purchase earlier access to operational power capacity.
Why OpenAI’s Extra-High-Voltage Transformer Procurement Matters
The source material states that Hyosung Heavy Industries secured approximately KRW 380 billion in contracts related to 765 kV and 345 kV transformers in September.
It also suggests that approximately KRW 230 billion of 765 kV equipment for a project in Ohio was associated with a direct order from OpenAI.
Because the identification of OpenAI as the end customer was based on industry commentary, investors should verify the relevant regulatory filings and official company disclosures.
The broader significance is that a large language model developer may be directly participating in the power infrastructure supply chain.
Big Tech AI investment, previously concentrated on GPUs, servers, and data center buildings, may increasingly extend to transformers, substations, and transmission infrastructure.
The source also refers to approximately KRW 1 trillion of potential volume associated with HD Hyundai Electric in July.
However, the transaction was characterized as a reservation of manufacturing capacity rather than a confirmed purchase order.
Production-slot reservations may serve as a leading indicator of demand, but they should not be treated as finalized contracts.
Why 765 kV Transformers Are Scarce
Higher transmission voltage reduces the current required to deliver the same amount of power and lowers transmission losses.
For long-distance connections between large generation assets and hyperscale data centers, 765 kV systems may be more efficient than 345 kV or 550 kV systems.
However, only a limited number of manufacturers can produce 765 kV transformers.
Hyosung Heavy Industries and HD Hyundai Electric are leading Korean suppliers, while the source estimates that only about five manufacturers worldwide have relevant production capabilities.
A single 765 kV transformer can cost more than KRW 20 billion.
These systems are individually engineered according to voltage, capacity, installation environment, and grid requirements, making standardized mass production difficult.
Capacity expansion takes time, while skilled personnel and testing facilities cannot be added quickly.
If AI data center demand continues to grow, extra-high-voltage transformers could become strategically constrained infrastructure assets rather than conventional cyclical products.
On-Site Generation Emerges as Grid Connections Are Delayed
On-site generation involves installing small-scale power facilities within or near a data center site.
It allows operators to produce part of their required electricity without waiting for full connection to the conventional transmission grid.
Representative technologies include Bloom Energy’s solid oxide fuel cells and GE-affiliated gas turbine solutions.
Companies such as Oracle, Google, and xAI are evaluating on-site generation primarily because it can be deployed faster than large centralized power projects.
Its advantage is not necessarily superior generation efficiency, but the ability to begin data center operations sooner.
Advantages and Limitations of On-Site Generation
The principal advantage is deployment speed.
Power supply can be expanded in stages without waiting for large-scale transmission upgrades.
Modular systems can also be added in line with server capacity expansion.
The principal disadvantages are scale and cost.
The source states that one Bloom Energy solid oxide fuel cell unit produces several hundred kilowatts, potentially requiring approximately 60 units to supply 20 MW.
Gas turbines may range from approximately 30 MW to 200 MW, requiring multiple units to approach the output of centralized power plants exceeding 1 GW.
Additional units increase initial capital expenditure and maintenance requirements.
On-site systems may also have shorter replacement cycles and remain exposed to fuel availability and carbon-emission regulations.
On-site generation should therefore not be viewed as a complete long-term substitute for the conventional grid.
On-Site Generation and Grid Investment Are Complementary
A recurring market question is whether growth in on-site generation will reduce demand for transformers and transmission infrastructure.
The two markets are more likely to expand together than displace each other.
On-site generation primarily serves as a near-term bridge that allows data centers to begin operating sooner.
The conventional grid remains the core infrastructure for stable, long-term delivery of large-scale electricity.
Given the pace of data center demand growth, operators may deploy on-site generation while transmission networks and substations are developed in parallel.
On-site facilities also require transformers, switchgear, circuit breakers, and power-control systems.
Accordingly, distributed generation does not eliminate demand for electrical equipment.
Competitive Positioning of Korean Electrical Equipment Manufacturers
Hyosung Heavy Industries is positioned around extra-high-voltage transformers and expanded U.S. production.
The company is regarded as a competitive supplier of 765 kV transformers.
Expansion of its Memphis facility is an important factor supporting increased local production capacity.
The source suggests that Hyosung Heavy Industries could exceed HD Hyundai Electric’s U.S. production scale around 2029.
However, one-time construction costs and delayed revenue recognition may increase quarterly earnings volatility.
HD Hyundai Electric benefits from an established U.S. manufacturing base.
Its Alabama facility has enabled the company to respond early to North American grid replacement demand.
However, its future capacity growth rate may be lower than that of Hyosung Heavy Industries.
Current production scale and future capacity growth should be assessed separately.
LS ELECTRIC is expanding rapidly in data center distribution equipment.
Although LS ELECTRIC also manufactures extra-high-voltage transformers, its primary competitive strengths are switchboards, circuit breakers, and switchgear.
Switchgear distributes and controls incoming electricity across data center zones and equipment.
Multiple units are required for each data center building, creating potential for recurring orders as new facilities are developed.
Distribution equipment is less exposed to transmission permitting and typically has a shorter delivery period of approximately three to six months, allowing orders to convert into revenue more quickly.
The source refers to an Amazon-related contract of approximately KRW 188 billion and an increase in direct orders from Big Tech customers.
Sanil Electric is exposed to specialty transformers and on-site generation.
The company primarily manufactures specialty transformers in the 30-40 kV medium-voltage range.
It supplies customized transformers for inverters and power-conversion systems to global electrical equipment companies including GE, Eaton, and Siemens.
Historically, renewable energy represented a large share of demand, but orders associated with on-site generation providers such as Bloom Energy have reportedly increased.
Iljin Electric’s key variable is expansion of extra-high-voltage transformer capacity.
Iljin Electric produces 154 kV and 345 kV transformers, with capabilities extending to 550 kV.
Its product portfolio differs from those of Hyosung Heavy Industries and HD Hyundai Electric, which compete in the 765 kV segment.
Future capacity expansion is therefore a more relevant consideration than immediate direct exposure to AI data centers.
Taihan Cable & Solution and Gaon Cable serve the power cable supply chain.
Power cables connect generation assets, transformers, substations, and data centers.
However, cable manufacturers may experience earnings volatility due to copper prices, project mix, and construction progress.
Comments in the source regarding Gaon Cable’s valuation and Taihan Cable & Solution’s quarterly earnings risk were based on conditions at the time and should be reassessed using current financial results and valuations.
Order-to-Revenue Conversion Varies by Company
Extra-high-voltage transformer manufacturers operate under long-cycle order structures, with approximately two years between order placement and delivery.
Orders secured in the current year may be recognized as revenue and operating profit approximately two years later, making the backlog an important indicator of medium-term earnings visibility.
The source states that first-half new orders among major transformer manufacturers increased approximately 70% year over year.
This compares with an estimated increase of approximately 30% in the first half of 2023.
However, the underlying companies and comparison periods should be verified against primary data.
LS ELECTRIC has a different revenue profile.
Because switchboards and switchgear generally have delivery periods of three to six months, orders received early in the year may be recognized as revenue within the same year.
Transformer manufacturers should therefore be evaluated primarily through backlog trends, while LS ELECTRIC requires closer monitoring of new orders and near-term delivery schedules.
Why Electrical Equipment Stocks May Diverge from Fundamentals
Electrical equipment stocks can decline sharply even when industry orders continue to increase.
Equity prices reflect future growth expectations, valuation, interest rates, and financing conditions rather than current earnings alone.
Some electrical equipment stocks have appreciated several-fold, increasing their sensitivity to even modest earnings concerns.
The market is also placing greater emphasis on operating cash flow and free cash flow rather than revenue growth alone.
According to the source, Bloom Energy recorded revenue growth of approximately 140%, but negative operating and free cash flow due to substantial investment weighed on its valuation.
This indicates that markets have become more sensitive to financing costs and cash consumption.
By contrast, the major Korean electrical equipment companies referenced in the source reportedly did not have negative operating cash flow at the time.
Investors should evaluate operating cash flow, free cash flow, net debt, and capacity-expansion expenditure alongside revenue growth.
Key Factors Often Overlooked by the Market
First, transformer procurement can secure priority in the grid-connection process.
Companies that secure equipment with delivery periods exceeding two years may improve their ability to negotiate earlier data center grid connections.
AI competitiveness may increasingly depend on access to transformer production slots and grid interconnection rights as well as GPU capacity.
Second, Big Tech capital expenditure is expanding into utility infrastructure.
Direct purchases of transformers and generation equipment broaden AI capital expenditure from semiconductors and servers to the full power infrastructure chain.
This may affect depreciation, cash flow, and investment payback periods for data center operators.
Third, the companies with the fastest earnings improvement may differ from those with the largest long-term exposure.
Switchboards and switchgear have shorter delivery periods and faster revenue recognition.
Extra-high-voltage transformers have slower revenue conversion but provide longer-term visibility through order backlogs.
Fourth, growth in on-site generation may increase rather than reduce demand for distribution equipment.
Distributed generation requires additional equipment to convert, control, and distribute electricity within data centers.
Fifth, AI data center power shortages are not solely a generation-capacity issue.
Even when generation is sufficient, electricity cannot reach data centers without transmission networks, substations, transformers, and grid-connection approvals.
The primary constraint therefore extends across the entire power supply chain, from generation to distribution.
U.S. Politics and Power Infrastructure Policy
U.S. political priorities may influence the allocation of power infrastructure investment.
Policies emphasizing clean energy and distributed resources could support behind-the-meter markets, including switchgear, energy storage, and fuel-cell-related equipment.
Policies favoring conventional generation, large-scale transmission, and permitting reform could provide more direct support for extra-high-voltage transformers and transmission equipment.
However, policy outcomes are not determined solely by party control.
State regulation, Federal Energy Regulatory Commission policies, utility finances, community opposition, and environmental reviews also affect project execution.
Investors should therefore focus on enacted budgets and permitting reforms rather than simplified political classifications.
Key Investment Risks
First, permitting delays.
Even after transformers are completed, delayed approvals for transmission networks and substations can postpone deliveries and revenue recognition.
Second, capacity-expansion risk.
Excessive factory expansion based on optimistic demand assumptions could reduce utilization and profitability if AI investment slows.
Third, adjustments to Big Tech AI capital expenditure.
Slower-than-expected AI monetization or higher interest rates could lead to revised data center construction schedules.
Fourth, cash flow and financing costs.
Rapid revenue growth may not generate cash if inventories, receivables, and capital expenditure increase more quickly.
Fifth, valuation reference periods.
The source states that some companies traded below 20 times estimated 2027 earnings per share, but both forecasts and share prices remain subject to change.
A stock may appear inexpensive based on earnings two or three years ahead, but delivery delays and cost inflation could reduce projected earnings.
Sixth, contract certainty.
Production-slot reservations, memoranda of understanding, preferred-bidder status, and confirmed purchase orders have different levels of certainty.
Investors should assess customer identity, contract value, delivery period, termination conditions, and disclosure status.
AI Power Infrastructure Indicators to Monitor
First, monitor data center capital expenditure plans announced by U.S. Big Tech companies.
Second, track new orders, backlogs, and North American revenue exposure among transformer manufacturers.
Third, compare U.S. manufacturing capacity with actual utilization rates.
Fourth, monitor permitting and construction schedules for 765 kV transmission projects.
Fifth, determine whether on-site generation contracts progress from pilot projects to recurring orders.
Sixth, track utility rate increases and regulatory approval of capital expenditure plans.
Seventh, assess whether operating and free cash flow improve alongside revenue growth.
Simultaneous improvement across these indicators would support the view that AI data center and grid investment represent a long-term industrial cycle rather than a short-term market theme.
< Summary >
The principal bottlenecks for AI data centers are increasingly power grids and transformer supply rather than GPUs.
Data centers can be built within two to three years, while power infrastructure may require more than five years when permitting is included.
Big Tech companies are beginning to secure extra-high-voltage transformers and distribution equipment directly to accelerate data center commissioning.
Only a limited number of manufacturers can produce 765 kV transformers, and customized production creates structural supply constraints.
On-site generation can address near-term power shortages, but it is more likely to complement than replace the conventional grid.
Hyosung Heavy Industries and HD Hyundai Electric are positioned in extra-high-voltage transmission, LS ELECTRIC in data center distribution, and Sanil Electric in specialty transformers and on-site generation.
Investors should evaluate permitting, production capacity, cash flow, Big Tech capital expenditure, and contract certainty alongside order growth.
[Related Articles…]
Why Power Grid Investment Is Becoming Critical Infrastructure in the AI Era
Global Big Tech Data Center Competition and the Outlook for Electricity Demand
*Source: [ 경제 읽어주는 남자(김광석TV) ]
– AI 데이터센터보다 전력이 부족하다…빅테크가 변압기부터 사들이는 이유 | 경제학교 월간특강 [3편]