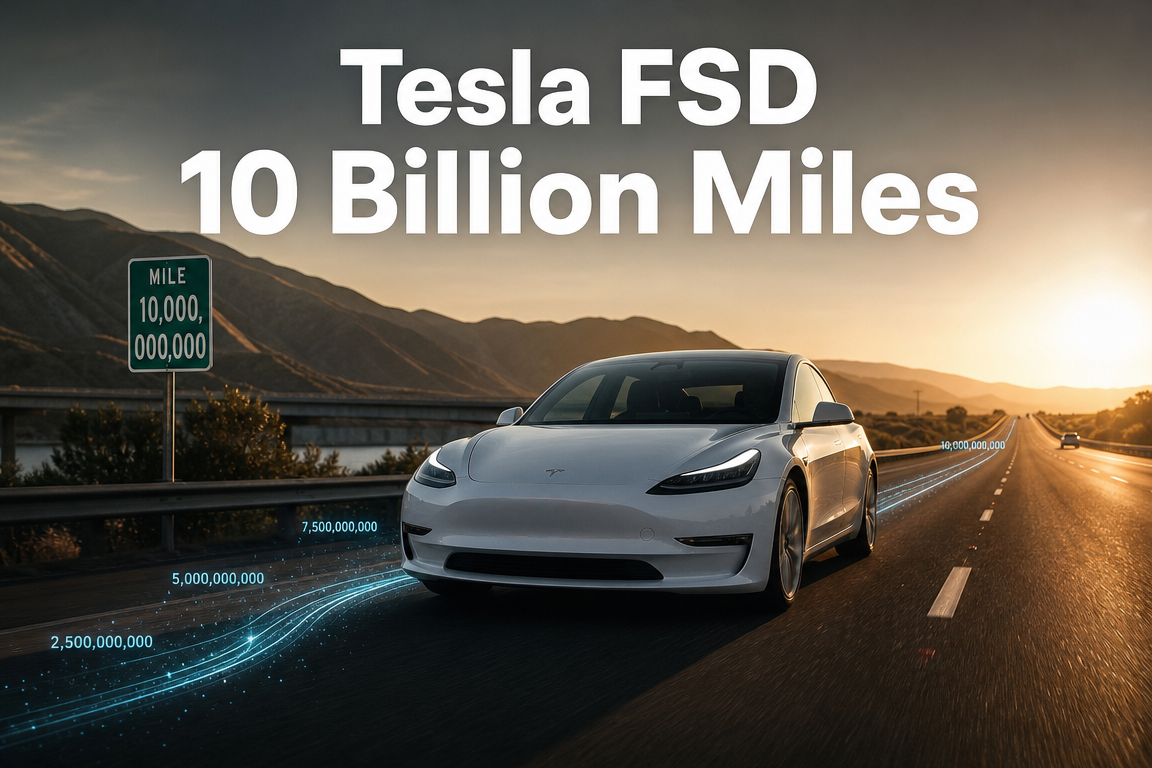
● Tesla FSD Breaks 10B Miles, Robotaxi Hype Surges
Tesla FSD Surpasses 10 Billion Miles: Implications for Unsupervised Autonomy, Equity Markets, AI, and Robotaxis
Tesla has reported that cumulative supervised Full Self-Driving (FSD) mileage has exceeded 10 billion miles. This milestone matters because Elon Musk previously cited approximately 10 billion real-world miles as a threshold associated with achieving safe unsupervised autonomy. The development is relevant beyond Tesla, intersecting with U.S. equities, growth-stock valuation, AI industry dynamics, the robotaxi market, and emerging digital transformation monetization models.
This report summarizes:
- The practical significance of 10 billion FSD miles
- Whether unsupervised autonomy is materially closer
- Potential near-term vs. medium-term implications for Tesla equity
- How China and Nvidia may compress timelines via simulation-centric approaches
- Where Tesla’s transition from an automaker to an AI/SaaS-like business model could become measurable
A key emphasis is on decision criteria more important than the 10 billion-mile headline, particularly metrics tied to deployment, safety, and monetization.
1. Key takeaway: Tesla crossed a “threshold,” not only a number
Tesla confirmed via its official account that supervised FSD cumulative mileage has surpassed 10 billion miles. Market participants are linking the figure to the feasibility of commercializing unsupervised autonomy.
The core point:
- Musk previously stated that safe unsupervised autonomy would require roughly 10 billion miles of real-world driving data.
- Tesla has now exceeded that figure, reaching a self-referenced benchmark.
However, investor response remains measured, given prior shifts in cited thresholds (e.g., earlier references near 6 billion miles). Credibility and deliverability remain the central questions.
2. Data accumulation rate: why the current phase differs
The significance is amplified by the acceleration in data accumulation, not only the cumulative total.
- 2020: 5 million miles
- 2021: 11 million miles
- 2022: 91 million miles
- 2023: 761 million miles
- 2024: 3.0 billion miles
- 2025: 7.2 billion miles
- Early May 2026: surpassed 10 billion miles
This resembles an exponential curve. The current collection rate is the critical variable: a reported increase from ~14 million miles/day earlier in the year to ~29 million miles/day recently suggests Tesla’s fleet-data engine has reached scale.
From an AI perspective, the shift is from “collecting data” to “compounding advantage through data scale and iteration speed.”
3. Safety metrics: constructive but not definitive for unsupervised operation
Updated safety data indicates approximately 1 collision per 5.3 million miles under supervised FSD, compared with approximately 1 collision per 0.66 million miles for the U.S. average driver. On a simple comparison, this implies roughly an ~8x improvement.
These metrics matter because commercialization depends less on demonstrations and more on:
- regulatory acceptance,
- insurance frameworks,
- consumer trust,
- reproducibility and accountability.
A key limitation: supervised FSD reflects conditions where a driver is prepared to intervene. It is not directly equivalent to fully unsupervised operations. Therefore, crossing 10 billion miles does not, by itself, imply near-term nationwide unsupervised deployment.
4. Operational reality: early unsupervised activity is a stronger signal than cumulative miles
A more decision-relevant indicator is that unsupervised robotaxi operations appear to be occurring in limited geographies, with reported fleet counts:
- Austin: 22 vehicles
- Dallas: 5 vehicles
- Houston: 6 vehicles
- Total: ~33 vehicles
This is meaningful because it shifts validation from an abstract data threshold to real-world operational testing.
Forward-looking monitoring should prioritize:
- expansion of unsupervised operating zones,
- growth in vehicle count,
- regulatory scope changes,
- sustained reduction in intervention rates.
5. Macro factors: near-term equity impact may be driven more by rates and risk appetite
Despite the constructive Tesla-specific headline, near-term stock performance may be more sensitive to macro variables, notably:
- Middle East geopolitical risk and elevated oil-price volatility
- Potential softening in U.S. employment data
Higher oil prices can support EV adoption narratives, but also risk re-igniting inflation pressure and delaying rate-cut expectations, which tends to weigh on growth-stock multiples.
Additionally, if nonfarm payrolls confirm deceleration, recession risk could reprice risk assets broadly, impacting Nasdaq, AI-linked equities, EVs, and Tesla.
As a result, the 10 billion-mile milestone may not be sufficient on its own to drive immediate equity repricing.
6. The central debate: is 10 billion real-world miles a durable moat?
The strategic question is whether Tesla’s real-world mileage is an enduring barrier or whether competitors can bypass it using alternative data-generation methods.
6-1. Tesla bullish framework
The argument:
- Real-world data contains long-tail conditions across weather, infrastructure, human behavior, and rare events.
- Accumulating this at scale requires time, capital, and a large deployed fleet with OTA iteration.
Thus, the moat is not only data quantity, but a combined system asset: fleet scale + software stack + distribution + update loop.
6-2. Catch-up framework via simulation
Competitors aim to offset real-world data deficits through simulation, including:
- XPeng’s VLA 2.0 references
- Nvidia’s Cosmos and broader simulation platforms
Advantages:
- rapid generation of large-scale training data without multi-year on-road accumulation,
- potentially lower marginal cost and faster iteration.
In China, pricing dynamics may also favor bundling software into vehicle pricing rather than a separate subscription model, contrasting with Tesla’s monthly subscription approach.
Overall, the competitive landscape may converge on “real-world data advantage” versus “simulation efficiency,” which is fundamentally an AI training methodology competition.
7. Tesla equity implications: distinguish near-term from medium-term
7-1. Near-term
Near-term impact may be limited. Musk has indicated that robotaxi revenue this year is not expected to be material. Markets generally require measurable cash flow and earnings revisions to sustain repricing. In high-rate or risk-off conditions, positive technology updates may have muted equity impact.
7-2. Medium-term
The medium-term setup depends on subscription economics. Reported FSD subscribers are ~1.28 million. At $99/month, this implies potential annual recurring revenue of approximately $1.5 billion.
More important than the current figure is the penetration gap: a large installed base remains a monetization opportunity. If unsupervised capability becomes credible and broadly permitted, software revenue could scale with higher margins and improved recurrence versus vehicle sales.
This is the basis for potential re-rating toward an AI/software/platform valuation framework.
8. Key KPI transition: from deliveries to subscribers and software metrics
Historically, Tesla’s earnings narrative has centered on vehicle deliveries. A structural shift would occur if market focus pivots toward software KPIs, including:
- FSD subscriber growth
- ARPU
- churn
- active usage time
- robotaxi utilization and revenue signals
At that point, Tesla would be evaluated less as a cyclical manufacturer and more as a recurring-revenue, AI-enabled services business.
9. Cybercab and robotaxis: why 2027 is a key window
Even if near-term robotaxi revenue is immaterial, the longer-term thesis centers on scale deployment. If low-cost vehicles, low operating costs, and unsupervised autonomy converge, unit economics for mobility services could change materially.
The decision focus is not this year’s revenue, but whether deployment scale can expand meaningfully around 2027. The model increasingly resembles an AI infrastructure and mobility-services platform where hardware initiates an installed base and software/services harvest long-duration cash flows.
10. Used EV growth as a secondary driver of FSD expansion
An increase in U.S. used EV sales is relevant because higher fuel costs can shift demand toward EVs. Importantly, used Tesla buyers also represent potential FSD subscribers.
This supports a scenario where, even if new vehicle sales slow, software attach rates across the existing fleet can sustain incremental monetization. This differentiates Tesla from traditional automakers where revenue is more tightly tied to new-unit volume.
11. Under-emphasized but decision-critical points
Many discussions over-weight the 10 billion-mile headline. More decision-relevant indicators are:
- First, 10 billion miles is an outcome metric; the key is the trend in intervention rate reduction.
- Second, expansion of unsupervised operating areas is the clearest commercialization signal.
- Third, FSD subscriber growth is required to confirm conversion of capability into revenue.
- Fourth, Tesla’s core competitive set may increasingly be simulation-centric AI training ecosystems rather than legacy automakers.
The priority is how quickly data converts into service performance and monetizable cash flows.
Key KPIs to monitor:
- number of unsupervised regions
- vehicle count
- collision/incident rates
- intervention rates
- FSD conversion rate
- early robotaxi revenue indicators
Meaningful movement in these metrics would likely matter more to markets than cumulative-mile milestones.
12. Synthesis
Surpassing 10 billion miles is a substantive milestone, given it aligns with a benchmark previously cited by Musk. Early unsupervised operations in select locations and accelerating data scale support the view that Tesla may be approaching a technical inflection point in certain domains.
However, it is insufficient to conclude imminent nationwide unsupervised commercialization or rapid revenue conversion, given macro uncertainty, regulatory constraints, real-world vs. simulation competition, and credibility overhang from shifting timelines.
Market re-rating is more likely to follow evidence of scalable monetization rather than capability headlines alone.
13. Items to monitor
- U.S. employment data and rate expectations
- expansion in unsupervised robotaxi vehicle counts and geographies
- intervention-rate improvements following FSD updates
- pace of FSD subscriber growth
- simulation results and deployment progress among Chinese autonomy competitors
- expansion of autonomy training platforms within the AI infrastructure ecosystem (including Nvidia)
- growth in Tesla’s share of recurring software revenue
< Summary >
Tesla’s supervised FSD fleet has exceeded 10 billion cumulative miles, a milestone with symbolic significance because it matches a previously cited benchmark for safe unsupervised autonomy. Near-term equity reaction may be constrained by U.S. macro data, interest-rate expectations, and recession risk sensitivity.
The more decision-relevant factors are expansion of unsupervised operations, subscriber growth, intervention-rate declines, and early robotaxi monetization. Confirmation of these trends could support a shift in investor framing from an automaker to an AI-enabled, recurring-revenue software and services platform.
[Related links…]
-
Tesla robotaxi scaling and FSD monetization re-rating
https://NextGenInsight.net?s=Tesla -
Autonomy competition: real-world data vs. simulation training
https://NextGenInsight.net?s=AI
*Source: [ 오늘의 테슬라 뉴스 ]
– 드디어 100억 마일 — 머스크가 ‘이 숫자면 된다’고 했다, 이번엔 진짜 비감독 FSD 나오나?
● Semiconductor Surge, Korea Repriced
Samsung Electronics and SK Hynix Surge: The More Material Takeaway
Key implications beyond the immediate rally: improved U.S. access to Korean equities, shifts in global capital inflow channels, potential easing of the Korea discount, and holding-company discount dynamics.
1. Immediate drivers of the moves in Samsung Electronics and SK Hynix
The primary catalyst was improved accessibility for U.S. investors to buy Korean equities.
Following enhanced trading availability of Korean stocks on Interactive Brokers, discussions in U.S. investor communities reportedly accelerated around which Korean names to buy. Initial inflows concentrated in Samsung Electronics and SK Hynix due to:
- High global visibility and ease of investor understanding as flagship semiconductor companies
- Existing expectations for a memory-cycle recovery
- Relative valuation appeal versus U.S. semiconductor peers
- Central positioning in AI/data-center supply chains, particularly for memory
For U.S. investors with limited familiarity with broader Korean market structure, these names offer a straightforward investment thesis: improving memory fundamentals, rising AI-related demand, and comparatively lower valuations.
2. Why timing mattered: accessibility changes can move prices
A key variable was not a sudden change in fundamentals, but a shift in the “ability to buy.”
Equity prices often respond to changes in market access and execution friction, including:
- Who can buy
- How easily purchases can be executed
- The scale at which capital can be deployed quickly
This development can be interpreted as Korean equities becoming incrementally more accessible to U.S. retail and smaller institutional flows. In a macro backdrop shaped by rate-cut expectations, U.S. dollar dynamics, global growth repricing, and a semiconductor upcycle, cross-border capital may concentrate rapidly into liquid, globally recognized sectors.
3. The market’s simplest narrative: semiconductors as a common language
For non-domestic investors, semiconductors function as a globally standardized sector narrative, particularly in an AI-driven cycle. Key themes commonly referenced include:
- HBM demand growth
- Higher-value server DRAM mix
- AI data-center capex expansion
- Memory price recovery
- Semiconductor supply-chain reconfiguration
Under this framing, Samsung Electronics and SK Hynix become default “first-buy” candidates when access improves.
4. Why the more leveraged beneficiary may be SK Square
The more material second-order implication is the potential re-rating of discounted holding structures, with SK Square highlighted as a candidate.
SK Square holds an equity stake in SK Hynix. Markets often apply a structural discount to holding companies (holding-company discount / valuation discount), leading to a gap between:
- Look-through asset value (notably the SK Hynix stake), and
- The holding company’s traded market capitalization
A common investor logic in such situations:
- SK Hynix is attractive
- SK Square owns SK Hynix
- SK Square appears cheaper on a look-through basis
- Returns may be amplified if the discount narrows
International investors may increasingly screen for these discount-to-NAV setups after establishing exposure through the most liquid and recognizable names.
5. Significance of buy-flow concentration through a specific domestic broker channel
Buy flows were noted as being visible through a major domestic brokerage channel. While broker attribution is not definitive, offshore-origin orders can appear via domestic broker routes. Market participants sometimes interpret such patterns as indicative of foreign-linked activity.
This matters because it supports the possibility that the move reflects expanding external participation rather than a short-lived domestic retail theme. Where a clear global sector thesis exists (e.g., semiconductors), narratives can persist if supported by sustained flows.
6. Economic-news framing of the development
- First: Improved U.S. platform access to Korean equities altered near-term flow dynamics
- Second: U.S. investors initially concentrated in the most recognizable Korean semiconductor large caps
- Third: The rally reflected not only cycle recovery expectations but also incremental global inflow optionality
- Fourth: Discounted look-through structures (e.g., SK Square) may emerge as follow-on beneficiaries
- Fifth: The trend may connect to broader discussions around liquidity, accessibility, and potential easing of the Korea discount
The move is therefore best assessed as part of broader market-structure and cross-border flow dynamics, not solely as single-stock news.
7. Semiconductor investment checkpoints
7-1. Memory-cycle recovery
Consensus commentary increasingly describes DRAM and NAND as entering recovery after an inventory adjustment phase, with improving profitability expectations supported by server and AI-linked demand.
7-2. AI infrastructure expansion
Competitive buildout in generative AI drives simultaneous demand for GPUs, HBM, advanced memory, and server capacity. In this configuration, Korean memory suppliers remain strategically positioned.
7-3. Potential valuation re-rating
If earnings recovery is confirmed, valuation normalization for relatively discounted Asian technology equities may proceed faster than expected, though timing remains uncertain.
7-4. Durability of foreign flows
The critical variable is persistence. Beyond a single session’s buying, investors should monitor whether access expansion results in structural inflows rather than event-driven trading.
8. Under-discussed but material implications
8-1. Access changes can lead fundamentals
Market-access improvements can be price-leading catalysts, sometimes preceding earnings confirmation.
8-2. Foreign capital typically starts with “easy” names
Initial allocations tend to favor large, liquid, globally legible names before rotating toward:
- Discounted holding structures
- Adjacent value-chain exposures
- Broader thematic baskets
8-3. Accessibility as a component of the Korea discount
Common explanations for the Korea discount include governance, policy uncertainty, and shareholder returns. Market accessibility and operational friction can also be meaningful contributors. Incremental improvements may be supportive for liquidity and long-run market quality.
9. Investor framework: three layers of exposure
9-1. Layer 1: direct beneficiaries
- Samsung Electronics
- SK Hynix
Most likely initial recipients of incremental foreign demand.
9-2. Layer 2: indirect beneficiaries
- SK Square
- Other discounted, linked exposures within the semiconductor value chain
Potential beneficiaries as investors seek look-through value and discount-to-asset opportunities.
9-3. Layer 3: market-structure beneficiaries
- Foreign-preferred Korean large caps
- Korean technology equities broadly
- Names associated with governance and shareholder-return improvement expectations
If cross-border access continues to improve and flows broaden, sentiment may extend beyond semiconductors to the broader index.
10. One-line interpretation
The rally in Samsung Electronics and SK Hynix reflected not only semiconductor-cycle optimism but also improved U.S. investor access to Korean equities. Follow-on focus may shift toward discounted holding structures such as SK Square, implying broader relevance to foreign flow dynamics and potential market re-rating.
< Summary >
Enhanced access to Korean equities via Interactive Brokers coincided with increased U.S. investor buying, initially concentrated in flagship semiconductor names. A key second-order implication is the potential re-rating of discounted holding-company exposures such as SK Square, which offers look-through linkage to SK Hynix. The development may be relevant to foreign flow expansion, potential easing of the Korea discount, and broader Korean market re-assessment.
[Related Articles…]
- https://NextGenInsight.net?s=semiconductors
- https://NextGenInsight.net?s=SK%20Square
*Source: [ 내일은 투자왕 – 김단테 ]
– 삼성전자, SK하이닉스 떡상? ‘진짜 수혜주’는 따로 있습니다 (5/4)