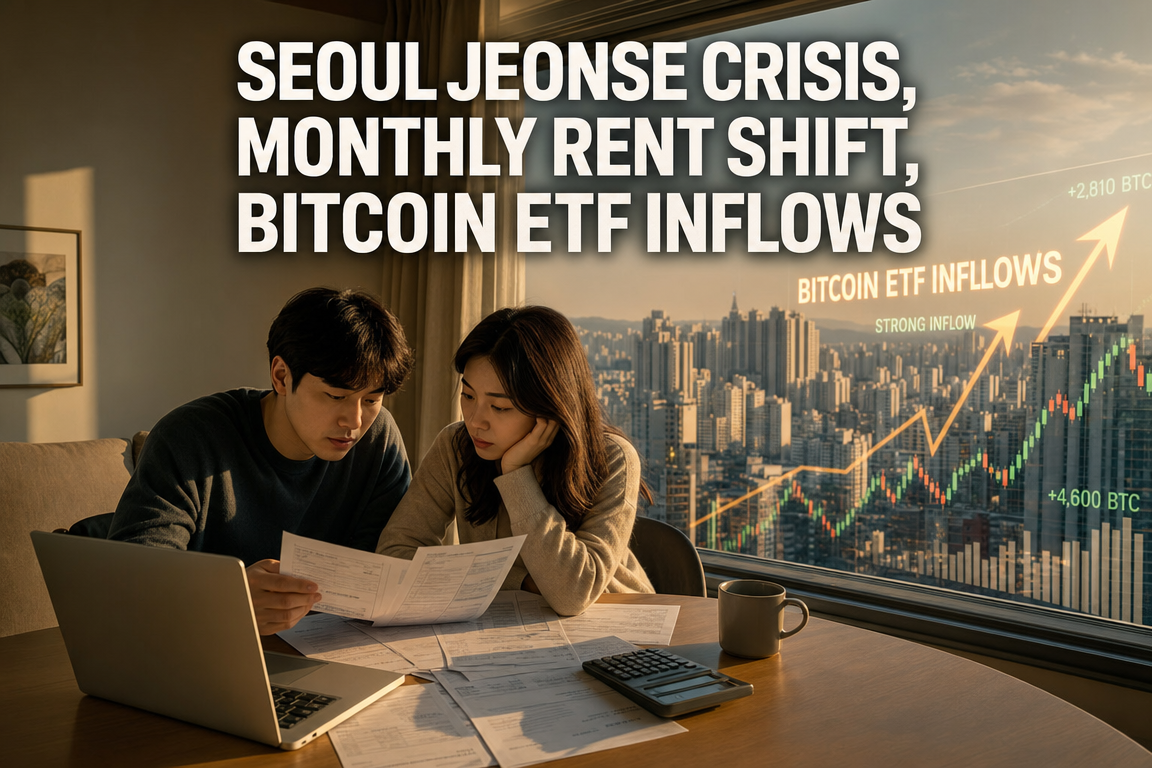
● Seoul Housing Shock, Supply Crunch and Rent Crisis
Seoul Housing Price Outlook 2026: Focusing Only on Gangnam Is a Mistake. Key Points on the Lease Shock and the Shift to Monthly Rents, and How to Identify Under-KRW 1.0B Opportunities
The Seoul real estate market is unlikely to be accurately explained by a simple “up or down” framework.
This report consolidates the key drivers:
1) Why Seoul’s apartment supply shortage is expected to intensify in 2025–2026.
2) How Middle East-driven commodity shocks and rising construction costs can affect both home prices and the rental market.
3) Why corrections in the top-tier districts and strength in mid-priced, less-regulated areas can occur simultaneously.
4) How first-time buyers and newlyweds should define practical home-buying criteria.
5) The structural contraction in lease (jeonse) supply and the deterioration of the non-apartment market.
Core conclusion: A narrow focus on top-tier districts increases the risk of missing under-KRW 1.0B opportunities in Seoul for both owner-occupancy and investment. The primary risk is increasingly concentrated in the rental market rather than in transaction prices.
Understanding these linkages clarifies how policy, interest rates, inflation, supply shortages, and rental stress interact.
1. One-line summary of the current Seoul market
The market can be summarized as: “selective correction in top-tier areas + resilience in mid-priced, end-user demand zones + rapid deterioration in rental stability.”
Seoul is not moving as a single market. Performance diverges by district, and even by unit type within the same complex. Averages can be misleading.
- Premium districts (e.g., Gangnam, Seocho, Songpa) face partial correction pressure due to tighter regulation and financing constraints
- Sub-KRW 1.5B segments show relative resilience as finance-eligible demand concentrates
- Outer Seoul and transit-improving satellite areas may attract incremental end-user inflows
- Lease listings are declining rapidly; conversion to monthly rents is accelerating
- Middle East geopolitical risk and construction-cost inflation may further delay supply
2. Market developments (news-style)
2-1. Seoul apartment supply is falling to less than half of a normalized level
Supply constraints are a central theme.
Seoul is often estimated to require ~40,000 units per year. Referenced figures indicate ~20,000 units in 2025 and ~10,000 units in 2026.
The implication is a supply cliff, with already tight conditions tightening further.
This matters because while rates and regulation influence near-term price action, housing supply often sets the medium-to-long-term floor for pricing.
2-2. Why Middle East risk matters for Seoul housing
Construction cost sensitivity extends beyond cement and steel. Many inputs are linked to oil and petrochemicals, including:
- Paints, plastics, window systems
- Finishing materials
- Piping and related components
The key risk is not only higher costs but also supply-chain disruptions that delay completions. Residential projects can stall if specific components become unavailable.
2-3. Policy has restrained ultra-high-end demand, but not the entire market
Policy is increasingly targeted at high-priced assets, multi-home ownership, and top-end purchasing demand, with credit restrictions as a primary mechanism.
- Material limitations on borrowing above KRW 1.5B
- Above KRW 2.5B increasingly resembles cash-only execution
- Tiered lending caps (e.g., KRW 600M / 400M / 200M brackets)
This has increased correction pressure in top-tier districts. In contrast, transaction flow and, in some cases, new highs can still appear in finance-accessible segments.
2-4. A pullback in premium districts does not imply a Seoul-wide downturn
Top-tier markets have already repriced significantly over the prior two years, making them more sensitive to regulatory shocks.
Mid-tier and lower-tier segments, particularly those within borrowing eligibility, can follow a different trajectory.
Current market structure: “ultra-high-end adjustment vs. end-user price-band defense” occurring in parallel.
3. The primary risk: rental-market stress may worsen more than resale prices
The dominant risk is increasingly in the rental market.
3-1. Why lease supply is structurally shrinking
Approximately 90% of lease and monthly-rent supply is provided by private landlords; public supply is structurally limited.
When new move-in volume declines, lease supply mechanically contracts. Historically, a meaningful portion of newly delivered units entered the rental pool; reduced completions reduce that flow.
The 2025–2027 decline in move-in volumes is described as largely pre-committed in available data, making the trajectory difficult to reverse quickly.
3-2. Expansion of land-transaction permit zones further reduces lease supply
Permit-zone rules typically require owner-occupancy, limiting purchases intended to retain tenants.
As transactions occur, rental inventory can be removed from the market when units must transition to owner-occupancy.
This compounds the decline in lease supply and increases the likelihood that the shortage is structural rather than temporary.
3-3. Why “more owner-occupancy reduces rental demand” is less applicable in Seoul
In theory, converting renters into owners reduces rental demand. In Seoul, latent demand remains large:
- Households displaced from Seoul into nearby regions seeking re-entry
- Inbound migration from other regions
- Within-Seoul upgrading demand
With low lease-to-price ratios and high purchase prices, many households can access Seoul via leasing but not via purchase. As rental inventory shrinks, rental demand does not decline proportionately, raising the risk of severe lease-market stress.
3-4. Why the shift from lease to monthly rent is accelerating
The referenced view is that lease listings are rapidly disappearing in preferred complexes, leaving mainly monthly-rent options.
Rising monthly rents increase household cash-flow stress. For end users, monthly rent outlays can exceed annual holding costs, making rent inflation a practical decision driver.
4. Non-apartment market deterioration may be a larger structural issue
Supply stress is not limited to apartments. Multi-family units, villas, and officetels have also contracted.
Historically, non-apartment supply helped support lower-cost housing. After fraud incidents and tighter lending/guarantee rules, demand and supply have weakened.
The implication is a weakening of the lower rung of the housing ladder in Seoul and the metro area, potentially increasing long-term polarization.
5. Framework for first-time buyers
5-1. The key benchmark is affordability, not premium districts
The practical guidance: focusing only on premium districts can result in permanent exclusion.
The relevant opportunity set is Seoul, or Seoul-accessible areas, under KRW 1.0B, including potential value in the KRW 500M–800M range.
Decision criteria should prioritize the buyer’s executable price band, transit connectivity, job access, and medium-term appreciation potential.
5-2. Holding-cost concerns are often overstated
Some renters overemphasize property-tax fears. In many cases, holding costs for KRW 500M–1.0B assets may be materially lower than monthly rent burdens.
For sub-KRW 2.0B segments, holding costs may not be the primary variable that determines feasibility, though tax rules can change and vary by household.
5-3. Rates and inflation affect segments differently
Middle East risk could reintroduce inflation pressure and rate-hike discussion. However, broad leverage-driven instability may be less pronounced given already tight credit conditions.
End-user segments using manageable leverage may be more resilient. Ultra-high-end segments may face larger adjustments due to combined effects of regulation, taxes, and listing accumulation.
6. How to identify under-KRW 1.0B “hidden gems” in Seoul
Three filters are emphasized.
6-1. Focus on areas where demand is increasing
Prices follow demand, which can respond quickly to transit, employment, and new-build presence.
- Areas with job growth
- Areas with improved connectivity to key employment centers
- Areas where new apartments upgrade local perception and desirability
Overlap among these factors increases the probability of sustained strength.
6-2. Prioritize confirmed rail projects (GTX, Shinansan Line, Dongbuk Line, Line 8 extension)
Repeatedly cited networks include GTX-A/B/C, the Shinansan Line, the Dongbuk Line, and the Line 8 extension.
These are treated as structural accessibility changes rather than short-term “catalyst” headlines.
Given the employment density in southern Seoul, areas that reduce travel time to these hubs can attract end-user demand. The value proposition becomes “not living in premium districts, but reaching them quickly.”
6-3. Prefer new builds or older assets with strong “new-build substitute” attributes
With construction costs structurally higher, delivering “cheap” new supply becomes less feasible.
Accordingly, already-delivered new builds, or older assets with strong locations and remaining valuation discount, may attract interest.
The key is not “cheap housing,” but housing that may be difficult to replicate under future cost conditions.
7. Regional notes: metro area and major cities
7-1. Metro area: focus on destinations for Seoul substitution demand
Seoul’s affordability constraints continue to push demand outward. Priority is given to areas with confirmed transit upgrades and strong job access.
Examples cited include Goyang (Deogyang-gu), Hwajeong-dong, and Samsong New Town, supported by GTX-A and improved access to major nodes.
7-2. How to read Pyeongtaek, Yongin, Seongnam, Bundang, Gwacheon
Regions linked to major industrial and employment clusters (e.g., large semiconductor ecosystems and Pangyo) can sustain demand.
However, not all “catalyst” areas are undervalued. Pricing may already reflect expectations, requiring differentiation between “future upside” and “already repriced.”
7-3. Major cities: target only prime submarkets
Large cities should not be evaluated as uniform markets. Dispersion is high both across and within cities.
The approach emphasized is to focus on prime locations and projects with viable new-build or redevelopment economics, particularly after multi-year corrections.
Examples referenced include:
- Busan: Haeundae, Suyeong
- Daegu: Suseong
- Gwangju: Seo-gu, Nam-gu
- Daejeon: Dunsan
8. Under-discussed points in mainstream coverage
8-1. The market’s core issue is “housing access,” not only “price”
Most commentary centers on price direction. The more operational question is the availability of stable housing options.
As leasing contracts and monthly rent expands, housing cost becomes a cash-flow issue, not only a balance-sheet issue. Policy relevance extends from price stability to occupancy stability.
8-2. Seoul’s lease market may face a structural, not cyclical, shortage
Move-in declines, owner-occupancy requirements in permit zones, and non-apartment contraction are simultaneous.
This combination increases the probability that lease stress persists beyond a short-term shock.
8-3. Non-apartment contraction implies housing-ladder deterioration
Weakening supply in villas, multi-family housing, and officetels can destabilize lower-cost housing availability and amplify inequality over time.
8-4. Do not generalize premium-district corrections into a broad downturn
Premium-district adjustments may reflect direct regulatory and financing impacts. Extending that signal to the entire city or to end-user segments can lead to misallocation.
Current dispersion is driven by differences in price band, regulation, and product type (new vs. old).
9. End-user checklist
- Is 2025–2027 move-in volume sufficient in the target area?
- Are lease listings shrinking and monthly-rent conversion accelerating?
- Is the target price band finance-eligible?
- Can key employment centers be reached within 30–40 minutes?
- Are there confirmed transit benefits (GTX, Shinansan Line, Dongbuk Line, Line 8 extension)?
- Is current pricing materially below future replacement-cost economics?
- Is the area less regulated or relatively under-repriced?
- Is it a new build, or an older asset with strong substitute attributes?
10. Conclusion: prioritize executable prime access over chasing premium districts
The market should not be evaluated through city-wide averages.
- Supply shortages are increasingly embedded and difficult to reverse quickly
- Lease-market disruption and the shift to monthly rents may accelerate sooner than expected
- For end users, opportunities are more actionable in Seoul-accessible sub-KRW 1.0B segments than in premium-district catch-up strategies
For a 2026 outlook, key variables extend beyond price direction to include lease supply structure, construction costs and delivery delays, and connectivity to employment centers.
11. Blog-style key points (condensed)
- Seoul is entering a period of materially below-normal housing supply
- Middle East risk and higher oil prices can translate into cost inflation and delivery delays
- Premium districts may correct under regulation, but this should not be generalized to a city-wide decline
- Sub-KRW 1.5B end-user segments may behave differently due to financing eligibility and demand concentration
- Lease-market stress is likely structural and already unfolding
- Non-apartment market contraction can increase housing instability for lower-income segments
- End users should compare holding costs against monthly rent burdens rather than anchoring on tax fear
- Under-KRW 1.0B opportunities should be screened by transit, employment linkage, and new-build scarcity
12. Highest-priority framing
The central question is not only “will prices rise or fall,” but “how much stable lease inventory will remain.”
< Summary >
Seoul’s real estate market is not moving in a single direction.
Premium districts may face corrections due to regulation and credit constraints, while finance-eligible end-user segments can remain comparatively resilient.
The primary risk is the lease market and the acceleration of monthly rents.
Declining move-ins in 2025–2027, owner-occupancy rules in permit zones, and non-apartment market contraction increase the probability of a structural decline in lease supply.
For first-time buyers, a more realistic strategy is to prioritize Seoul-accessible, under-KRW 1.0B areas with strong transit access, employment linkage, and new-build scarcity.
[Related Posts…]
- https://NextGenInsight.net?s=Real%20Estate
- https://NextGenInsight.net?s=AI
*Source: [ 경제 읽어주는 남자(김광석TV) ]
– [모아보기] 강남만 보다간 평생 집 못 삽니다. 전세대란·월세 시대에 서울 10억 이하 숨은 진주 찾는 법 | 경읽남과 토론합시다 | 김학렬x김효선
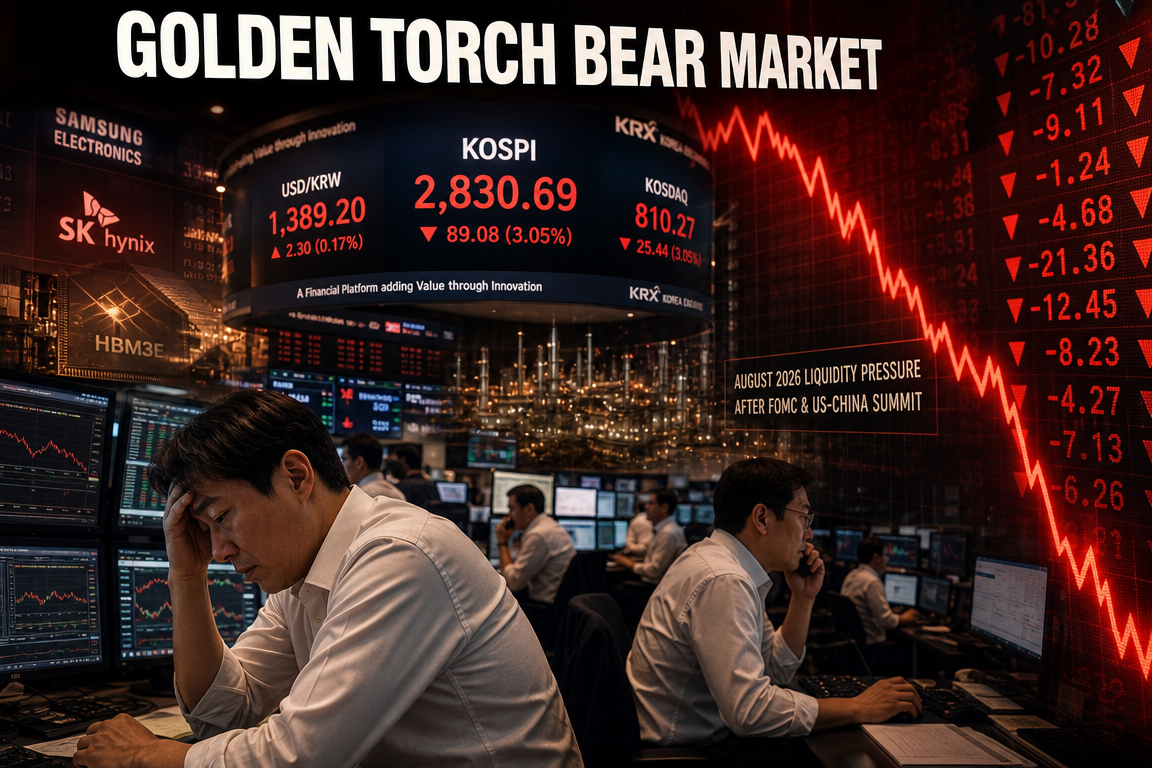
● Bitcoin Crash, ETF Freeze, AI Shift
Comprehensive Summary of the Real Drivers Behind Bitcoin’s Decline — What Is Required for a Recovery: Liquidity, ETFs, Semiconductors, Regulation, and AI Agents
Recent Bitcoin weakness is often attributed to simplified explanations such as “capital rotated into semiconductors,” “liquidity tightened,” or “a routine correction.” These narratives are incomplete. The current drawdown is better explained by changes in crypto-market structure, positioning, and demand drivers, particularly given the relative resilience of US equities.
This report organizes the key drivers behind the decline, explains why US equities remained firm while crypto underperformed, evaluates the market impact of the MicroStrategy selling narrative, outlines why ETF inflows stalled, assesses how institutionalization diluted Bitcoin’s decentralization premium, and frames potential medium-term catalysts including AI agent economies and real-world asset tokenization (RWA).
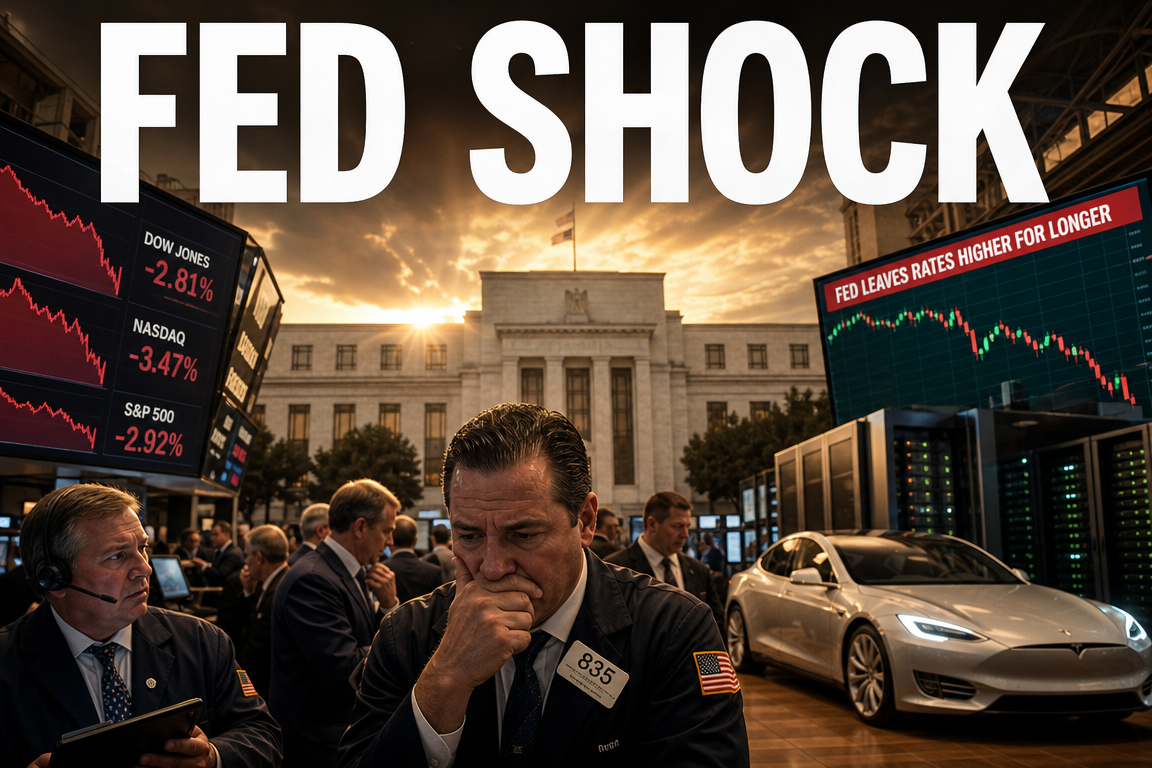
1. Market Snapshot: Why US Equities Held While Bitcoin Sold Off
US equities—particularly technology and semiconductors—have remained supported by AI-driven earnings expectations and sustained capital inflows. In contrast, Bitcoin faced acute downside pressure over the same period.
If the primary driver had been macro deterioration (rates shock, recession risk, broad risk-off), equities would typically have weakened first. The divergence suggests crypto-specific factors—market structure, positioning, and narrative shifts—were more decisive than macro alone.
2. Key Drivers of the Bitcoin Decline (5 Factors)
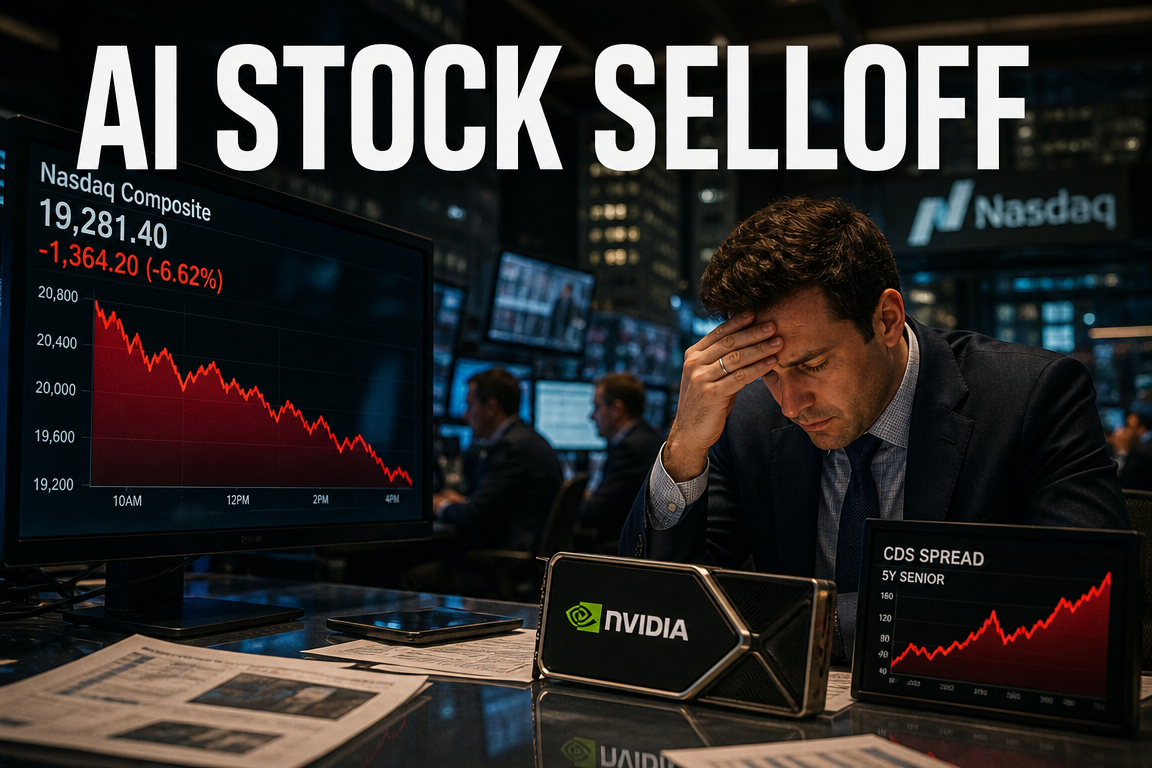
2-1. Capital Rotation Into AI/Semiconductors: Partially Correct, Not Sufficient
The view that “AI-driven semiconductor strength pulled capital from Bitcoin” is directionally relevant but does not fully explain the speed and magnitude of the move. Rotation dynamics typically unfold gradually via relative performance comparisons.
However, the rotation thesis matters because AI-linked equities (e.g., Samsung Electronics, SK Hynix, NVIDIA) offered comparatively higher risk-adjusted returns during the period. As a result, Bitcoin’s role as the default high-beta allocation weakened, reducing marginal demand from aggressive capital.
2-2. MicroStrategy Selling Narrative: Psychological Impact Exceeded Mechanical Supply
The market reaction to potential selling by a highly symbolic long-term accumulator was driven more by narrative shock than by the absolute volume implied. MicroStrategy had been perceived as an effectively non-selling holder.
A shift from “they only buy” to “even they may sell” can destabilize investor confidence, accelerating de-risking. The subsequent 48-hour liquidation wave indicates a combined effect of leverage unwinds and sentiment-driven selling rather than a purely technical pullback.
2-3. ETF Flows Stalled: The Primary Price-Impulse Mechanism Paused
Bitcoin’s recent upside phases have been closely linked to a reflexive loop:
- Price rises
- Attention increases
- ETF inflows expand
- Additional inflows push price higher
When this loop breaks—via outflows or a flattening of net inflows—upside momentum becomes harder to sustain. Current conditions indicate that capital did not disappear entirely; conviction weakened, delaying re-risking until clearer catalysts emerge.
2-4. Institutionalization: A Bullish Milestone With a Trade-Off
Spot ETF approval and broader institutional participation initially expanded addressable demand and improved legitimacy. Over time, however, institutionalization reduced part of Bitcoin’s original differentiator: perceived independence from state and traditional financial systems.
As oversight, surveillance, and enforceability increase (traceability, potential freezes and seizures), segments that valued censorship resistance as the primary thesis may reduce engagement. This represents a structural demand headwind at the margin.
2-5. Rise of Stablecoins: Transaction Utility Shifted Away From Bitcoin
Bitcoin historically carried a dual narrative: investment asset and medium of exchange. In practice, high volatility limits transactional use. Stablecoins have proven operationally superior for payments, remittances, and cross-border settlement.
Additionally, stablecoins may receive comparatively favorable policy treatment due to linkages with demand for US Treasuries. The market is increasingly segmenting roles:
- Bitcoin: store-of-value positioning
- Stablecoins: transactional and settlement infrastructure
This specialization can narrow Bitcoin’s functional narrative and raise the burden of proof for altcoins to demonstrate clear utility.
3. Cycle Framing: Rising Concern Over Late-Cycle Dynamics
Historically, Bitcoin has experienced multi-year expansions followed by deep drawdowns. While history is not deterministic, market participants reference prior cycles to shape risk appetite.
Current positioning suggests a shift from “is this the bottom?” toward “is patience warranted?” The resulting bid suppression is consistent with late-cycle caution and reduced leverage tolerance.
4. Core Issue: Bitcoin Is Losing Narrative Dominance
Crypto markets are not driven solely by rates, FX, or liquidity; narrative has been a primary demand catalyst. Prior narratives—decentralization, inflation hedge, ETF approval, and halving dynamics—have been substantially priced.
In parallel, AI equities maintain a stronger forward narrative supported by tangible drivers: productivity gains, earnings leverage, data-center capex cycles, semiconductor demand, and platform economics. Bitcoin is competing against a more compelling growth narrative for incremental capital.
5. Conditions Typically Required for a Sustainable Bitcoin Recovery
5-1. Re-acceleration of ETF Inflows and Durable Institutional Demand
The most observable condition is a clear reversion to sustained net inflows in spot ETFs. Institutional flows tend to be slower-moving but more persistent once established. A durable uptrend generally requires confirmation of ongoing institutional bid support rather than transient rebounds.
5-2. Renewed Differentiation Through Use-Case or Role Clarity
The “digital gold” framing may be insufficient as stablecoins absorb transactional use and regulation increases. A recovery in relative attractiveness may require clearer articulation of Bitcoin’s unique role beyond price appreciation.
5-3. Convergence of AI Agent Economies and Blockchain-Based Settlement
A potential medium-term catalyst is the emergence of AI agent-driven commerce: machine-to-machine transactions, automated revenue splits, usage-based micro-settlement, and cross-border micropayments. In such systems, blockchain rails can offer efficiency advantages over legacy payment infrastructure.
Relevant domains include:
- Automated settlement for AI model usage
- Rights management and royalty distribution for digital content
- API metering and usage-based billing
- Agent-to-agent payments and escrow
If AI adoption creates explicit demand for programmable settlement, digital-asset infrastructure could be re-rated on utility rather than speculation.
5-4. Expansion of RWA (Real-World Asset Tokenization)
Tokenization of assets such as real estate, bonds, IP, and revenue claims can improve settlement efficiency and broaden access. While still early, a credible integration of regulated finance with on-chain infrastructure could shift market perception from “speculative instruments” toward “financial infrastructure.”
In that scenario, Bitcoin may benefit indirectly as the benchmark asset within a larger digital-asset allocation framework.
6. Global Macro and Allocation Checkpoints
6-1. Rates and Liquidity
Bitcoin remains liquidity-sensitive. Fed easing expectations, USD trends, and broad financial conditions remain relevant. The present decline, however, appears more attributable to crypto-specific structural demand shifts than to macro alone.
6-2. Relative Attractiveness Versus US Equities
The key variable is relative performance and risk-adjusted return potential. If AI/semiconductor equities continue to validate earnings strength, crypto may struggle to regain “high-beta leadership” in global portfolios without a differentiated catalyst.
6-3. FX Considerations for Korea-Based Investors
For KRW-based investors, FX materially affects realized returns. USD strength can raise demand for dollar-denominated assets and alter relative attractiveness across US equities and digital assets. Bitcoin’s USD price and KRW experience can diverge; FX must be incorporated into performance assessment.
7. Investor Framework: What to Monitor Now
Key indicators to track:1) Whether ETF flow trends inflect back to sustained net inflows
2) Whether overhang from large-holder selling narratives dissipates
3) Whether AI-to-blockchain linkages translate into monetizable business models
4) Whether stablecoin and RWA growth improves market trust and infrastructure credibility
5) Whether relative attractiveness versus US equities improves
8. Underappreciated Point: Bitcoin’s Identity Is Evolving
The critical issue is not a single bearish catalyst but a shift in Bitcoin’s identity. As Bitcoin succeeded in achieving institutional legitimacy, part of its decentralization premium and “outside-the-system” appeal was diluted.
A potential replacement narrative is functional rather than ideological: blockchain as settlement infrastructure for AI-era automation (real-time distribution, machine commerce, programmable payments). If this use case scales, the digital-asset cycle may rebase around infrastructure adoption rather than halving-driven reflexivity.
9. Conclusion: Elevated Fear, but Clear Conditions for Reversal
The recent Bitcoin decline is best characterized as a multi-factor event:
- Capital rotation toward AI/semiconductors
- Confidence shock from symbolic large-holder selling narratives
- ETF inflow deceleration
- Institutionalization reducing decentralization premium
- Stablecoins taking transactional share and narrowing Bitcoin’s utility narrative
A durable recovery would likely require renewed ETF-driven institutional demand, clearer differentiation in Bitcoin’s role, and credible adoption catalysts such as AI agent economies and RWA expansion.
< Summary >
- The core drivers of Bitcoin weakness are crypto-market structural changes rather than macro stress alone.
- Capital shifted toward AI/semiconductor equities; selling narratives disrupted sentiment; ETF inflows slowed.
- Institutionalization improved legitimacy but reduced decentralization-driven appeal; stablecoins gained transactional dominance.
- Recovery conditions include renewed ETF inflows, differentiated role clarity, AI agent–blockchain integration, and broader RWA adoption.
[Related Articles…]
- https://NextGenInsight.net?s=Bitcoin
- https://NextGenInsight.net?s=AI
*Source: [ Jun’s economy lab ]
– 비트코인이 하락한 진짜 이유, 다시 오르려면 필요한 것