● Bitcoin-Rebound, Won-Crisis, AI-Chip-Surge
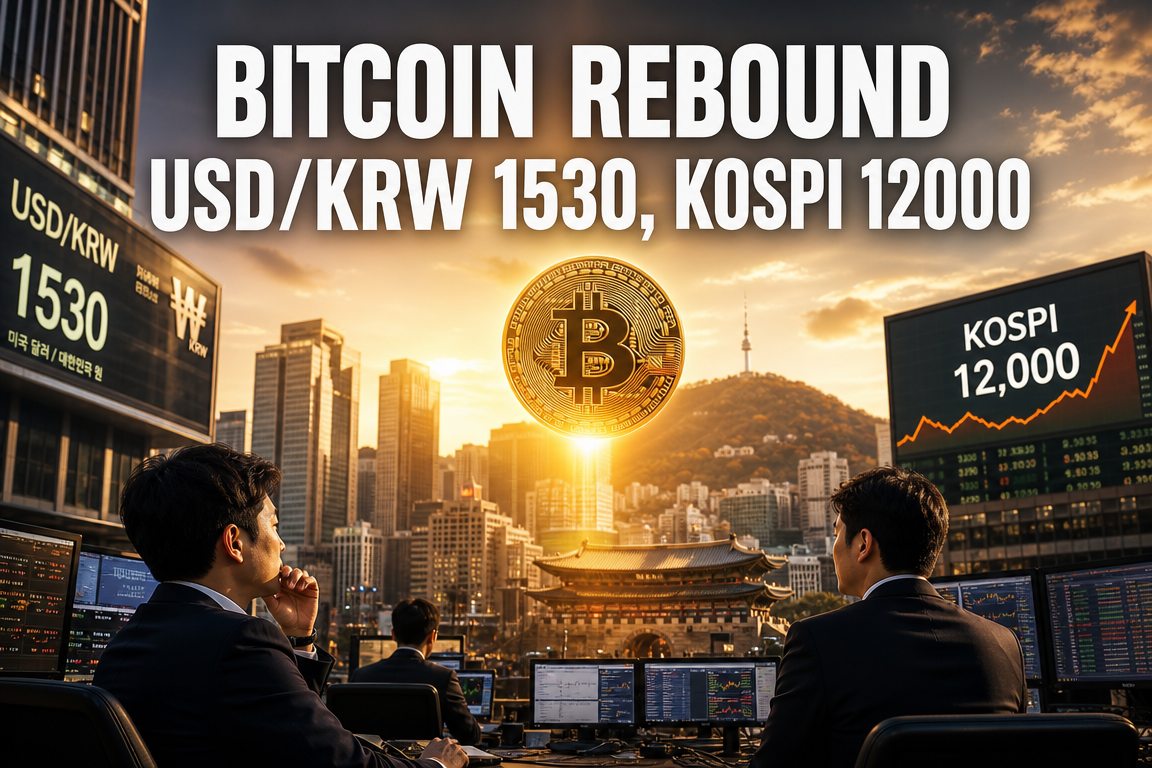
Bitcoin rebound from USD 65,000, USD/KRW breaks 1,530, and Goldman’s KOSPI 12,000 scenario: the core signals that matter now
Markets appear slightly lower on the surface, but internal dynamics are materially different.
Bitcoin sold off to USD 65,000 and rebounded.
USD/KRW moved above 1,530.
In U.S. equities, sector concentration intensified more than index-level moves suggest.
Geopolitics in the Middle East, the Fed’s rate path, AI semiconductor-led flows, and structural shifts in Korean equities must be assessed as a single connected system to understand current risk positioning.
This report consolidates:
- The implications of Bitcoin’s sell-off and rebound
- Why KRW weakness is a more serious macro constraint than commonly framed
- Why stronger U.S. labor data is being priced as higher rate risk
- AI semiconductor positioning around Broadcom and Marvell
- Why a KOSPI upcycle can represent both opportunity and risk
A key focus is the end destination of liquidity flows, rather than headline index levels.
1. Global equities at a glance: indices flat-to-down, underlying risk is higher
U.S. indices did not show a severe drawdown:
- Nasdaq down
- S&P 500 weaker
- Dow slightly lower
- Russell 2000 notably weaker
This indicates a market supported primarily by mega-cap technology and AI semiconductors rather than broad-based participation.
Index resilience may be misleading. Small- and mid-cap equities and rate-sensitive sectors are already under greater pressure.
2. Bitcoin rebound from USD 65,000: potentially a signal of liquidity rotation, not merely a technical bounce
Bitcoin fell to USD 65,000 intraday before rebounding.
Ethereum also declined to around USD 1,800 and rebounded.
While this can be framed as a technical rebound, it may also serve as a leading indicator of shifting liquidity preferences.
2-1. Drivers of the drawdown
1) Persistent USD strength
A high dollar index increases valuation pressure on risk assets such as crypto.
2) Rate pressure
Markets continue to price a slower path to Fed easing.
3) Liquidity concentration into AI semiconductors and mega-cap tech
Capital outflows from crypto may be partially reallocating toward semiconductors and large-cap technology where earnings visibility is higher.
2-2. What the rebound may imply
Holding and rebounding from USD 65,000 suggests risk appetite has not fully reversed.
However, the regime appears to be shifting from synchronized rallies (crypto up and equities up) to a more selective market with stronger prioritization of specific themes.
Crypto remains supported, but market leadership is currently stronger in AI semiconductors.
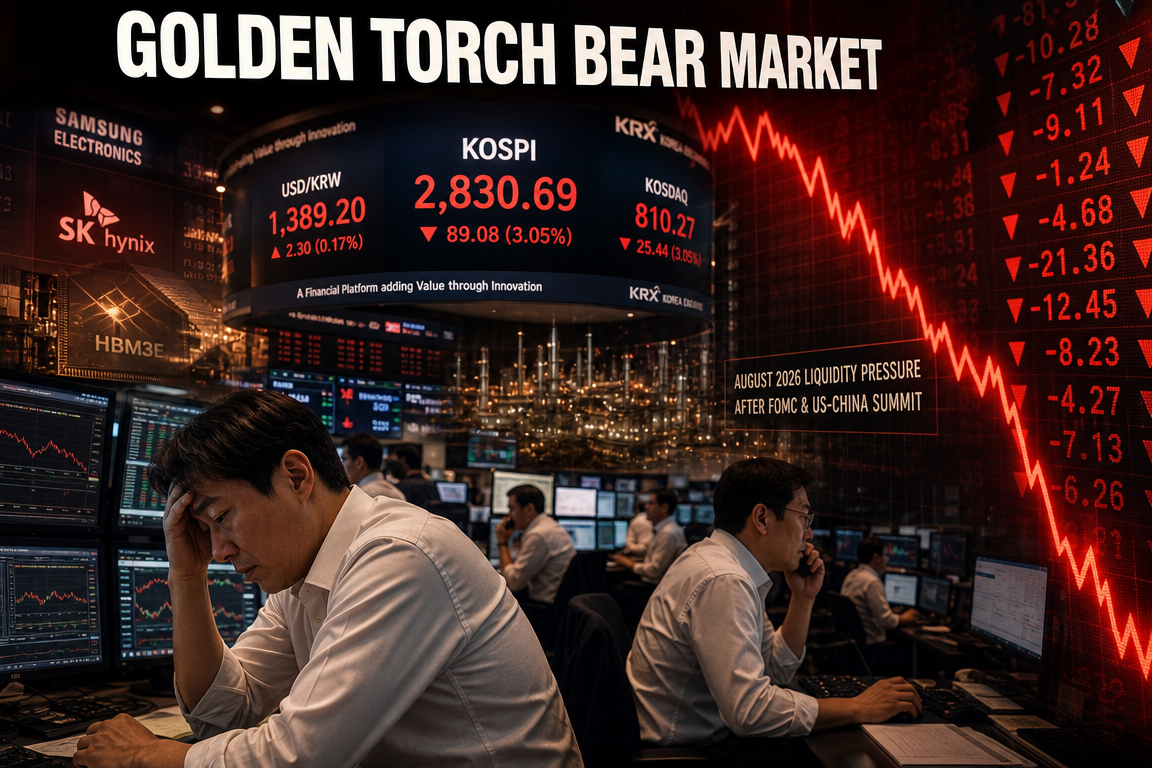
3. USD/KRW above 1,530: a direct and practical constraint on Korea’s macro and financial conditions
USD/KRW moving above 1,530 is not only a psychological threshold; it signals broader pressure on Korea’s overall pricing and financial conditions.
3-1. Key drivers
Foreign selling is a partial explanation. The core drivers are:
- Sustained USD strength
- Oil pressure driven by Middle East risk
- The possibility of higher-for-longer U.S. rates
Given Korea’s high energy import dependence, simultaneous increases in oil and FX rates amplify the shock. Broader Asian FX weakness also limits KRW’s ability to decouple.
3-2. Why Korean equities are holding up
The apparent disconnect between FX stress and equity resilience reflects a structural shift.
Korean equities are increasingly treated as core infrastructure within the AI semiconductor value chain:
- Samsung Electronics
- SK Hynix
- Advanced semiconductor equipment and materials ecosystem
This reduces the explanatory power of a simple emerging-market risk-off discount.
3-3. Why FX remains a risk
Equity resilience is driven by export and semiconductor strength; USD/KRW at 1,530 is not a benign signal.
Risks include:
- Higher import prices
- Higher corporate input costs
- Lower real household purchasing power
- Broader domestic asset-market instability
If elevated FX levels persist, the impact can extend to:
- Bank of Korea policy constraints
- Domestic consumption
- Real-estate sentiment
4. Middle East risk and oil: markets are more sensitive to de-escalation signals than escalation headlines
Comments related to Iran and nuclear negotiations provided market-relevant signals, but the regional situation remains complex with multiple actors involved.
Markets appear less reactive to incremental escalation headlines and more reactive to credible de-escalation pathways.
4-1. Primary transmission channel
The key risk is not geopolitics per se, but inflation re-acceleration via persistent oil strength.
If WTI and Brent remain elevated, the Fed’s stance is more likely to remain hawkish. The core linkage is oil-to-inflation-to-rates.
4-2. Key indicators to monitor
- Any actionable developments around the Strait of Hormuz
- Shifts in working-level messaging on Iran nuclear negotiations
- Intensity of clashes between Israel and surrounding armed groups
- Whether oil breaks higher from the mid-USD 90s range
These factors can influence both global growth expectations and equity risk premia.
5. ADP employment upside surprise: positive growth signal, negative rate signal
May ADP private payrolls exceeded expectations, indicating resilience in U.S. activity.
However, in the current regime, stronger labor data is being priced as higher rate risk.
5-1. Why good data is treated as a headwind
Market focus is centered on the Fed’s path rather than growth alone.
Stronger employment reduces the urgency for rate cuts. With inflation risks still present, delayed easing (and renewed tightening speculation at the margin) increases discount-rate pressure on equities.
5-2. Composition matters
The more relevant issue is job composition, not just headline growth.
Labor dynamics show increasing bifurcation:
- White-collar sectors (big tech, finance, media) face restructuring and AI-driven automation
- Service and blue-collar sectors (healthcare, leisure, dining, construction) remain tight
Rising employment does not necessarily imply growth in higher-wage, higher-productivity jobs. This is relevant for assessing consumption quality, productivity, and labor-market restructuring in an AI-driven economy.
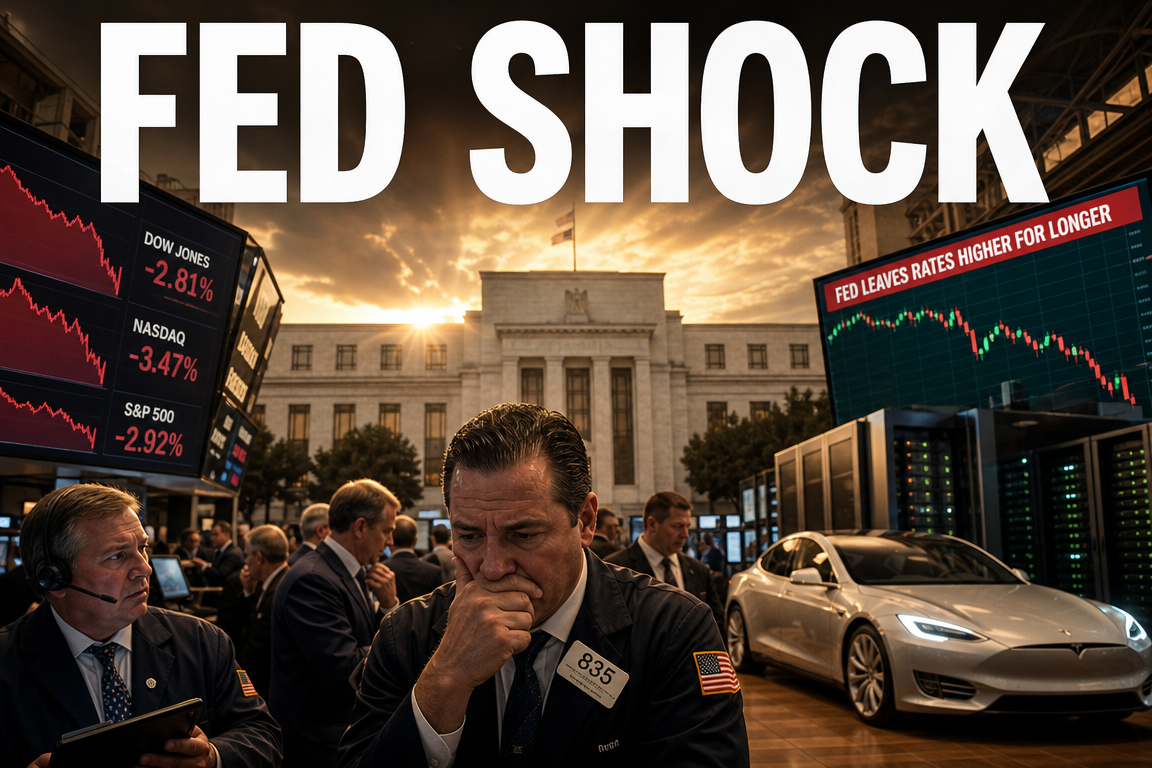
6. Fed and rates: markets are re-pricing a higher-for-longer regime
Based on recent indicators (including Beige Book tone, labor data, oil, and inflation), markets are increasingly pricing a prolonged restrictive stance.
This raises sensitivity across both equity and fixed income markets.
6-1. Equity implications
Higher rates are broadly negative for equities, particularly:
- Levered small- and mid-caps
- Traditional cyclicals
- Companies with elevated refinancing needs
This aligns with the weaker Russell 2000.
By contrast, select mega-cap tech and AI infrastructure names may remain more resilient due to:
- Strong cash generation
- Better funding capacity
- Demand linked to structural capex rather than short-cycle consumption
This can intensify concentration: broader market volatility rises while capital migrates toward the clearest growth and earnings narratives.
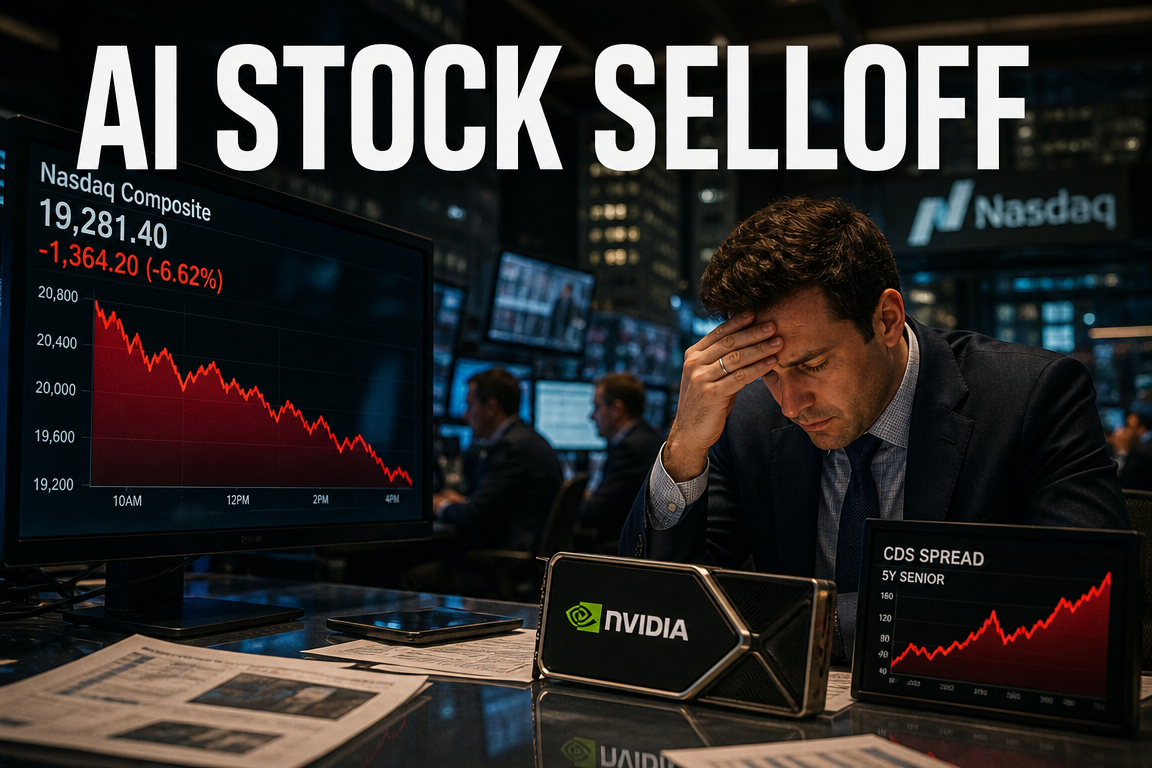
7. AI semiconductors remain the central theme: Broadcom, Marvell, and the post-Nvidia battleground
AI semiconductors continue to be the dominant industry driver.
Broadcom’s upcoming earnings and Marvell’s strength tied to custom silicon expectations are key near-term checkpoints.
The market focus is shifting from Nvidia alone to the breadth of beneficiaries across the AI hardware stack.
7-1. Why Broadcom is a key indicator
Broadcom is a core node in AI infrastructure expansion across:
- Custom silicon
- Networking
- Data-center chips
- Partnerships tied to hyperscaler accelerators (including TPU-related ecosystems)
Its earnings are a test of whether the AI capex cycle is broad-based rather than single-company driven.
7-2. Marvell and the significance of custom silicon
Marvell’s performance signals increasing segmentation of AI semiconductor exposures beyond GPUs into:
- ASICs
- Networking
- Power management
- Memory
- Advanced packaging
- End-to-end data-center infrastructure
This supports the view that AI is restructuring capital expenditure patterns across industries.
7-3. Spillover into power infrastructure
Data-center expansion increases demand beyond chips:
- Power
- Cooling
- Utilities
- Transformers
- Electrical equipment
- Construction
Resilience in utility and electrical equipment names aligns with AI-related infrastructure buildout.
AI is increasingly a physical, energy-intensive investment cycle, not only a software theme.
8. The KOSPI 12,000 scenario: how to interpret it
The Goldman Sachs KOSPI 12,000 scenario is notable for its magnitude. The key is the underlying framework, not the headline number.
8-1. Drivers behind the bullish scenario
- Korea’s central role in the AI semiconductor supply chain
- Memory-cycle recovery and higher value-added semiconductor demand
- Potential for foreign investor re-rating of Korea
- Index “scale-up” and valuation re-rating expectations
This reflects a shift from viewing Korea as a generic cyclical manufacturing market toward a strategic AI-era production hub.
8-2. Risks that must be evaluated concurrently
The upcycle appears strong but narrow, with increasing leverage-driven momentum and significant semiconductor concentration.
Key risk factors:
- FX
- Oil
- Rates
- Foreign flows
A shift in any single factor can produce outsized volatility at the stock level even if index moves appear contained.
9. SpaceX indicated price around USD 135: implications for liquidity
Reports of SpaceX pricing around USD 135 suggest elevated valuation appetite for large private technology assets.
The more relevant issue is liquidity allocation: if major private innovators (e.g., OpenAI, Anthropic, SpaceX) absorb incremental capital, liquidity conditions within listed equity markets may be affected.
Current positioning suggests the near-term impact is manageable relative to total market capitalization, with greater importance placed on the directional trend of capital concentration into frontier industries.
10. Market psychology through single-name moves
Single-stock performance provides a clearer read on risk appetite:
- Nvidia down: profit-taking and consolidation
- Intel up sharply: re-rating expectations and short covering characteristics
- Oracle and Palantir weaker: increasing differentiation within AI software
- Meta rebound: continued preference for strong cash-generative mega-caps
- Utilities and power-related names firm: ongoing AI infrastructure tailwinds
Core takeaway: AI exposure remains in demand, but dispersion is rising and indiscriminate buying is fading.
11. The most important point: this is not an index market; it is a liquidity-destination market
11-1. Liquidity is concentrating into the narrowest set of perceived “highest-conviction” assets
Headline narratives focus on index changes, crypto moves, or FX levels in isolation. The more relevant variable is where liquidity ultimately concentrates.
In periods of uncertainty, liquidity is not broadening; it is compressing into:
- AI semiconductors
- Mega-cap technology
- Data-center power infrastructure
11-2. Bitcoin weakness and semiconductor strength may be competing allocations
Within risk assets, prioritization is increasing.
Some capital outflows from crypto may be reallocating to AI semiconductors with more visible earnings and capex-linked demand. This reflects a shift from narrative-driven positioning toward cash-flow and capex validation.
11-3. KRW weakness may reflect a structural transition, not a simple Korea risk-off signal
Historically, FX stress would be expected to translate into broad Korean equity weakness. Current dynamics show a partial decoupling driven by semiconductor export strength.
This is both:
- A positive signal of strategic industrial positioning, and
- A risk signal of high concentration and sensitivity to external variables
12. Near-term calendar and key checkpoints
- Broadcom earnings: confirmation of AI semiconductor breadth
- Fed Beige Book: internal assessment of growth and inflation
- Nonfarm payrolls: potential re-pricing of the rate path
- Additional Middle East developments: direct influence on oil and inflation expectations
- USD/KRW trend: a key variable for Korea risk and domestic financial conditions
13. Investment framing
This market cannot be categorized simply as bull or bear. A more functional segmentation:
- Broad market: higher volatility risk due to rates and oil
- AI semiconductors: still the primary leadership segment
- Crypto assets: rebounds possible, but may lose priority in liquidity allocation
- Korea equities: semiconductor-led strength alongside meaningful FX risk
- Small caps: relatively vulnerable under higher-for-longer rates
The core variable is not “what to buy,” but “where liquidity is most likely to remain anchored.” Current evidence continues to point to AI infrastructure, semiconductors, power, and the USD/rate complex.
< Summary >
Bitcoin rebounded after testing USD 65,000, but leadership remains in AI semiconductors.
USD/KRW above 1,530 is a material macro constraint, while Korean equities show differentiated resilience driven by semiconductor competitiveness.
Stronger U.S. labor data reduced rate-cut expectations and increased discount-rate pressure.
Broadcom and Marvell are key checkpoints for AI semiconductor breadth beyond Nvidia.
The dominant market feature is liquidity concentration, with the primary destinations in AI semiconductors and power infrastructure.
[Related links…]
- https://NextGenInsight.net?s=bitcoin
- https://NextGenInsight.net?s=semiconductor
*Source: [ Maeil Business Newspaper ]
– 비트코인 6만5천불까지 밀렸다가 반등ㅣ골드만, 코스피 목표치 1만2000ㅣ스페이스X 공모가 135달러 고정 보도ㅣ홍키자의 매일뉴욕