● Tesla Semi Mass Production Shock, Savings, AI Logistics Gamechanger
Tesla Semi Enters Volume Production: The Investment Case Now Requires Quantitative Validation
After nine years of delays, the Tesla Semi has entered the “volume production” phase.
This development is not merely an additional vehicle launch.
It intersects with EV market expansion, structural cost changes in logistics, the energy transition, the commercialization path for autonomous driving in freight, and potential incremental catalysts for Tesla’s equity narrative.
This report focuses on why the Semi matters at this point in time; why the economic gap versus diesel trucks is increasingly salient; why an “asset-light, truck-as-a-service” approach could be more disruptive than direct vehicle sales; and key considerations that remain under-discussed.
The core issue is less about “truck sales” and more about the early formation of a service-based operating model for freight logistics.
1. Key News Summary
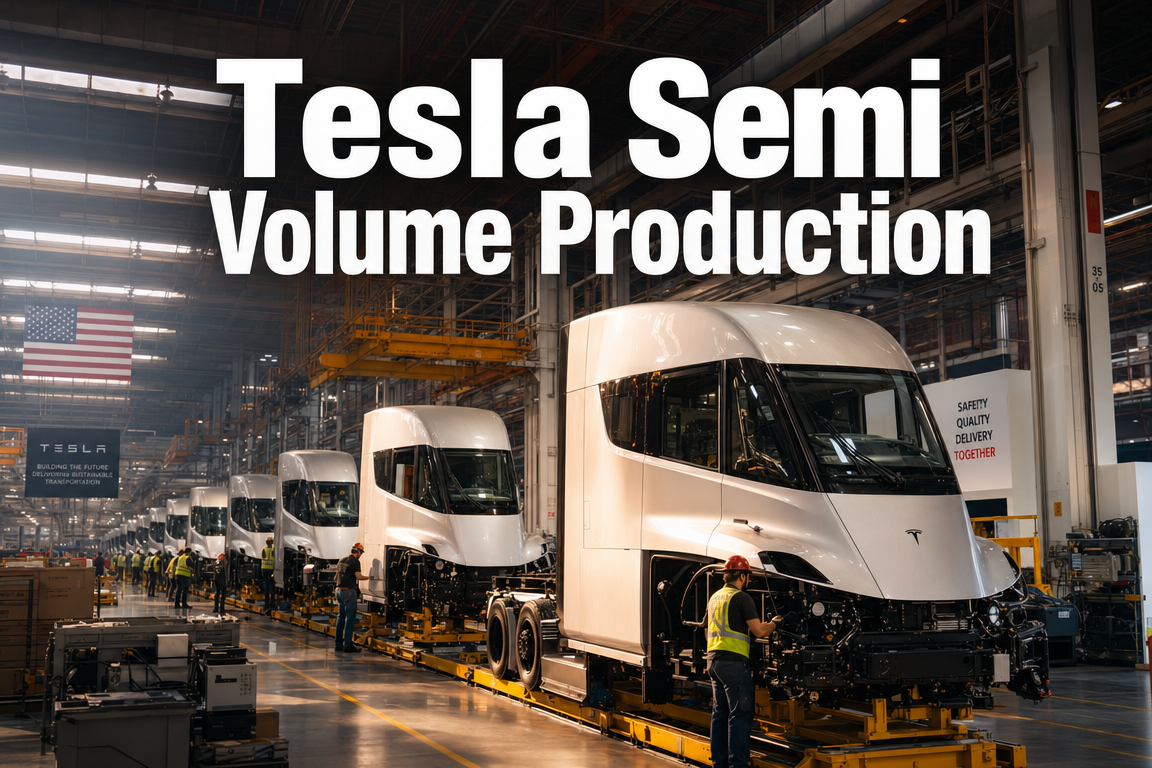
Tesla stated that the first 2026-model-year Tesla Semi production unit passed through the line at its dedicated Nevada Semi factory.
This indicates a shift from pilot assembly toward an industrialized production system.
Since the 2017 reveal, production timelines repeatedly slipped, and the 2022 PepsiCo deliveries were effectively pilot-scale.
The current ramp is tied to: a dedicated facility, a long-term target of 50,000 units annually, 4680 battery cells, a transition to a 48V architecture, Megacharger-based charging, and emerging service-oriented commercial offerings.
The announcement should be interpreted as the Semi program moving onto a more executable business trajectory, rather than simply “starting production.”
2. Why Volume Production Matters
2-1. Tesla’s First Full-Scale Entry into the Commercial Vehicle Market
Tesla revenue has been concentrated in passenger vehicles, led by Model 3 and Model Y, with a growing energy segment.
The Semi is the first material step into heavy-duty commercial mobility.
The North American Class 8 market is estimated at approximately 250,000 to 300,000 units per year.
A long-term production goal of 50,000 units implies targeting roughly ~20% of the market.
This reflects strategic positioning rather than a limited experiment.
2-2. Expansion Toward Logistics Infrastructure and Services
The Semi economics extend beyond selling a vehicle.
The operating model connects charging infrastructure, battery supply, power procurement and management, software, fleet management, and potential autonomous operation.
This structure aligns more closely with a platform and infrastructure model than a conventional OEM-only model.
Accordingly, this is both an EV industry event and a logistics digitization/infrastructure transition event.
3. Facility and Technology: What Has Changed
3-1. Nevada Semi Factory: Built for Scale
Production is occurring in a dedicated facility separate from Gigafactory Nevada.
The site is approximately 1.7 million square feet, often described as roughly the size of ~22 soccer fields.
The footprint implies an expansion-capable production hub rather than a limited assembly line.
3-2. 4680 Cells and 48V Architecture as Core Enablers
The 2026 Semi is reported to be ~1,000 pounds (~450 kg) lighter than prior configurations.
Two key drivers are cited:
First, the transition to a 48V low-voltage architecture.
Second, adoption of Tesla’s 4680 battery cells.
Weight reduction is economically material in heavy-duty freight because it improves efficiency and can enhance payload utilization.
For Class 8 operations, total cost of ownership and real-world freight productivity typically matter more than headline range.
3-3. Steering System Evolution for Commercial Requirements
A move from hydraulic steering to an electric actuator-based steering system has been noted.
This is consistent with Tesla’s broader direction, including learnings applied in other platforms.
Eliminating hydraulic pumps and fluid systems supports both weight reduction and maintenance simplification.
While not necessarily full steer-by-wire, this can be viewed as an intermediate step toward autonomy-oriented commercial platforms.
3-4. Ten External Cameras and Explicit Autonomy-Oriented Design Language
The addition of 10 external cameras improves visibility and perception coverage.
More notably, Tesla has described the Semi as “designed for autonomy.”
This positions the platform for potential future use cases such as FSD-enabled freight operations, platooning, partial driver-out workflows, and hub-to-hub automation.
4. Performance and Operating Economics
4-1. Range and Power
Disclosed targets include approximately 500 miles for the long-range version and 325 miles for the standard-range version.
Range is referenced at an 82,000-pound gross combined weight condition.
A tri-motor rear drivetrain with up to ~800 kW of power has been reported.
The positioning is performance-competitive and intended to be operationally substitutable for diesel in relevant duty cycles.
4-2. Why 1.2 MW Megacharging Is Operationally Material
The Semi supports a 1.2 MW Megacharger system, with messaging indicating ~60% charge in ~30 minutes.
This aligns with U.S. hours-of-service rules that require a 30-minute break after 8 hours of driving.
The objective is schedule compatibility rather than consumer-style “fast charging” benchmarks.
4-3. Power Sharing for Refrigerated Freight as an Underappreciated Advantage
The Semi is reported to support power sharing to supply electricity to refrigerated trailers.
This can reduce or eliminate the need for separate diesel-powered refrigeration units, lowering fuel and maintenance costs.
This feature may be particularly relevant for large retail and cold-chain operators.
5. Pricing: High Upfront Cost, but TCO Requires Full Accounting
5-1. Purchase Price Remains Elevated
Reported pricing is approximately $290,000 for long range and $260,000 for standard range.
A typical diesel Class 8 truck is often cited around $175,000 to $180,000, implying a higher upfront cost for the Semi.
5-2. Relative Pricing Versus Other Electric Semis
If competing electric heavy truck pricing averages near ~$435,000, the Semi would be positioned materially below peers by more than ~$140,000.
5-3. Fuel/Energy Cost Differential Is Central
Higher diesel prices increase the economic attractiveness of electrified freight.
A cited diesel average of $5.464 per gallon and a ~54% year-over-year increase have been referenced in the analysis.
For ~130,000 miles per year in short-haul operations, annual diesel fuel expense can be estimated at approximately ~$118,000.
Comparable electric energy cost for the Semi is estimated around ~$27,000 to $40,000.
This implies potential annual energy savings of roughly ~$70,000 to $90,000, which could shorten payback of the upfront price premium.
Sustained high oil prices and inflation generally strengthen the electrification TCO case; a sharp decline in oil prices could weaken near-term adoption incentives.
6. The Larger Shift: Truck Subscription / Service Models
6-1. Beyond Unit Sales
A notable development is a plan by Arrias to offer Tesla Semi access via a SaaS-style structure.
The proposed model bundles vehicle access with charging infrastructure and energy supply under a monthly fee, reducing the need for outright purchase.
This represents a shift from product sale toward service-based freight infrastructure.
6-2. Why This Matters
The main barrier to electric truck adoption is not only vehicle price but also charging infrastructure capex.
One estimate indicates that building depot charging capacity for ~40 to 60 vehicles at a mid-sized warehouse could cost approximately $15.4 million.
A subscription bundle can reclassify large initial capex into operating expense, potentially accelerating adoption decisions.
6-3. Parallels to Mobility-as-a-Service Logic
The broader thesis resembles a shift from ownership to service consumption in transportation.
In freight, this could translate into fleets subscribing to operating capacity rather than owning assets outright.
If scaled, recurring revenue characteristics may incrementally influence valuation frameworks, though execution evidence is required.
7. Opportunities and Risks
7-1. Opportunity Set
1) Incremental revenue streams: commercial vehicles, charging, energy services, and software-enabled fleet management.
2) Competitive intensity: key competitors remain capacity-constrained; some entrants have lost momentum.
3) Demand signals: application data from California’s HVIP incentive program reportedly show a meaningful share for the Semi, indicating customer interest.
4) Macro support: high fuel costs, tighter emissions rules, and decarbonization pressure support electrified freight adoption.
7-2. Key Risks
1) Production ramp uncertainty: the long-term target is 50,000 units annually, while near-term deliveries have been discussed in the 5,000 to 15,000 range, implying a multi-year scale-up.
2) Commercial-market requirements: durability, serviceability, uptime, and utilization are decisive; real-world performance and support capability require further validation.
3) Charging bottlenecks: insufficient Megacharger deployment could constrain utilization and adoption even if vehicle production rises.
8. Why the Next 3 Months Matter for Investors
8-1. 90-Day Limited Contract Window
Arrias’ Semi program is reported to include a 90-day limited contracting period following a May 4 announcement.
By late July to early August, early demand indicators may become observable.
These metrics may be more informative than reservations because they reflect willingness to adopt a recurring-fee structure.
8-2. Potential Read-Through in Q2 Results
Q2 reporting may provide initial signals on Semi-related revenue, ramp commentary, and charging infrastructure investment.
Markets typically require measurable throughput: production volume, conversion to orders, energy attach rates, and installation pace.
8-3. Oil and Diesel as a Secondary Catalyst
Sustained high diesel pricing strengthens the operating-cost argument.
A rapid decline in oil could reduce near-term economic urgency.
The Semi therefore links technology execution with energy-price dynamics.
9. Issue Brief: Core Takeaways
– Tesla announced the first volume-production unit from the dedicated Nevada Semi facility.
– The program is transitioning from pilot-scale activity toward a scalable production posture after multiple delays since 2017.
– The 2026 Semi incorporates 4680 cells, a 48V architecture, electric steering, and 10 external cameras.
– Target configurations include 500-mile long range and 325-mile standard range, with 1.2 MW Megacharger support to improve operational feasibility.
– Higher diesel prices improve the Semi’s total cost of ownership profile.
– Subscription-style offerings could reduce adoption friction by bundling vehicles, infrastructure, and energy as a service.
– The next three months may provide early evidence on contracts, ramp pace, and potential financial reporting implications.
10. Under-Discussed Strategic Implications
The key issue is not that the Semi is finally in production; it is that Tesla may be extending from vehicle manufacturing into an integrated model spanning energy, infrastructure, software, and operations.
Three implications are notable:
First, the Semi can tightly couple Tesla’s automotive and energy businesses, as commercial fleets require larger-scale charging and power management than passenger vehicles.
Second, a subscription model tests whether manufacturing revenue can shift toward recurring revenue characteristics, which may affect revenue quality and cyclicality.
Third, the Semi may serve as a practical testbed for autonomous freight, where fixed routes and repeatable operations could support earlier monetization than consumer robotaxi deployments.
11. Conclusion
The start of volume production is unlikely to immediately transform reported financials at scale.
However, the strategic relevance lies in whether the Semi can become a bridge into commercial transport, energy infrastructure, subscription-based operations, and autonomous logistics.
The primary metric to monitor is not unit production alone, but whether customers realize measurable operating-cost reductions and translate that experience into repeat orders and scaled deployments.
< Summary >
The Tesla Semi has entered volume production after a prolonged development cycle.
The investment significance extends beyond a vehicle launch to commercial transport, charging infrastructure, energy operations, subscription-style deployment, and autonomous logistics optionality.
Rising diesel prices strengthen the operating-economics case, and service-based adoption models could reduce upfront capex barriers for fleets.
The next three months are relevant for early evidence on contracts, ramp progress, and financial disclosure signals.
The central thesis is the electrification, servicification, and automation of logistics systems rather than incremental truck sales.
[Related]
Tesla Earnings and Share Price Dynamics: Key Indicators to Monitor Next Quarter
*Source: [ 오늘의 테슬라 뉴스 ]
– 테슬라가 오늘 처음으로 “됐다”고 말했다 — 9년 기다린 Semi 대량생산, $381 투자자는 언제 체감하나?
● Gold Shock, Dollar Surge, Oil War
Why Did Gold Fall Despite a War? A Consolidated Framework Covering the USD, Oil, Central Banks, and the Underlying Policy Calculus
This episode cannot be explained by the simplistic rule of “war equals higher gold.” The dominant driver was the energy-payment channel and the associated surge in immediate USD funding demand.
This report summarizes: (i) why gold corrected despite elevated Middle East risk, (ii) why the USD strengthened, (iii) why oil, U.S. Treasury yields, and gold must be assessed jointly, (iv) why central-bank gold purchases temporarily softened, and (v) how these dynamics connect to U.S. reshoring, energy leverage, and supply-chain reconfiguration.
1. Key development: why gold fell despite the outbreak of war
Geopolitical escalation in the Middle East typically supports gold. In this case, gold corrected while the USD strengthened.
The appropriate interpretation is that this conflict directly raised perceived risk around the Strait of Hormuz and global crude supply, making “energy settlement and USD liquidity” more immediate than generic risk-off positioning.
2. Why the USD strengthened more than gold
A critical constraint remains: crude oil is still overwhelmingly invoiced and settled in USD.
When oil prices rise sharply, energy-importing economies and corporate importers require more USD immediately. In such episodes, the market prioritizes the USD as a settlement instrument over gold as a store of value.
As a result, some reserve managers and institutions may (i) slow incremental gold purchases to preserve USD liquidity, or (ii) in stressed circumstances, monetize part of their gold holdings.
3. Four factors explaining the gold pullback
3-1. Oil-price shock drove a rapid increase in USD demand
Disruptions around the Strait of Hormuz are priced first through crude supply risk.
Higher crude prices increase USD demand for settlement among importing countries. Economies with high energy import dependence tend to adopt more conservative reserve and liquidity management.
In that framework, gold functions as a long-horizon hedge, while USD functions as immediately deployable liquidity.
3-2. Gold was already priced for risk
Gold had appreciated materially into the event. Markets typically pre-price expected outcomes; once the event becomes realized, profit-taking often follows.
This pattern is recurrent across asset classes.
3-3. In realized conflict, USD liquidity preference strengthens within “safe assets”
In escalating risk phases, gold, USD, and U.S. Treasuries can all attract inflows. When conflict becomes operational, market participants often prioritize the most liquid instrument: USD.
Comparable dynamics were observed during the Russia–Ukraine war.
3-4. Higher oil can lift inflation expectations and pressure gold via yields
Oil-price increases raise inflation pressure and can push U.S. Treasury yields higher.
Because gold is a non-yielding asset, higher nominal and/or real yields can reduce its relative attractiveness.
In this episode, the gold correction is better explained by the interaction of oil shock, USD funding demand, and rising-yield expectations than by “weaker safe-haven demand.”
4. Why central banks bought less gold
Over recent years, central banks increased gold purchases to reduce reliance on USD assets and mitigate political and sanctions-related reserve risks.
Gold’s reserve-asset treatment improved under Basel III, reinforcing its role in official reserves.
In this episode, some official-sector demand was weaker than expected, plausibly due to:1) A higher near-term priority on USD liquidity amid energy and geopolitical stress; and
2) Tactical pacing (waiting/monitoring) and a shift toward higher cash-like allocations.
This does not imply a structural shift away from gold; it reflects liquidity priorities under the prevailing shock.
5. Why long-term gold demand may remain resilient
A short-term drawdown does not necessarily invalidate the longer-term trend.
De-dollarization pressures may continue to become more structured because USD assets, while dominant, are exposed to political and sanctions risk. Gold is not a liability of any sovereign and can serve as a neutral reserve asset.
Accordingly, the strategic role of gold as insurance against USD-system risk may persist even if it does not replace the USD.
6. Core backdrop: energy leverage and manufacturing reconfiguration
This is not only a “Middle East risk” story; it is also linked to U.S. energy leverage, reshoring, and global supply-chain restructuring.
6-1. U.S. policy tilt from finance-led globalization toward manufacturing capacity
A central objective of the Trump-style economic strategy is to rebuild domestic manufacturing employment via reshoring and friend-shoring.
Energy costs are a direct input to manufacturing competitiveness, not merely an inflation variable.
6-2. Europe and Asia are more exposed to energy shocks
Manufacturing-heavy economies (e.g., Germany, France, South Korea, Japan, China) are directly impacted by higher energy costs.
As in the post–Russia–Ukraine period, renewed Middle East energy stress can raise costs abroad and increase the relative attractiveness of U.S.-based production.
The U.S. holds a structurally stronger position on energy supply following the shale expansion.
6-3. Higher structural reliance on U.S. crude and LNG
As countries reduce reliance on Middle East supply, the share of U.S. crude and LNG can rise.
South Korea has already increased U.S. crude intake versus prior years. Europe materially expanded U.S. LNG reliance after reducing Russian gas.
This is intertwined with trade balances, tariff negotiations, security alignment, and industrial policy.
7. Why timing matters for the U.S.
Political calendars and economic outcomes reinforce the importance of manufacturing employment, energy exports, USD settlement dominance, and inflation management.
Ahead of major elections, messages tied to jobs, energy independence, and inbound investment are politically salient.
Assessment should distinguish stated policy rationales from the distribution of structural gains.
8. Competition among settlement systems: USD vs. gold vs. CNY vs. EUR
The global system remains USD-centric, but alternative settlement experiments continue.
China is expanding CNY settlement; Europe has explored USD-bypass mechanisms. In sanctioned trade corridors, non-USD methods (CNY, gold, clearing/offset structures) are used.
The U.S. monitors these trends because USD dominance supports sanctions capacity, diplomacy, global finance, the U.S. Treasury market, and energy trade.
This supports the long-run strategic rationale for gold as a reserve complement.
9. Is “weaponization of gold” occurring?
The more accurate framing is “strategic reclassification of gold.”
Gold is re-emerging as a state-level strategic asset amid sanctions risk, geopolitical fragmentation, and a shift toward a more multipolar monetary order.
This is less about short-term price forecasting and more about resilience: what sovereigns can rely on under stress. If USD access can be constrained, gold operates as a comparatively neutral buffer.
10. Investor checklist
10-1. Track gold jointly with the USD and oil
During geopolitical shocks, monitor the USD index, crude prices, and U.S. Treasury yields alongside gold. In oil-driven conflicts, the USD may react first.
10-2. Central-bank gold demand should be assessed structurally, not quarterly
Single-quarter fluctuations can mislead. The strategic trend of reserve diversification can remain intact.
10-3. Integrate manufacturing and energy policy into macro views
Rates and inflation are insufficient. Energy supply chains, U.S. industrial policy, tariffs, reshoring, and AI infrastructure investment interact.
Rising data-center buildout increases power demand, linking energy leverage to AI competitiveness.
11. Why the AI linkage is material
Geopolitics and energy are no longer solely “traditional industry” issues.
AI competitiveness depends on reliable, scalable power. Data centers, semiconductor fabrication, cloud infrastructure, and advanced manufacturing are electricity-intensive.
A sustained U.S. advantage in energy supply can support AI infrastructure scaling. Conversely, elevated energy costs in Europe and Asia can raise the cost of AI transition.
This positions Middle East energy risk as a variable that can affect AI investment paths, semiconductor supply chains, and advanced-industry location decisions.
12. Most important takeaway
The gold pullback should not be interpreted as a loss of gold’s safe-haven function.
Gold’s strategic role may remain intact, but immediate USD demand for oil settlement dominated in the short term.
The broader context may involve U.S. energy leverage, manufacturing reshoring, defense of USD settlement networks, and supply-chain restructuring.
Core statement: “Gold did not weaken structurally; USD liquidity and energy settlement took priority.”
13. Key variables to monitor
1) Whether Strait of Hormuz risk re-escalates
2) Whether oil stabilizes after a spike or becomes persistently elevated
3) Whether central-bank gold purchases re-accelerate
4) Whether growth in U.S. crude and LNG exports materially reshapes trade patterns
5) How the evolving energy order affects AI infrastructure investment and advanced manufacturing location
< Summary >
Gold fell despite Middle East conflict not because safe-haven demand disappeared, but because oil-driven USD settlement demand increased sharply.
Profit-taking after a pre-priced rally, USD concentration during realized conflict, and upward pressure on Treasury yields contributed to the short-term correction.
Structurally, reserve diversification and gold accumulation incentives may persist. The episode also intersects with U.S. energy leverage, manufacturing reshoring, supply-chain reconfiguration, and AI infrastructure competition.
The core issue is not gold alone, but the interaction among the USD, oil, energy leverage, manufacturing competitiveness, and the evolving industrial order.
[Related Articles…]
- Gold and the USD-Strength Paradox: Key Indicators When Safe Havens Diverge (NextGenInsight.net?s=gold)
- AI Infrastructure and Power Leverage: A Global Macro View in the Data-Center Era (NextGenInsight.net?s=AI)
*Source: [ 경제 읽어주는 남자(김광석TV) ]
– 전쟁 났는데 금값이 떨어진 진짜 이유 | 경읽남과 토론합시다 | 김창익 작가 [1편]