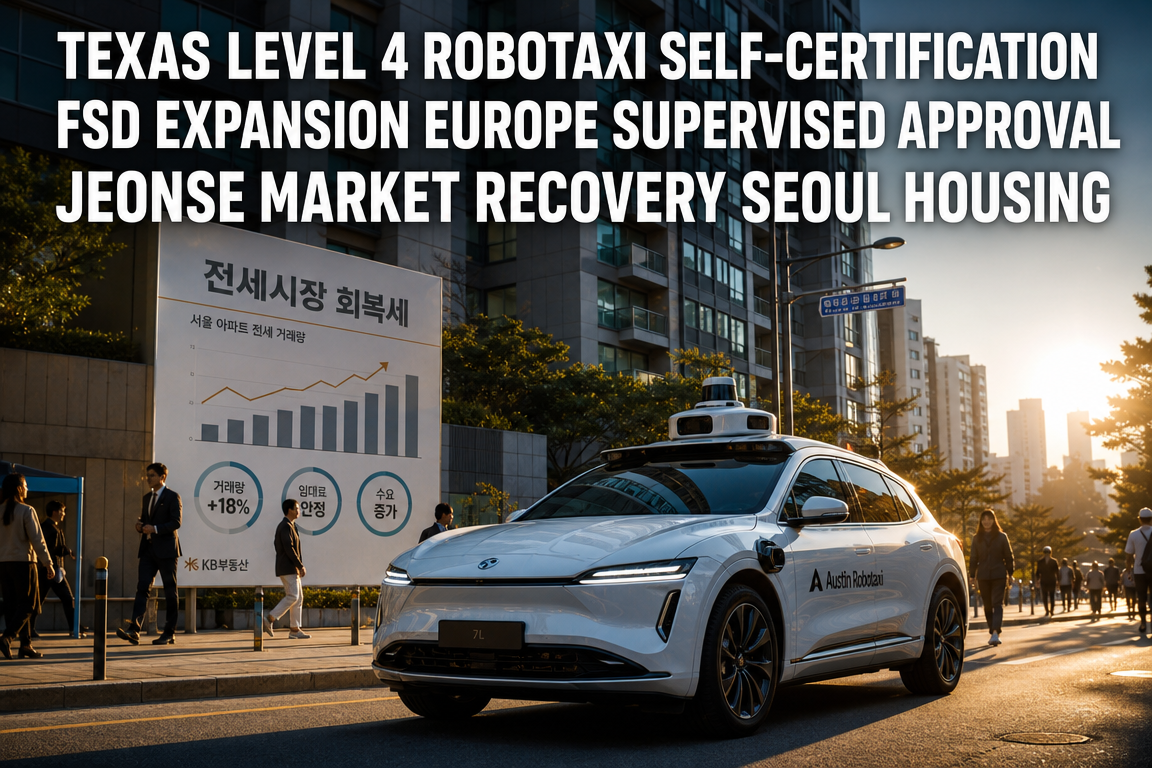
● Tesla Shockwave Texas Self-Certification, Europe FSD Surge, Canada No-Intervention Run, TSLA Slips at 435
Why the Market Looked Unmoved on the Day Tesla Effectively Signaled “We Assume Greater Responsibility”: Texas Level 4 Self-Certification, Faster-than-Expected FSD Expansion in Europe, a Hands-Off Cross-Canada Drive, and the Real Meaning of TSLA at $435
1. Market context: U.S. equities strong, Tesla lagged
U.S. equities traded firm, with the Nasdaq posting consecutive record highs amid improved risk sentiment. Reports tied to U.S.-Iran negotiations supported a decline in crude oil prices (WTI), easing inflation concerns and reinforcing expectations for potential rate cuts, typically supportive for growth equities. Political uncertainty remained given the absence of final approvals and formal confirmation, leaving room for renewed short-term volatility.
Despite the broader risk-on tone, Tesla closed at $435.79 (-1.43%). The stock retreated after reaching $442 the prior session, ending a six-session advance. Given the day’s headline flow, the move is better interpreted as positioning and near-term valuation discipline rather than a simple negative-news reaction.
2. Key Tesla headlines: positive catalysts, limited immediate price response
- Tesla self-certified its robotaxi software as Level 4 in Texas
- Completed required registration steps for commercial operation
- Estonia became the third European country to approve supervised FSD
- A cross-Canada drive using standard FSD reportedly achieved zero interventions across the full route
The limited equity response likely reflects the current market’s dominant narrative: AI infrastructure (GPUs, data centers, cloud, AI semiconductors, and scaled software platforms). Tesla’s autonomy progress is strategically material but is not yet as directly observable in quarterly revenue as AI infrastructure-linked businesses.
3. The critical development: Texas Level 4 self-certification as a business-model inflection
The key event is the effective date of Texas Senate Bill SB 2807. Tesla self-certified Level 4 and completed commercial autonomous vehicle registration on the law’s effective date.
3-1. Level 2 vs. Level 4: fundamentally different liability and operating models
Most consumer-facing Tesla FSD usage remains functionally aligned with Level 2 from a legal responsibility perspective: the human driver retains responsibility and must remain ready to intervene.
Level 4 differs materially. Within defined operational design domains, the system performs the complete driving task and must transition to a minimal risk condition without human intervention. Occupants are closer to passengers than drivers. This is primarily a liability and operating-structure shift, not a naming distinction.
3-2. The core issue is liability transfer, not technology alone
A widely underweighted aspect is Tesla’s movement toward a structure in which the company bears more direct responsibility. Historically, Tesla could frame responsibility around driver supervision. A Level 4 self-certification is an explicit corporate declaration that, in defined conditions, the system is capable of safe operation without human control—raising the probability that accident liability migrates toward the system provider.
Many autonomous driving developers can demonstrate performance, but become materially more conservative when legal responsibility meaningfully shifts. Tesla’s choice to certify immediately upon the law’s activation signals operational readiness beyond technical demonstration.
3-3. Regulatory bottleneck reduction: the strategic significance of SB 2807
In autonomy, regulation has often been as constraining as technology. Traditional approval pathways (e.g., California DMV and federal review) can require extended timelines.
Texas’s framework emphasizes self-certification coupled with requirements for registration, insurance, recordkeeping, and emergency-handling protocols. This reduces time-to-market under a model that places responsibility on the operator rather than extended pre-approval scrutiny. The competitive axis can shift from “who builds best” to “who scales operations fastest.”
3-4. Consumer vehicles do not become Level 4 by default
This certification does not imply immediate Level 4 status for consumer vehicles (e.g., Model 3, Model Y), nor does it remove the need for driver attention. The practical interpretation is that Level 4 applies to a robotaxi operating program, likely constrained by geofencing and highly curated operational domains. Consumer deployments remain differentiated in legal status and liability allocation.
4. “Was Tesla already operating driverless in Austin?” What changed is the legal framework
The meaningful change is not the existence of autonomy testing but the shift in legal framing and accountability. After Level 4 self-certification, Tesla becomes a clearer responsible party for defined autonomous operations. This can influence insurance pricing, claims handling, municipal negotiations, expansion permissions, and investor confidence.
This is a transition from “technology demonstration” to “commercial operating system.”
5. Post-Texas scalability: potential template for multi-state expansion
Texas provides a precedent. If the framework proves durable, other states with compatible approaches may adopt similar structures. This would shift Tesla’s robotaxi effort from local pilots to a repeatable, multi-jurisdiction expansion model.
From a valuation perspective, robotaxi economics introduce recurring revenue potential versus one-time vehicle sales, supporting the possibility of platform-style multiple expansion if commercial metrics emerge.
6. Europe is opening: Estonia’s supervised FSD approval as an acceleration signal
Estonia became the third European country to approve supervised FSD, following the Netherlands and Lithuania.
6-1. Why Europe appears to be accelerating
A common European pattern is that the first approval involves extensive validation, and subsequent countries accelerate by referencing prior assessments and outcomes. The Netherlands reportedly spent roughly 18 months on validation; later adopters appear to be moving faster. Parallel activity (public testing and reviews in additional countries) fits this diffusion dynamic.
6-2. Europe-wide implications and the late-June meeting
Market focus is on whether broader European discussions will translate into additional approvals. If the country-by-country cadence continues, FSD becomes a global scaling narrative rather than a U.S.-centric story, with potential long-term implications for software revenue, margins, and competitive positioning.
Constraints remain: early rollouts may prioritize Hardware 4 vehicles, while Hardware 3 fleets could face limitations, linking international monetization to hardware generation mix.
7. Cross-Canada zero-intervention report: a stronger maturity signal than controlled demos
A reported drive from near Vancouver to Halifax (~6,051 km) using standard FSD cited zero interventions over approximately 4 days and 21 hours.
Its relevance is that it reflects public-road variability rather than a constrained operating domain, including long highway segments and diverse regional conditions. While a single case does not establish system-wide safety, it is a high-signal indicator for perceived real-world capability progression.
8. Why the stock declined: interpreting $435
8-1. The market is prioritizing AI infrastructure over longer-dated autonomy monetization
Capital concentration remains strongest in AI infrastructure where revenue visibility is immediate. Autonomy progress may be strategically decisive but remains less directly tied to near-term financial statements.
8-2. Potential “priced-in” dynamics after a sharp run
Tesla had advanced materially from the $340s to the $440s. Some autonomy optimism may have been incorporated, increasing the probability of buy-the-rumor/sell-the-news behavior.
8-3. The market is waiting for commercialization metrics, not milestones alone
Investors are likely focused on measurable operating indicators:
- Number of robotaxis in service
- Pace of geographic expansion
- Revenue per trip
- Insurance performance and incident rates
- Number of states adopting enabling frameworks
- FSD subscriptions and software revenue growth
The Texas development clarifies direction; equity repricing likely requires validated numbers.
9. Hardware 3: a monetization constraint to monitor
Leading FSD performance is increasingly associated with Hardware 4. Hardware 3 remains a large installed base. Meaningful, scaled FSD revenue expansion likely requires a viable Hardware 3 pathway (e.g., a “light” version or alternative solution) to avoid constraining adoption and monetization.
10. Why SpaceX/Blue Origin developments can matter indirectly
Blue Origin’s New Glenn test anomaly and launchpad damage potentially strengthen SpaceX’s relative position, particularly under schedule pressure for Amazon’s Kuiper deployment. Separate reporting on U.S. Space Force-related tracking system contracts reinforces SpaceX’s role as a national-security-adjacent infrastructure partner.
While not directly tied to Tesla’s financials, these developments can influence the broader perception of the Musk ecosystem’s execution credibility and future capital market optionality.
11. Key takeaways (compressed)
- Tesla completed Level 4 self-certification and commercial registration in Texas on SB 2807’s effective date.
- The primary significance is a shift toward greater operator/system-provider responsibility.
- Consumer vehicles do not become Level 4; robotaxi operations remain structurally distinct.
- Texas’s model may reduce regulatory time-to-market, enabling faster scaling.
- Estonia became the third European country to approve supervised FSD, supporting a faster diffusion pattern.
- A reported cross-Canada zero-intervention drive signals maturation under uncontrolled conditions.
- TSLA’s pullback reflects AI infrastructure leadership, prior expectation build-up, and demand for commercialization metrics.
- $435 is better framed as a “verification and metrics” zone than a fundamental negative signal.
12. Under-discussed core point: liability transfer as the real inflection
Coverage often frames “Texas Level 4 certification” as a technology milestone. The deeper inflection is liability transfer. The industry’s most difficult step is not achieving strong demos but adopting an operating posture in which the company becomes the central accountable party for autonomous operation. Tesla has moved closer to that threshold.
Additionally, Tesla appears to be executing a regulatory strategy: launching in jurisdictions with structurally faster pathways while iterating the operating model. The $435 level reflects a market that is shifting from narrative to evidence-based validation.
13. Watch items
- Expansion of Texas robotaxi operations beyond Austin
- Adoption of similar legal frameworks by other states
- Additional European approvals following late-June discussions
- Delivery of a practical Hardware 3 FSD solution
- Disclosure of robotaxi operating data and unit economics
- Evidence of re-rating from EV manufacturer to AI-enabled mobility platform
< Summary >
Tesla’s Texas Level 4 self-certification represents entry into a higher-accountability operating regime, a meaningful step toward robotaxi commercialization. Europe is showing faster supervised FSD approval diffusion, with Estonia joining as the third approving jurisdiction. A reported hands-off cross-Canada drive adds a high-signal real-world maturity datapoint.
The muted equity response near $435 reflects market preference for AI infrastructure with immediate revenue visibility, potential expectation pre-pricing, and a demand for operational metrics (fleet size, expansion pace, unit economics, and safety/insurance performance). The Texas development is more likely to influence valuation through multi-quarter evidence rather than a single-session price move.
[Related]
- Tesla autonomy and robotaxi expansion outlook (NextGenInsight.net?s=Tesla)
- AI semiconductor rally and U.S. equity investment strategy summary (NextGenInsight.net?s=AI)
*Source: [ 오늘의 테슬라 뉴스 ]
– 테슬라가 처음으로 “우리가 책임진다” 선언 — 텍사스 레벨4 자체인증의 진짜 의미, $435 지금 어떻게?
● Housing Crunch
Why the Jeonse Market Has Dried Up: Structural Drivers Behind a Renewed Upside Bias in Greater Seoul Home Prices
The primary issue in the current market is not simply whether prices rise or fall.
This report consolidates: (i) potential additional adjustment risk in premium Seoul apartments, (ii) a gradual upward trend for mid-priced and lower-priced apartments in Greater Seoul, (iii) the likely recovery sequence for major regional metros, (iv) why the disappearance of jeonse listings is a more material risk than headline prices, and (v) how the post-2026 supply cliff is likely to materialize.
Rather than headline narratives (e.g., “Gangnam will fall” or “regional cities will rise”), the analysis links observed price action to credit regulation, holding-tax policy, construction-cost inflation, job-access demand, and rental-market imbalance.
The market is increasingly segmented by policy exposure and buyer financing capacity, rather than moving as a single national cycle.
1. Greater Seoul Housing Market (H1 2026): One-line Summary
H1 conditions reflect a market where policy objectives have had a measurable impact.
Policy pressure on ultra-premium assets, multi-homeowners, and leveraged buyers has reduced upside capacity for premium core-Seoul apartments relative to prior cycles.
Conversely, Seoul’s outer areas, mid-priced segments, and selected regional metros face comparatively less regulatory friction and remain within a price band accessible to end-users, supporting a gradual recovery bias.
Segmented view:
- Core Seoul ultra-premium: risk of additional adjustment
- Seoul mid-priced and older stock: gradual upward trend
- Greater Seoul end-user corridors: resilient tone
- Regional metro prime submarkets: bottoming followed by selective recovery
2. Why the Ultra-Premium Segment (e.g., Gangnam 3 Districts) May Remain Volatile
2-1. Policy targeting is explicit
For apartments above approximately KRW 2.0 billion, mortgage utilization is materially constrained, narrowing the buyer pool to high-liquidity households and reducing marginal demand depth.
2-2. Multi-owner supply and tax/financing pressure may rise in H2
In premium districts, multi-homeowners with meaningful financing exposure face refinancing and amortization burdens. Potential holding-tax policy changes may add pressure.
Capital gains tax can be deferred by holding; holding taxes and financing costs are recurring cash burdens.
As a result, H2 could see an increase in motivated listings, not only aspirational price cuts.
2-3. More likely outcome: downside pressure via discounted transactions, not a broad crash
A plausible pattern is selective discounting by urgent sellers, with transaction prints pulling indices lower even if broader sentiment does not reflect “panic selling.”
3. Why Seoul Mid-Priced Apartments and Older Stock May Be More Defensible
3-1. Affordability-driven substitution
Premium new-builds in core areas are increasingly inaccessible due to price levels and tighter credit. Demand rotates toward reasonably located but less appreciated older inventory as a substitute.
3-2. Volume improved without overheating
In several mid-priced districts, transactions increased without a corresponding surge in prices, consistent with end-user absorption rather than speculative overheating. This supports a base case of modest appreciation rather than sharp acceleration.
4. Structural Reasons Greater Seoul Prices Retain an Upside Bias
4-1. Demand concentration is more fundamental than supply shortage
While supply constraints matter, the dominant driver is continued migration of young cohorts into Greater Seoul. Even with slower population growth, household formation and fragmentation (e.g., single-person households) can sustain underlying housing demand.
As Seoul price levels rise, spillover demand into adjacent Greater Seoul markets can strengthen.
4-2. Job-access (“live near work”) premiums continue to expand
Regions anchored by high-quality job creation generate second-order effects (supplier ecosystems, retail, infrastructure), reinforcing residential preference. Semiconductor capacity expansion, advanced manufacturing, data centers, and AI infrastructure are key contributors.
This reflects the interaction between industrial restructuring, macro outlook, and housing demand.
4-3. Semiconductor wage/wealth effects are longer-duration
High-income compensation dynamics (bonuses, equity-based pay, multi-year income growth) can accumulate in financial assets and later recycle into owner-occupier demand, particularly within commuting distance of major campuses.
Potential beneficiary corridors include areas adjacent to Yongin, Hwaseong, Pyeongtaek, Bundang, and Pangyo.
5. How to Assess High-Potential Greater Seoul Submarkets
5-1. Bundang: expensive, but remains core
Bundang combines Pangyo employment proximity, education, mature infrastructure, and Seoul access. First-generation new-town redevelopment dynamics may sustain medium-term interest. Near-term expectations may already be partially priced in, implying timing sensitivity.
5-2. Areas adjacent to Yongin/Hwaseong: focus on less-repriced inventory
Beyond fully repriced core new-builds, some complexes remain accessible around sub-KRW 500 million price points. Submarkets tied to advanced-industry clusters may attract both end-user and investment demand.
5-3. Pyeongtaek: strong catalysts, but entry price discipline is critical
Pyeongtaek benefits from multiple catalysts (base relocation effects, corporate investment, and land development). However, prior cycles may have front-loaded expectations. The market is attractive in principle, but valuation entry points require stricter verification.
“Good region” and “good price” are not equivalent.
6. Which Regional Metros Recover First
6-1. Busan and Daegu: selective recovery potential
Daegu experienced a deep correction following oversupply. Busan faced both supply pressure and demographic headwinds. Historically, recoveries begin in prime submarkets and large-scale preferred complexes. Daegu’s key areas and Busan’s redevelopment-linked or catalyst-driven districts are positioned for earlier stabilization.
6-2. Gwangju and Daejeon: recovery possible, slower speed
Even if stabilization emerges, a sustained uptrend may require more time. A watch-and-select approach is more appropriate than aggressive positioning.
7. The Most Material Risk Now: The Jeonse Market
7-1. The key issue is not only jeonse pricing, but the disappearance of listings
In preferred Seoul areas, jeonse inventory is reportedly scarce. This is not merely a price issue; it constrains access to locations via the jeonse tenure structure.
7-2. Jeonse scarcity pushes households toward monthly rent
Reduced jeonse availability forces tenants into hybrid deposits or monthly rent, increasing recurring cash-flow burdens. Both deposits and monthly rents can rise concurrently.
For landlords, holding-cost pressure can also increase incentives to shift toward monthly rent.
7-3. The risk may intensify over a 2-year horizon
If jeonse inventory remains tight without a clear supply response, the issue becomes structural rather than cyclical, with broader household impact over time.
8. The Supply Cliff: No Longer a Risk, Already in Motion
8-1. Construction-cost inflation is impairing redevelopment feasibility
Rising construction costs are directly reducing project economics. Outside districts with strong pricing power, redevelopment and reconstruction can stall, widening the gap between areas that can renew housing stock and areas that continue to age.
8-2. Supply may persist only in a narrow set of prime Seoul districts
National move-in volumes are declining, with further reductions plausible next year. Within Seoul, supply continuity may concentrate in a limited set of prime districts, implying greater supply polarization.
8-3. Energy and commodity risks remain H2 variables
Geopolitical risk and commodity-linked inputs (energy, petrochemical-based materials, windows, plastics, coatings) could add cost pressure. Construction costs tend to be sticky on the downside, reinforcing the post-2026 supply constraint narrative.
9. Strategy Implications by Participant Type
9-1. Multi-homeowners: convergence toward a one-home posture
Policy direction continues to increase friction for multiple-property holdings via taxes, financing, and transaction rules. Over time, consolidation toward a primary residence is a defensible positioning framework.
9-2. Trade-up buyers: verify “sell-and-buy feasibility” first
With tighter credit, mobility can be constrained. A trade-up plan should be conditioned on verified post-sale purchasing capacity.
9-3. First-time buyers: consider earlier entry within realistic capital limits
The risk set for non-owners includes widening distance to ownership, diminishing jeonse options, and higher monthly rent burdens. Practical options include accessible submarkets, less-repriced older stock, smaller units with redevelopment optionality, and Greater Seoul end-user complexes.
10. Key Points Often Missed in Mainstream Coverage
- The core issue is segmentation, not a single national price direction. Seoul and Greater Seoul are not uniform markets.
- A premium-Seoul adjustment and a Greater Seoul uptrend can occur simultaneously.
- Rental-market deterioration may impose longer-duration stress than spot price movements, with direct impact on housing-vulnerable cohorts.
- The more binding constraint than “low supply” is redevelopment feasibility; rising construction costs can halt projects.
- Industrial restructuring and AI infrastructure buildout may raise housing premiums in specific Greater Seoul corridors; semiconductor, advanced manufacturing, and data infrastructure link directly to demand formation.
11. Consolidated Conclusions
The current environment is not a standard housing cycle. Policy, taxation, credit, construction costs, industrial geography, and migration dynamics are interacting as a structural regime shift.
“Nationwide up” or “nationwide down” frameworks are likely to be less predictive. Practical evaluation criteria include:
- Whether the price point is financeable under prevailing credit rules
- Whether end-user demand is durable
- Whether job-access advantages are strengthening
- Whether incremental supply is realistically deliverable
- Whether rental/jeonse depth is maintained
Under these filters, Korea’s macro outlook, AI-driven infrastructure expansion, semiconductor and advanced-industry growth, and Greater Seoul concentration trends can sustain location-specific housing premiums. Conversely, ultra-premium assets with concentrated policy/tax exposure may exhibit higher sensitivity and volatility.
< Summary >
The 2026 housing market is not moving uniformly.
Ultra-premium assets in prime Seoul districts face additional adjustment risk due to credit constraints and potential tax/holding-cost pressure.
Mid-priced Seoul segments and Greater Seoul end-user markets are more consistent with a gradual upward trend.
In regional metros, Busan and Daegu may stabilize first in prime submarkets, while Gwangju and Daejeon may recover more slowly.
The most consequential issue is the rental market: sustained jeonse scarcity can accelerate monthly-rent conversion, increasing household cash burdens and housing insecurity.
The supply cliff has already begun; construction-cost inflation is intensifying polarization by reducing redevelopment feasibility.
Forward-looking evaluation should emphasize location quality, job-access fundamentals, supply deliverability, and rental-market depth, not headline price direction.
[Related Links…]
- https://NextGenInsight.net?s=real-estate
- https://NextGenInsight.net?s=AI
*Source: [ 경제 읽어주는 남자(김광석TV) ]
– [풀버전] 전세 매물 씨가 말랐다 수도권 집값 더 오를 수밖에 없는 이유 | 경읽남과 토론합시다 | 김효선 위원