● Tesla Cybercab Megagamble
Tesla’s Berlin Cybercab Plan for 1 Million Vehicles: Conditions for 2029 That Matter More Than the Share Price
Expanding factory capacity does not automatically increase shareholder returns.
The key considerations are European autonomous-driving approvals, factory utilization, and the investment payback period—not the headline annual capacity of 1 million vehicles.
This report examines the proposed Berlin Cybercab investment, why major capital spending announcements may coincide with share-price weakness, figures requiring verification, and indicators shareholders should monitor.
This analysis is based on the supplied video transcript.
Investment announcements, share prices, management changes, and regulatory developments cited in the transcript have not been independently verified against official documents or real-time data.
Relative dates without a clear reference date are not treated as confirmed current schedules.
1. Verification Priorities: Claims Unsuitable for Direct Use in Investment Decisions
The transcript presents investment arguments alongside apparent transcription errors and claims requiring official confirmation.
These statements should be treated as claims made in the transcript, not as verified Tesla announcements.
| Claim in the Transcript | Key Qualification | Required Verification |
|---|---|---|
| A €3 billion Berlin investment to produce up to 1 million Cybercabs annually | The investment amount, model-specific capacity, and 2029 production schedule require confirmation. | Tesla announcements, investor relations materials, and German permitting documents |
| Tesla closed at $379.74, down 2.69% | The trading date and session are unspecified; this cannot be used as a current share price. | Exchange or market data for the relevant trading day |
| SpaceX closed at $137.36 | Without listing status, ticker, and trading venue, this should not be treated as a conventional listed-equity closing price. | Official listing disclosures and trading details for the security |
| Jensen Huang stepped down, with Colette Kress appointed interim CEO | This material leadership claim cannot be established from the transcript alone. | NVIDIA announcements and regulatory filings |
| Europe permits sales of only 1,500 driverless vehicles per model annually | The applicable type-approval framework, vehicle category, and latest amendments require verification. | EU regulations and member-state operating authorization requirements |
| A $10.1 billion investment in a Houston solar manufacturing plant | The project sponsor, investment scope, incentive applications, and committed expenditure must be distinguished. | Texas filings and official Tesla materials |
The transcript initially cites a European registration limit of 1,500 vehicles, then refers to 15 vehicles.
If both figures describe the same limit, they are inconsistent and should not be quoted without verification.
The Berlin investment is initially described as “3 billion” without a clear currency, then as €3 billion.
Dollar, euro, and Korean won equivalents should be recalculated using exchange rates from the same reference date.
2. Proposed Berlin Cybercab Investment: Implications if Confirmed
① European production would expand from conventional electric vehicles to purpose-built autonomous vehicles.
Gigafactory Berlin began operations in 2022 as Tesla’s European production hub.
The transcript describes additional Cybercab facilities separate from existing Model Y production.
If confirmed, the plan would indicate that Tesla views Europe as both an EV market and a robotaxi manufacturing base.
Local production could reduce shipping times, logistics costs, and import-related burdens.
Competitiveness would also depend on German labor costs, energy expenses, and factory utilization.
② The scope of the 1 million-vehicle capacity figure must be clarified.
The transcript references both an existing plan to expand Berlin capacity to 1 million vehicles annually and a claim of up to 1 million Cybercabs annually.
It is unclear whether these figures describe the same expansion or separate incremental capacity.
Adding overlapping figures could materially overstate total capacity.
Nameplate capacity does not guarantee production or sales volumes.
③ Production in 2029 is a conditional schedule, not a revenue forecast.
The transcript outlines a construction permit application, construction beginning in the first half of 2027, and production starting in 2029.
Even if confirmed, the schedule would depend on permitting, construction, equipment installation, trial production, and vehicle approval.
Initial production and sustained high-volume manufacturing may begin at different times.
The relevant shareholder question is not whether the factory opens in 2029, but when it can profitably manufacture vehicles authorized for sale.
3. Why Tesla Shares Could Decline Despite a Major Investment Announcement
The cause of the decline on the unspecified trading day cannot be established.
However, several mechanisms explain why major investment announcements can coincide with share-price weakness.
① Higher interest rates reduce the present value of distant earnings.
U.S. interest-rate expectations materially affect valuations of companies such as Tesla, whose market value incorporates substantial future growth.
Higher discount rates reduce the present value of expected future cash flows.
Businesses with distant and uncertain monetization timelines, including robotaxis and AI-enabled robots, may be particularly sensitive.
The transcript’s reference to a possible December rate increase requires verification against contemporaneous rate futures and Federal Reserve communications.
② Investment consumes cash before generating returns.
Factory construction may support long-term growth while increasing near-term capital expenditure.
All else equal, higher capital expenditure reduces free cash flow.
Investors assess expected returns on investment, not spending magnitude alone.
③ An anticipated announcement may produce a limited share-price response.
Share prices respond to differences between new information and existing expectations.
If production expansion is already reflected in the valuation, an investment announcement may provide limited additional upside.
④ Broad technology-sector risk aversion can outweigh company-specific positives.
Higher rates, uncertainty surrounding AI-related earnings, and reduced exposure to growth stocks can affect Tesla.
A single day’s decline cannot reliably be attributed solely to interest rates or factory investment.
Analysis requires both contemporaneous market movements and Tesla-specific developments.
4. European Autonomous-Driving Regulation: Three Distinctions Beyond the 1,500-Vehicle Limit
Reducing European regulation to a single numerical limit can distort investment analysis.
The EU has type-approval frameworks for small-series vehicles and technical requirements for fully automated driving systems.
This does not establish a permanent, uniform sales limit for all autonomous vehicles.
The applicable approval pathway and current regulations must be verified.
① Vehicle type approval: Can the vehicle be placed on the market?
This process assesses compliance with applicable technical requirements, including vehicle structure, braking, safety, and automated driving systems.
A Cybercab design without a steering wheel or pedals may require different assessments from conventional driver-operated vehicles.
② Operating authorization: Where and under what conditions can it operate?
Vehicle approval does not authorize unrestricted operation on all roads or in all weather conditions.
Relevant conditions include road type, speed, weather, and geography.
These parameters define the operational design domain, or ODD.
③ Commercial service authorization: Can it carry paying passengers?
Vehicle operation and passenger transportation services may be subject to separate regulations.
Insurance, accident liability, remote assistance, passenger safety, and data processing also affect expansion.
Vehicle approval → compliance with operating conditions → commercial service authorization should be assessed separately.
Using the transcript’s figures, a 1,500-vehicle limit equals 0.15% of annual capacity of 1 million vehicles.
This calculation does not establish that 99.85% of output would be unsellable.
Such a conclusion would require verification of the limit’s scope, alternative approval pathways, regulatory changes, and exports outside Europe.
Conversely, easing a regulatory limit would not automatically secure Tesla’s vehicle approvals or robotaxi operating licenses.
5. Why Build Additional Capacity When the Existing Factory Is Underutilized?
The transcript cites existing Berlin capacity of 500,000 vehicles annually and actual output of approximately 200,000.
If both figures cover comparable periods and production scope, the simple ratio is approximately 40%.
A meaningful utilization assessment must also consider shifts, equipment modifications, production interruptions, and model transitions.
① A new vehicle may require a different production system.
If Cybercab architecture and manufacturing processes differ materially from those of Model Y, unused capacity on existing lines may be insufficient.
The economics of a dedicated facility require a comparison of conversion and new-build costs.
② A separate building does not resolve weak utilization.
The transcript’s explanation that production would occur in a separate building describes the facility layout, not the investment’s economic viability.
A new plant creates fixed costs, including labor, maintenance, and depreciation.
If existing EV operations and new autonomous-vehicle operations both underperform, the overall cost burden could increase.
③ The decision depends on early-investment costs versus delayed-entry risks.
Waiting for approvals before construction could delay market entry.
Completing a factory before approvals are secured could create idle-capacity costs.
A disciplined approach would phase investment according to regulatory progress and demonstrated demand.
6. Robotaxi Service Expansion: Per-Vehicle Economics Matter More Than Geographic Coverage
The transcript describes an expanded Miami robotaxi service area and 24-hour operations.
These claims require verification against official announcements and actual service conditions. Third-party coverage estimates should not be presented as official Tesla figures.
Even if confirmed, doubling the service area would not necessarily double revenue.
- Revenue-generating mileage: Assess the share of total mileage that generates passenger fares.
- Empty mileage: Include the cost of reaching passengers and repositioning vehicles.
- Trips per vehicle: Determine whether expanded urban coverage generates additional bookings.
- Downtime: Measure time lost to charging, cleaning, and maintenance.
- Operating support costs: Include insurance, remote assistance, customer service, and incident management.
Urban areas offer higher demand but also greater congestion, limited pickup and drop-off space, and more complex road conditions.
Expanded geographic coverage and improved profitability are distinct outcomes.
The term “robotaxi” alone does not establish whether safety personnel are present or operations are fully driverless.
7. Berlin and Houston Investments: Is the Financial Burden Manageable?
The transcript converts the Berlin investment to approximately $3.3 billion and cites approximately $10.1 billion for the Houston solar manufacturing plant.
The combined amount is approximately $13.4 billion.
Neither amount should be treated as committed future expenditure until the projects’ status, spending schedules, and scope are verified.
① Comparison with cash holdings is insufficient.
Using the transcript’s stated $45.4 billion in cash and investments, the $3.3 billion Berlin investment represents approximately 7.3%.
This ratio addresses only part of the funding assessment.
Other factories, AI computing infrastructure, research and development, working capital, and debt repayment also require funding.
The transcript’s reference to equity assets should not be interpreted as holdings in other companies without checking official financial statements.
② Total project investment differs from annual capital expenditure.
Comparing multiyear project costs directly with a single year’s capital expenditure can distort the funding burden.
The relevant comparison is annual cash outflows against operating cash generation over the same period.
③ The projects face different risks.
Cybercab depends on autonomous-driving technology, approvals, and transportation-service demand.
Solar manufacturing depends on product prices, production costs, policy support, competing supply, and purchase agreements.
A shared 2029 operating target would not establish the profitability of either project.
Overlapping major expenditures during a global economic slowdown could intensify cash-flow pressure.
8. Other Market Developments: Relevance to Investment Decisions
① Lower oil prices and EV demand
Lower oil prices can reduce EV fuel-cost savings relative to internal combustion vehicles.
EV purchases also depend on vehicle prices, electricity tariffs, financing costs, subsidies, and charging access.
Oil-price forecasts alone are insufficient to project Tesla sales.
The International Energy Agency forecast revision cited in the transcript requires verification of the report date and content.
② NVIDIA earnings and AI investment sentiment
NVIDIA’s results and guidance can influence expectations for AI investment demand and broader technology-sector sentiment.
The transcript’s leadership-change claim and revenue forecasts are unverified and are not used as analytical evidence.
Strong AI semiconductor demand and successful monetization of Tesla’s autonomous-driving business require separate assessments.
③ SpaceX, ULA, and potential mergers
Claims concerning launch failures, satellite losses, reuse performance, listing documents, and merger probabilities require official verification.
Prediction-market probabilities reflect participants’ expectations, not merger agreements or corporate disclosures.
SpaceX’s business performance does not automatically accrue to Tesla shareholders.
Any proposed transaction would require analysis of exchange ratios, valuations, dilution, and conflicts of interest.
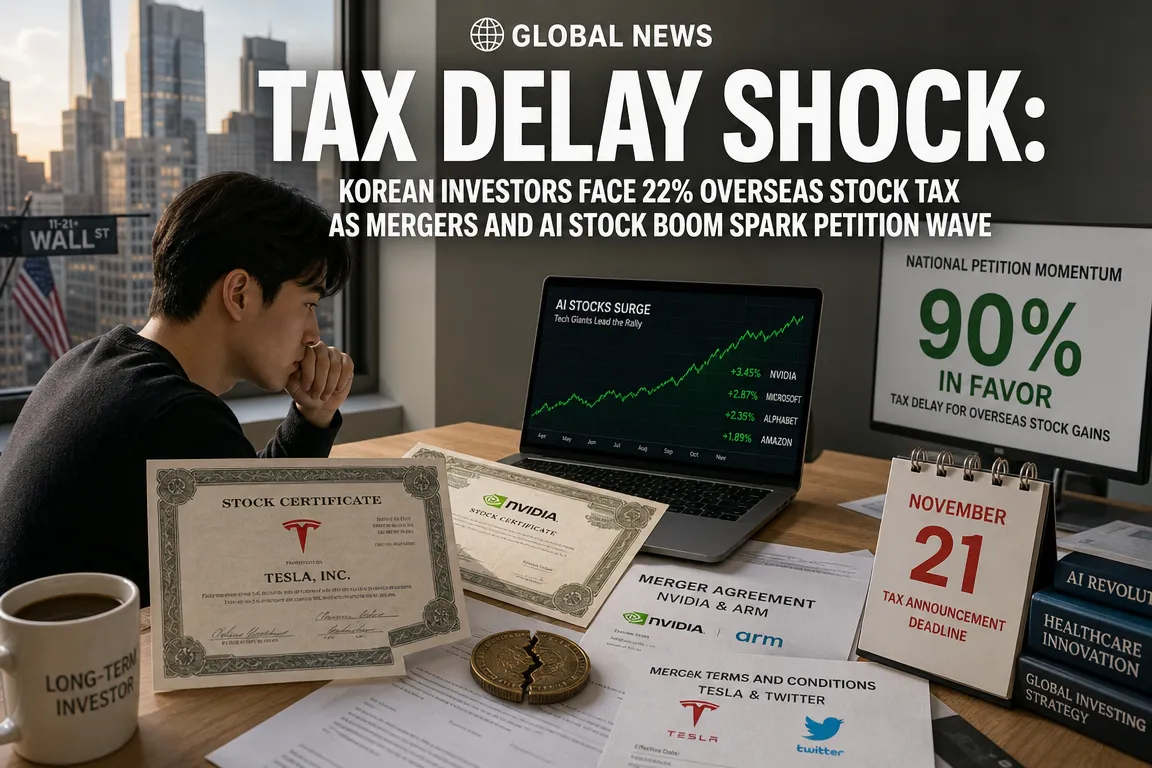
④ Petition concerning taxation of foreign-stock mergers and share exchanges
The transcript addresses potential tax liabilities arising from mergers or share exchanges without a cash sale.
This may create liquidity constraints for investors required to fund tax payments.
Tax treatment and timing depend on transaction structure and applicable law. Meeting a petition signature threshold does not itself change legislation.
The stated participation figures and deadline require verification on the National Assembly’s official petition website.
9. An Underemphasized Constraint: Approvals and Operating Infrastructure, Not Factory Capacity
Several investment considerations receive less attention than headline production figures.
Key Point 1. Manufacturing capacity differs from service deployment capacity.
Even with capacity to manufacture 1 million robotaxis, deployment could be constrained by charging infrastructure, vehicle storage, cleaning and maintenance facilities, insurance, and operating support.
Manufacturing and transportation services may scale at different rates.
Key Point 2. Direct fleet operation and external sales have different financial profiles.
External sales generate vehicle revenue, whereas deployment into Tesla’s own service may keep vehicle-related capital invested in the business.
Transportation revenue would then accrue over an extended period.
Calculating robotaxi revenue as “1 million vehicles × vehicle selling price” could therefore misrepresent the business model.
Key Point 3. A two-seat design must be assessed against demand as well as cost.
If Cybercab retains its publicly presented two-seat configuration, it could offer size and operating-cost advantages.
It could also face limitations for family travel, larger groups, and airport trips involving substantial luggage.
The appropriate fleet mix will depend on city-specific travel patterns.
Key Point 4. Investment flexibility is material.
Phasing permit applications, site preparation, construction, and equipment orders could moderate cash outflows during periods of uncertainty.
Cancellation costs and minimum purchase commitments could limit that flexibility.
Disclosures should be assessed for binding spending commitments, not only total investment amounts.
Key Point 5. Regulatory easing would benefit competitors as well as Tesla.
A broader European driverless-vehicle market would also create opportunities for other automakers and autonomous-driving operators.
Sustainable competitive advantage would depend on safety, service quality, per-vehicle costs, and operational efficiency.
10. Monitoring Checklist for Tesla Shareholders
Assessing whether new disclosures strengthen the investment thesis is more practical than predicting short-term share-price movements.
| Monitoring Item | Positive Indicators | Warning Indicators |
|---|---|---|
| Official investment plan | Clear model-specific capacity, investment amounts, and schedules | Unclear distinction between existing expansion plans and new projects |
| EU regulations and vehicle approval | Defined approval pathways and requirements | Repeated reliance on general expectations of regulatory easing |
| Local service authorization | Confirmed conditions and locations for driverless commercial passenger services | Test operations conflated with commercial operations |
| Annual capital expenditure and cash flow | Phased spending supported by cash generation | Rising investment alongside weakening cash generation |
| Robotaxi operating performance | Improving paid usage, utilization, and per-vehicle profitability | Expanding service coverage without adequate cost disclosure |
| Existing automotive business | Stabilizing sales, utilization, and profitability | Limited demand and earnings recovery despite price reductions |
The transcript’s $379.74 share price alone does not indicate whether Tesla is undervalued or overvalued.
Valuation must account for automotive and energy performance, autonomous-driving commercialization prospects, additional investment requirements, and changes in share count.
The central question is whether Tesla can align investment with verified regulatory progress and demand, rather than whether it should build the factory first.
If officially confirmed, the Berlin plan would provide evidence of long-term strategy, but would not guarantee earnings in 2029.
< Summary >
- The Berlin Cybercab plan for 1 million vehicles annually and a 2029 production start remains a transcript claim requiring official verification.
- Major investment creates growth opportunities and cash outflows; interest rates and expected returns can weigh on the share price.
- The scope of Europe’s cited 1,500-vehicle limit requires verification. Vehicle approval and robotaxi commercial authorization are separate issues.
- Demand, revenue-generating utilization, per-vehicle profitability, and investment recovery matter more than nameplate capacity.
- Key indicators include official investment plans, regulatory progress, phased expenditure, and free cash flow.
This report provides information and analysis, not a recommendation to buy or sell any security.
[Related Articles…]
*Source: [ 오늘의 테슬라 뉴스 ]
– 독일에 100만 대 사이버캡 공장, 그런데 유럽은 아직 못 판다? 2029년의 숙제, $379 테슬라 주주는?표, 테슬라 왜 빠졌나?
● AI Spending Shock, Nvidia Rout, HBM Crash, Rate Fear
SemiAnalysis AI Investment Forecast Downgrade: Key Implications for Nvidia, HBM, and Interest Rates
A lower AI investment forecast does not necessarily indicate a contraction in the AI market.
The central issues are the distinction between a downward forecast revision and an actual decline in investment, customer cash flow beyond Nvidia’s reported earnings, and why AI-driven productivity gains do not necessarily imply lower interest rates.
HBM demand, semiconductor export controls, and inconsistencies in the reported Anthropic IPO figures also warrant scrutiny.
1. Reported U.S. Equity Declines: Simultaneous Pressure on AI Growth Expectations and Discount Rates
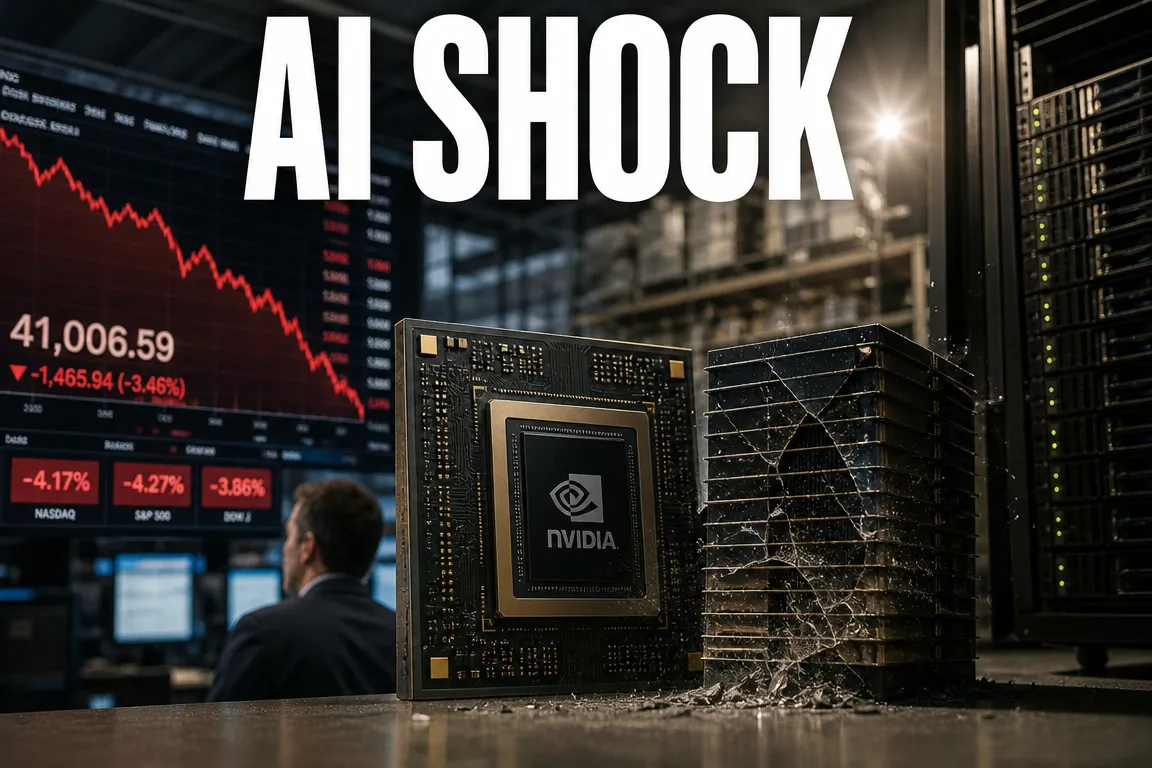
The source attributes U.S. equity weakness to lower AI investment forecasts, semiconductor export controls, and uncertainty surrounding Nvidia.
Attributing a single session’s price movements to one report requires verification of its publication time and intraday market performance.
| Indicator | Figure Cited in the Source | Interpretive Considerations |
|---|---|---|
| Dow Jones Industrial Average | Down 1.41% | Verify the trading date and closing level. |
| S&P 500 | Down 1.92% | Distinguish large-cap technology effects from broader market weakness. |
| Nasdaq | Down 2.49% | Assess changes in growth-stock discount rates and earnings expectations. |
| U.S. 10-Year Treasury Yield | Approximately 5.1% | Separate inflation expectations, real yields, and the term premium. |
| Nvidia | Down approximately 4%, at $156 | Verify the share price and shares outstanding. |
| Crude Oil | Down approximately 3% | Distinguish supply normalization from weaker demand. |
| Bitcoin | Approximately $65,000 | Account for differences across exchanges and observation times. |
The source also reports declines of approximately 8% for AMD, 7.6% for Micron, 7.02% for Intel, 3.92% for Broadcom, and 8.58% for SanDisk.
For the security identified as an SK hynix ADR, its listing status and ticker must first be verified.
Reported relative resilience in consumer goods, healthcare, and payment companies does not establish a sustained capital rotation based on a single session.
The key economic risk is a simultaneous deterioration in growth expectations and financing conditions.
- Lower AI revenue forecasts reduce expected future corporate earnings.
- Higher market interest rates increase the discount rate applied to those earnings.
- Together, these effects can trigger substantial equity corrections even while revenue continues to grow.
2. SemiAnalysis Forecast Revision: Distinguishing Lower Growth Rates from Lower Investment Estimates
According to the source, SemiAnalysis lowered its AI accelerator investment forecasts for 2027–2030.
The source uses “lower growth rates” and “lower expected investment” interchangeably.
A 19% reduction in projected investment is fundamentally different from a 19-percentage-point reduction in year-over-year growth.
These measures should not be treated as equivalent without checking the original table headings, units, and coverage.
| Year | Revision Cited in the Source | Interpretation |
|---|---|---|
| 2026 | Approximately $392 billion, broadly unchanged | The reported adjustment concerns medium- to long-term expectations rather than immediate spending. |
| 2027 | Approximately 19% below the previous forecast | Verify whether this refers to investment value or the growth rate. |
| 2028 | Approximately 28% below the previous forecast | Implies a lower investment trajectory than previously projected. |
| 2029 | $1.352 trillion → $796 billion | Approximately 41.1% lower based on the cited investment values. |
| 2030 | $1.531 trillion → $923 billion | Approximately 39.7% lower based on the cited investment values. |
On these figures, investment rises from $392 billion in 2026 to $923 billion in 2030.
Assuming consistent annual spending coverage, this represents approximately 2.35 times the initial level and a four-year compound annual growth rate of approximately 23.9%.
The scenario therefore indicates slower growth than previously expected, rather than the disappearance of AI investment.
Equity prices may nevertheless face significant pressure.
Where valuations already reflect exceptionally rapid growth, continued revenue expansion can still fall short of expectations and lead to valuation compression.
3. Why Did SemiAnalysis Revise Its Forecast?
The supplied source does not establish the report authors’ actual reasons for the revision.
It cites export controls and data center expansion constraints but does not quantify individual factors or disclose changes to the forecasting model.
The following are therefore assumptions to verify in the original report, not confirmed explanations.
- Demand: Whether AI service usage and revenue from paying customers are expanding as previously expected.
- Investment returns: Whether revenue generated by additional GPUs covers depreciation, electricity, and operating costs.
- Power and construction: Whether grid connections, transformer procurement, cooling infrastructure, and permitting delays are reflected in the forecast.
- Regulation: Whether geographic sales restrictions eliminate demand permanently or redirect investment elsewhere.
- Technical efficiency: Whether lower computing requirements per task reduce GPU purchasing growth.
- Pricing and product mix: Whether GPU pricing changes or greater adoption of custom ASICs reduce the market’s dollar value.
AI accelerator purchases and total AI infrastructure investment are different measures.
Total data center spending may include land, buildings, power, cooling, networking, and storage, which an accelerator forecast may exclude.
Applying a GPU investment downgrade directly to total data center spending creates a scope mismatch.
4. Nvidia’s Reported $2 Trillion Market Capitalization Decline: What Matters in Earnings
The source claims Nvidia’s market capitalization declined from $5.8 trillion to $3.8 trillion.
If accurate, this represents a $2 trillion decrease, or approximately 34.5%.
A decline in market capitalization reflects a lower market valuation of equity, not a $2 trillion reduction in corporate cash.
Claims concerning leadership resignations, interim management, potential returns, and board positions are not treated as established facts without official filings or company statements.
If leadership changes occur, customer contracts, product launch schedules, internal controls, and decision-making continuity are more relevant to investment analysis than personal speculation.
| Earnings Metric | Estimate Cited in the Source | Verification Question |
|---|---|---|
| Quarterly Revenue | Approximately $109 billion | Are the figures consistent with actual consensus estimates and company guidance? |
| Earnings per Share | $2.47 | Is this a GAAP or adjusted figure? |
| Previous Revenue Guidance | $108 billion ±2% | Does this refer to the same fiscal quarter? |
| Gross Margin | 74% ±0.5 percentage points | How do product mix, costs, and regulation affect profitability? |
| Data Center Revenue | Approximately $101.9 billion | Is dependence on major customers and regions increasing? |
| Following-Year Growth Outlook | Claimed revenue growth of approximately 70% | Is this official company guidance or an external estimate? |
Nvidia’s fiscal year differs from the calendar year. Fiscal 2028 revenue should not be conflated with calendar 2028 revenue.
Earnings analysis should assess next-quarter guidance, customer delivery schedules, inventories, and receivables alongside headline results.
Strong current sales do not establish that the same growth rate will persist.
5. Reported 30% HBM Demand Forecast Reduction: Implications for Korean Semiconductor Companies
The source headline highlights a 30% reduction in the 2028 HBM demand forecast, while the body reports reductions of approximately 30% for both 2027 and 2028.
It also cites reductions of 23% for 2029 and 12% for 2030.
The applicable years and demand measurement units require verification against the original report.
HBM demand does not move in direct proportion to GPU spending.
A conceptual measure is “accelerator shipments × average HBM capacity per accelerator.”
Company-level earnings effects also depend on memory specifications, inventories, manufacturing yields, and delivery timing.
- Lower accelerator shipments: May exert downward pressure on HBM sales volumes.
- Higher memory capacity per chip: May partly offset slower accelerator shipment growth.
- A greater high-specification product share: Can change average selling prices and profitability independently of volume.
- Continued capacity expansion: May weaken pricing power if supply grows faster than demand, even when demand increases.
- Different customer mixes: Can produce different outcomes for Samsung Electronics, SK hynix, and Micron.
HBM, conventional DRAM, and NAND have different end markets and supply structures; a uniform reduction cannot be applied across them.
Investment analysis should examine customer qualifications, supply contract terms, capacity expansion, and product-level profitability alongside global market size.
6. AI Semiconductor Export Controls: Licensing Requirements Are Not Export Bans
The source claims the United States will require advance licenses for advanced AI semiconductor exports related to data centers in Singapore, Malaysia, Indonesia, Thailand, Brazil, and other countries, taking effect after 90 days.
The country list, product coverage, and effective date require verification through official regulations from the U.S. Department of Commerce’s Bureau of Industry and Security.
A licensing requirement does not automatically prohibit every transaction.
The impact depends on licensing review policies, end users, performance thresholds, exemptions, and transitional provisions for existing contracts.
Restrictions on physical semiconductor exports must also be distinguished from restrictions on access to computing through overseas cloud services.
The potential economic transmission channels are:
- Longer licensing reviews may delay GPU deliveries and project schedules.
- Delayed commissioning postpones data center revenue generation.
- Interest expenses and fixed costs continue, potentially weakening operator cash flow.
- Subsequent server, memory, and networking orders may also be affected.
Investment blocked in one region may be redirected elsewhere.
Global forecasts should therefore distinguish demand destruction from geographic investment reallocation.
7. Kevin Warsh’s Reported Call for AI Contingency Planning: A Signal for Rate Cuts?
The source identifies Kevin Warsh as Federal Reserve Chair and attributes to him a call for contingency planning because AI could raise productivity while disrupting employment and financial stability.
His stated position and the speech’s content require verification through official Federal Reserve materials.
The source’s description of “SI” as an official U.S. government term for AI is also unsupported.
Regardless of the statement’s authenticity, AI’s implications for monetary policy are not one-directional.
| Channel | Economic Effect | Interest Rate Implications |
|---|---|---|
| Productivity Gains | More output at the same cost | May reduce inflationary pressure, all else equal. |
| Higher Investment Demand | Greater demand for power, equipment, and capital | May place upward pressure on some prices and interest rates. |
| Job Displacement | Employment and wage disruptions in some occupations | May strengthen the case for easing if consumption weakens materially. |
| Higher Expected Returns | Stronger investment incentives and capital demand | May raise the equilibrium real interest rate. |
| Financial and Security Risks | Spillovers from cyber incidents and corporate distress | Financial stability tools beyond policy rates remain important. |
The sequence “AI advances → inflation declines → interest rates fall” is not a reliable policy rule.
Productivity gains and labor-market transition costs may emerge at different speeds.
The Federal Reserve can respond to inflation, employment, and financial conditions, but monetary policy alone cannot address retraining and income redistribution.
A call for risk preparedness does not establish that the Federal Reserve has formally abandoned optimism about AI.
8. Anthropic IPO: Recalculating the Reported Figures
The source reports that Anthropic will list on Nasdaq on November 19 at a valuation of approximately $1.4 trillion, with an offering price of $70–$78, 825 million shares offered, and the proposed ticker “ENTR.”
These claims should not be treated as confirmed without SEC registration filings and company or exchange announcements.
The cited figures imply:
- $70 × 825 million shares = $57.75 billion
- $78 × 825 million shares = $64.35 billion
- 20% of the offered shares = 165 million shares
These calculations do not support the source’s stated total proceeds of $96.5 billion–$100 billion.
Any separate financing or additional issuance would require its own amounts and terms.
If existing shareholders sell shares, not all gross offering proceeds accrue to the company.
Company valuation, offering size, and net proceeds to the company are distinct concepts.
Claims that institutional demand exceeds the offering by 10–20 times do not establish upside potential without assessing binding commitments, duplicate orders, actual allocations, and post-listing holding intentions.
The source also cites an average one-year return of negative 31% and an average maximum drawdown of 53% for major listings without identifying the sample or calculation methodology.
Because the source combines IPOs and direct listings, the return benchmark must be checked, particularly whether it is the offering price or the first trading price.
The more relevant question is whether the offering valuation adequately reflects revenue growth and cash burn, rather than whether a large listing necessarily signals a market peak.
9. Weekly Events and Geopolitics: Verify Before Treating Schedules as Confirmed
The source lists the following events.
| Korea Standard Time Cited in the Source | Scheduled Event | Official Verification Source |
|---|---|---|
| Evening of November 17 | U.S. retail sales release | U.S. Census Bureau economic release calendar |
| Morning of November 18 | Nvidia earnings release and conference call | Nvidia investor relations calendar |
| Morning of November 18 | New York Fed President’s speech | Federal Reserve Bank of New York event calendar |
| Early morning of November 19 | Release of October FOMC minutes | Federal Reserve calendar |
| November 19 | Anthropic IPO pricing and trading debut | SEC, company, and exchange announcements |
| Afternoon of November 19 | U.S.–China meeting and U.S.–China–Russia summit | Government and event organizer announcements |
The source revises Nvidia’s earnings release and conference call timing internally, making official confirmation particularly important.
The discussion of retail sales also requires correction.
Personal consumption expenditures account for roughly two-thirds or more of U.S. GDP; the retail sales measure itself does not.
Retail sales are an important consumption indicator but do not cover all service spending.
The source’s “second Yalta Conference” description is a political analogy, not an established summit outcome.
Discussions concerning the Korean Peninsula at the 1945 Yalta Conference should not be conflated with trusteeship-related decisions at the Moscow Conference of Foreign Ministers in December that year.
Investors should prioritize actual agreement provisions on tariffs, export controls, sanctions, energy supplies, and maritime transport over historical analogies.
10. Five Investment Issues That Headlines May Overlook
The following connections receive limited treatment in the supplied source, although they may have been addressed elsewhere.
① AI computing usage can increase even when investment spending declines.
Lower chip prices and inference costs can enable more AI workloads with less spending.
A downward revision to dollar-denominated investment does not therefore imply declining AI service usage.
Hardware suppliers and companies adopting AI may consequently experience different earnings outcomes.
② Power demand forecasts depend on units and definitions.
The source reports a reduction in projected 2030 AI power demand from 123 GW to 81 GW, approximately 34.1%.
GW measures power, while annual electricity consumption is typically expressed in units such as TWh.
Estimating generation and infrastructure requirements requires clarification of whether the figures represent connection capacity, peak load, or average load.
③ Cash flow mismatches may be more consequential than growth rates for neocloud providers.
GPU rental businesses may pay for equipment and interest before collecting customer revenue.
Lower rental rates or utilization can create cash shortages even while revenue grows.
Contract duration, minimum usage commitments, customer concentration, debt maturities, and GPU resale values are therefore critical.
④ Diversification across technology companies may conceal exposure to the same customers.
GPU, HBM, networking, and power equipment holdings may all depend on data center spending by a small group of major technology companies.
A larger number of holdings does not necessarily provide meaningful economic risk diversification.
⑤ AI productivity gains do not guarantee that AI suppliers retain the resulting profits.
Competition may lower AI service prices, transferring more productivity benefits to customer businesses and consumers.
Long-term investment analysis should assess both technological progress and who captures the economic value it creates.
11. Investor Due Diligence Checklist
- Original report: Verify the SemiAnalysis publication date, table headings, investment coverage, and revision rationale.
- Corporate disclosures: Confirm Nvidia’s earnings schedule, leadership, and official guidance.
- Customer finances: Compare major cloud providers’ operating cash flow, capital expenditure, and free cash flow.
- Memory supply and demand: Assess HBM supply growth, pricing, customer qualifications, and contract terms alongside demand.
- Primary policy documents: Distinguish official BIS export regulations and Federal Reserve speeches from commentary.
- Listing documents: Verify IPO timing, offering structure, secondary share sales, net proceeds, and lockup provisions.
- Portfolio exposure: Assess how heavily holdings depend on the same AI investment cycle.
The relevant question extends beyond whether AI is in a speculative bubble.
Investors should assess how quickly actual demand grows, how much capital is required to serve it, and which businesses ultimately generate cash.
These factors provide a practical framework linking U.S. equities, semiconductor investment, and long-term AI industry trends.
< Summary >
- The source’s market prices, leadership claims, speeches, IPO details, and summit announcements require official verification.
- A lower AI investment forecast is not equivalent to declining investment; the cited figures still imply growth through 2030.
- Nvidia and HBM analysis should incorporate customer investment returns, supply growth, and contract terms alongside current earnings.
- AI-driven productivity improvements do not necessarily lead to interest rate cuts.
- The reported Anthropic offering figures contain inconsistencies in calculated proceeds and require further verification.
- Investment analysis should distinguish AI usage from spending and prioritize cash flow and economic value capture.
[Related Articles…]
*Source: [ Maeil Business Newspaper ]
– [문지웅의 빅머니] SemiAnalysis는 갑자기 왜 전망을 수정했나ㅣ케빈워시 의장의 경고 “AI대 대혼란 대비해야”