● Fed-Rate-Hike-Alarm, PCE-Jumps, GDP-Holds
Comprehensive Briefing After the U.S. PCE and GDP Releases: How Far Has the Rate-Hike Signal Advanced?
This release requires focus on three points.
First, U.S. PCE inflation re-accelerated, pushing out expectations for Federal Reserve rate cuts.
Second, U.S. GDP was not meaningfully stronger than expected but remained resilient, limiting the likelihood of near-term policy easing driven by growth concerns.
Third, the key market issue is not simply whether a near-term hike occurs, but how rising Treasury yields, fiscal expansion, energy-driven inflation, and global liquidity are interacting and reshaping the investment landscape into 2026.
This report consolidates the PCE and GDP details, the Fed’s policy path, drivers of the U.S. Treasury yield surge, rate trends in Europe and Japan, Middle East risks for inflation, and under-discussed structural factors.
1. Key figures
Markets focused primarily on March PCE inflation and the Q1 GDP advance estimate.
- Headline PCE inflation: 3.5%
- Core PCE inflation: 3.2%
- U.S. Q1 GDP (advance): 2.0%
The level is less important than the direction.
PCE moved higher, while GDP undershot expectations slightly but did not signal an imminent downturn.
The combined message is elevated inflation with still-resilient growth, a difficult mix for the Fed.
2. Why PCE matters
While CPI receives more attention, the Fed places greater weight on PCE inflation, particularly core PCE.
- Headline (3.5%) captures broad inflation including volatile energy and food components.
- Core (3.2%) reflects underlying inflation excluding energy and food.
- Both remain elevated; faster acceleration in the headline suggests stronger energy-related inflation pressure.
Recent data weakens the disinflation narrative and complicates a near-term pivot to easing.
3. U.S. GDP at 2.0%: slightly softer, still resilient
Q1 GDP (advance) printed at 2.0% versus a 2.2% consensus.
- Growth is moderating, but not collapsing.
- The Fed has limited justification to shift quickly to cuts on “growth protection” grounds.
In this setting, the prevailing interpretation is “growth holds while inflation stays high,” increasing the probability of higher-for-longer policy.
4. Rate-hike signal vs. prolonged hold
A near-term hike at the next meeting cannot be assumed.
However, rate-cut expectations have been pushed further out, and the probability of an extended hold has increased materially.
If inflation conditions deteriorate further, a hike cannot be fully ruled out.
- Inflation is re-accelerating.
- Energy prices may not be fully reflected in downstream inflation measures.
- U.S. growth remains resilient.
- Treasury yields remain elevated.
The Fed’s bias is likely to remain against easing while inflation trends higher.
5. The central market driver: rising U.S. Treasury yields
Beyond PCE, the larger signal is higher U.S. Treasury yields.
Simultaneous increases in yields across the U.S., Germany, and Japan indicate pressure on the global rate structure.
Key drivers of higher U.S. yields:
- Reduced expectations for near-term Fed easing
- Widening fiscal deficits and increased Treasury supply
- Middle East risk and renewed energy-inflation concerns
- Softening foreign public-sector demand for U.S. Treasuries
Weaker demand at long-duration auctions is particularly significant, as long-end yields are more sensitive to supply and term-premium repricing.
6. Why equities can remain resilient despite higher yields
Higher yields typically tighten financial conditions and pressure equities.
Recent resilience is better explained by fiscal expansion injecting liquidity rather than broad risk optimism.
- Geopolitical risk often leads to higher government spending.
- Reconstruction, defense, and energy infrastructure outlays are commonly financed via increased issuance.
- These flows can support activity and market liquidity even as yields rise.
This creates a two-sided regime: upward pressure on yields alongside fiscal-driven support for risk assets.
7. Europe and Japan: synchronized rate pressure
U.S. analysis is incomplete without Europe and Japan, where sovereign yields have also risen.
Europe:
- Energy-price pressures and renewed inflation concerns reduce the ECB’s room to ease.
- Moves in German CPI and the German 10-year yield affect broader euro-area rate expectations.
Japan:
- Gradual normalization away from ultra-accommodative policy remains sensitive to inflation persistence.
- Currency depreciation adds constraints, potentially limiting the ability to soften tightening bias.
A concurrent rise in U.S., German, and Japanese yields implies a higher global discount rate, affecting growth equities, real estate, emerging-market assets, and FX.
8. Middle East risk, energy prices, and inflation pass-through
Energy remains a key upside risk to inflation.
The critical question is not only the current oil price level, but the lagged transmission into consumer inflation.
- Energy shocks typically move through producer prices before consumer prices.
- Additional pass-through may appear in April–June inflation data.
Upcoming U.S. CPI, PPI, and PCE releases will be evaluated for evidence of second-round effects.
9. What the Fed may emphasize beyond headline inflation
Policy interpretation can depend on which inflation measures are emphasized, including trimmed-mean PCE-type approaches.
- Such measures filter extreme price moves to estimate underlying inflation.
- This can reduce sensitivity to one-off shocks but may understate near-term inflation experienced by households.
Market focus may shift from the prints themselves to which measures the Fed uses to justify policy.
10. Market implications: equities, rates, and the dollar
10-1. Fixed income
The most direct impact is on rates.
Elevated PCE with resilient GDP pushes easing expectations out, supporting higher Treasury yields.
Long-end yields remain highly sensitive due to fiscal supply and term-premium dynamics.
10-2. Equities
Equities may hold in the near term, but prolonged discount-rate pressure increases valuation risk.
Long-duration growth sectors are typically more rate-sensitive.
Fiscal-linked sectors such as defense, energy, commodities, and infrastructure may remain relatively supported.
10-3. U.S. dollar and FX
A higher-for-longer Fed stance can sustain dollar strength.
A stronger dollar influences import prices and emerging-market capital flows.
Open economies should monitor FX volatility alongside rate differentials.
11. Under-discussed structural points
11-1. The more important issue than a single meeting: potential upward revision in the neutral rate
Market attention is often fixated on the next decision.
A more structural consideration is that the U.S. economy is tolerating higher rates, implying a potentially higher neutral rate than in prior cycles.
If sustained, a rapid return to a low-rate regime becomes less likely.
11-2. Weak long-duration demand reflects structure, not sentiment
Soft long-end auction demand may reflect a structural shift driven by rising deficits, increased supply, and reduced foreign demand.
This can keep long-term yields elevated.
11-3. War as both risk shock and liquidity impulse
Geopolitical conflict is a negative shock, but subsequent fiscal expansion can function as an offsetting liquidity impulse.
This helps explain non-linear market reactions.
11-4. Energy shock may not yet be fully embedded in consumer prices
Current inflation prints may not reflect the full downstream impact of energy-price moves.
With typical lags from import and producer prices into consumer inflation, upcoming data may drive further repricing.
12. Near-term calendar and monitoring points
- Next U.S. CPI release
- Next U.S. PPI release
- Next U.S. PCE release
- Shifts in Fed communication
- U.S. 10-year Treasury yield trend
- Middle East geopolitical risk and crude oil
- German and Japanese sovereign-yield trends
If inflation re-accelerates over the next 2–3 months, the market narrative could shift from “extended hold” toward renewed “hike risk.”
13. One-line framing: what markets are pricing
Markets are increasingly reflecting the following:
“The Fed is unlikely to ease quickly.”
“Inflation is proving sticky.”
“Treasury yields may remain structurally elevated.”
“Asset allocation frameworks require adjustment.”
These releases function less as a single-month event and more as confirmation of shifting U.S. macro dynamics and a changing global discount-rate regime.
< Summary >
U.S. PCE inflation moved higher, while Q1 GDP was slightly below expectations but remained resilient.
This mix reduces the probability of near-term Fed cuts and increases the likelihood of a prolonged hold.
Rising Treasury yields, widening deficits, energy-driven inflation risk from the Middle East, and higher yields in Europe and Japan point to a regime shift in global discount rates.
The critical issue is less the immediate probability of a rate hike and more whether inflation persistence over the next several months reinforces a longer-duration high-rate environment.
[Related]
- Key Takeaways on U.S. PCE Inflation and Shifts in Fed Policy
- Analysis of U.S. GDP Moderation Signals and Implications for Global Equities
*Source: [ 경제 읽어주는 남자(김광석TV) ]
– [LIVE] 미국 PCE 물가 급등할까? 1분기 GDP는? 금리인상 시그널 나올까? [즉시분석]
● Google Rallies, Meta Crashes, Iran Risk, Oil Shock
Why Google Rose While Meta Sold Off: The Market’s Core Focus Beyond Iran Risk
Today’s market combined multiple drivers: Iran nuclear negotiations, oil prices, US Q1 GDP, and megacap earnings. However, the primary equity catalyst was simpler: investors are shifting from “how much is being invested in AI” to “whether AI spending is translating into measurable earnings and cash flow.”
This report summarizes:
- Why Google was rewarded while Meta was penalized
- Why Caterpillar is being re-rated as an AI infrastructure beneficiary
- Why Eli Lilly is consolidating a leadership position in the obesity drug market
- How Middle East risk and higher oil connect to US equities and global growth
- A key under-discussed market point currently driving relative performance
1. Market Snapshot: Headline Briefing
- US Q1 GDP was weaker than expected, while inflation indicators re-accelerated, reviving stagflation concerns.
- Google rallied after quantifying AI-driven operating leverage.
- Meta sold off despite strong results due to a larger-than-expected increase in AI capex guidance.
- Eli Lilly advanced as obesity-franchise momentum and market share strengthened.
- Caterpillar drew attention as a leveraged beneficiary of data-center and power infrastructure buildout.
- Iran’s leadership reiterated an effectively non-negotiable nuclear stance; Middle East risk remains an upside factor for oil.
2. Megacap Earnings: The Market Is Repricing AI Based on Monetization, Not Narrative
2-1. Why Google Outperformed: First Clear Evidence of AI Payback
Google’s move reflected the release of the numbers the market had been waiting for: AI-related investment is beginning to show up in profitability.
Key metrics:
- Cloud segment growth rate surged to 63%
- Operating margin reached 36%
The combination matters because investors have been questioning whether large AI capex (data centers, advanced chips, server expansion) can convert into durable profit. The cloud business is increasingly positioned as AI compute and data-processing infrastructure with meaningful switching costs and customer lock-in, supporting premium valuation.
2-2. Why Meta Sold Off: Capex Risk Overwhelmed Strong Earnings
Meta’s underlying results were strong:
- Q1 net income increased 61%
Market reaction remained negative because management guided to an additional USD 10 billion increase in capex to accelerate AI investment.
Investors continue to discount Meta through the lens of prior capital allocation concerns. The issue is not AI investment per se, but limited near-term clarity on the monetization and payback path relative to peers.
2-3. Why Microsoft and Nvidia Also Matter
Microsoft, despite AI leadership, traded weaker in sympathy as investors became more selective on AI beneficiaries. The market is increasingly demanding evidence of AI-driven revenue lift, margin expansion, and cash generation.
Nvidia remains central to AI infrastructure, but is sensitive to near-term sentiment and positioning. Structurally, sustained AI capex supports continued demand for GPUs, HBM, servers, and networking equipment.
3. Additional Support for Google: US Department of Defense AI Adoption and the Shift to B2G
Another key factor was reporting that Google’s Gemini model is being deployed into classified US Department of Defense projects. The market interpreted this as a high-conviction trust signal.
Government (B2G) engagements typically require stringent security and reliability standards. Adoption by the DoD implies validation not only of model capability but also operational security, accelerating the view that AI is becoming embedded in national security and public infrastructure markets.
4. Cloud 2.0: Why Megacaps May Strengthen Their Structural Position
Cloud 1.0 centered on renting compute and storage to lower costs. Cloud 2.0 integrates AI model execution, data processing, inference workloads, and workflow automation.
For enterprises, AI adoption is increasingly a competitive necessity rather than a discretionary upgrade. Switching costs and migration complexity reinforce customer lock-in, supporting the potential for concentrated cash-flow generation among leading platforms.
5. Key Linkage for Korean Investors: AI Infrastructure Ultimately Flows Into Semiconductors and Memory
Megacap AI capex translates into downstream demand for:
- GPUs and AI accelerators
- High-bandwidth memory (HBM)
- Advanced packaging
- Data-center servers and power equipment
Within this structure, Korea’s semiconductor value chain remains strategically positioned. In particular, SK Hynix, Samsung Electronics, and HBM-linked equipment suppliers are directly exposed to incremental AI infrastructure demand. Monitoring capex flow-through across the supply chain is critical.
6. Why Caterpillar Matters: The Underappreciated AI Beneficiaries Are Heavy Equipment and Power Generation
6-1. Strong Reported Results
Caterpillar posted results that exceeded expectations:
- Q1 revenue: USD 17.4 billion
- YoY growth: 22.5%
- EPS: USD 5.54, up more than 30%
6-2. Why It Is Viewed as an AI Infrastructure Beneficiary
The focal point was power-generation demand:
- Energy and transportation segment generator sales increased 41%
Data centers are power-intensive and require robust backup generation due to the cost of downtime. As hyperscalers expand data-center footprints, the buildout requires not only chips but also power equipment, where Caterpillar has meaningful exposure.
6-3. Additional Tailwinds: US Reindustrialization and Reshoring
Incremental support comes from expanding US factory construction, reshoring trends, and infrastructure investment. This positions Caterpillar not merely as a cyclical industrial, but as a leveraged participant in both data-center expansion and domestic industrial investment.
7. Eli Lilly: Why Leadership in Obesity Therapeutics Is Becoming More Evident
7-1. Market Share Signals Consolidation
Eli Lilly’s results reinforced a structural shift in biopharma leadership:
- US incretin-class market share: 60.1%
- Global market share: 53.2%
This indicates control of more than half the category, strengthening its competitive standing versus Novo Nordisk.
7-2. Why Results Held Up Despite Effective Price Pressure
Despite lower effective pricing driven by broader insurance coverage, volume increased materially:
- Units/volume rose 65%
This indicates robust underlying demand expansion rather than a purely price-driven outcome.
7-3. Oral Obesity Therapy Could Expand the Addressable Market
Beyond injectables, oral pipeline assets could expand adoption by lowering barriers for patients reluctant to use injections, potentially shifting competition from share transfer to market expansion.
7-4. Core Strategic Point: A Metabolic Disease Platform, Not a Single Product
Eli Lilly is expanding obesity therapies into broader metabolic indications, including cardiovascular disease, sleep apnea, and liver disease. This strategy supports a platform-based interpretation rather than a single-product cycle, with potentially larger lifetime value per patient population.
8. US Macro Interpretation: Slower Growth With Re-Accelerating Inflation
8-1. GDP Missed Expectations
- US Q1 GDP growth: 2.0%
- Consensus: 2.2%
This suggests some deceleration in growth momentum.
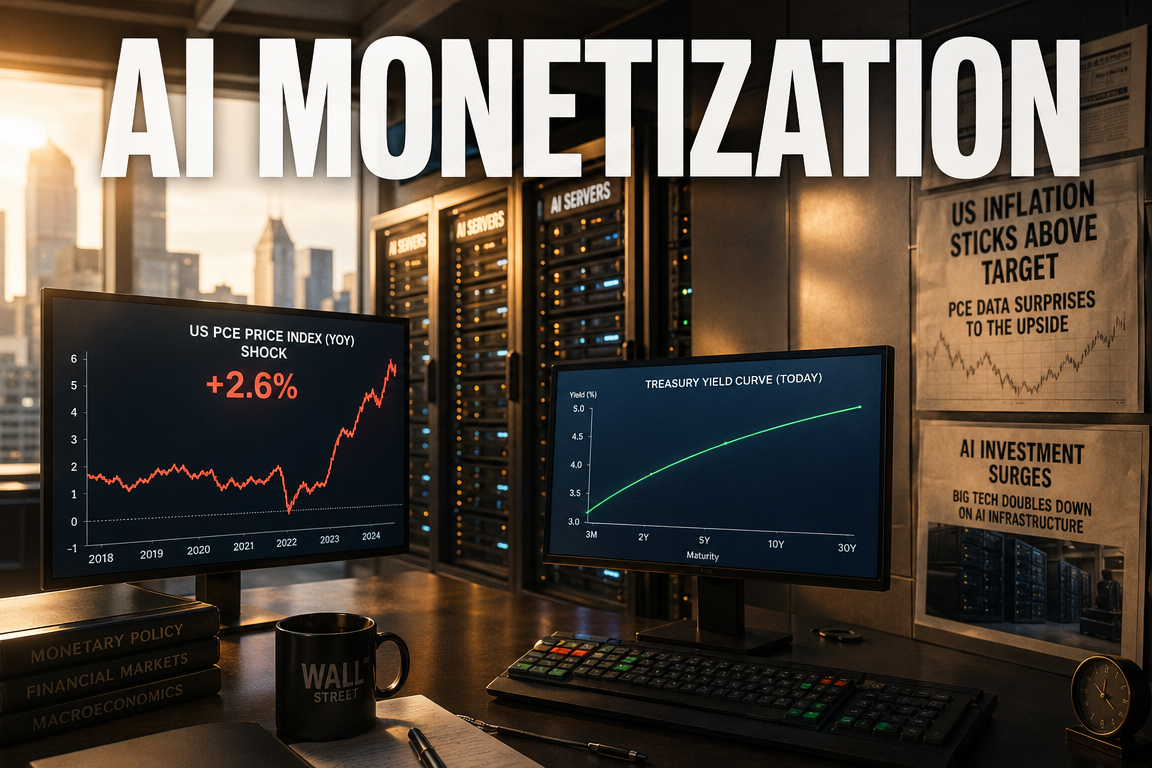
8-2. Inflation Re-Accelerated
- Q1 core PCE price index: 4.3%
- Consensus: 4.1%
- Prior quarter: 2.7%
The growth-inflation mix complicates expectations for near-term easing.
8-3. Labor Market Remains Resilient
Initial jobless claims remained low, indicating no rapid deterioration in labor conditions. This resilience limits the Federal Reserve’s flexibility if inflation remains elevated.
9. Why US Equities Held Up: AI Capex and High-Income Consumption
Despite unfavorable macro data, the market avoided a broad breakdown, supported by:
- AI infrastructure investment and earnings support at the index level
- Consumption concentration among higher-income cohorts
When higher-income households account for a disproportionate share of spending, headline consumption data may remain stable even as lower-income stress rises. This distributional dynamic is relevant for interpreting inflation and consumer indicators.
10. Iran Leadership Messaging and Middle East Risk: The Primary Transmission Is Oil
10-1. Core Message: Nuclear Non-Concession and Strait Leverage
Iran’s leadership reiterated a non-concession stance on nuclear issues and signaled continued intent to influence regional maritime order, sustaining energy supply-chain risk.
10-2. Why Markets Did Not React Sharply Intraday
Oil had already moved materially the prior session; investors are focusing on the probability of sustained disruption rather than headlines.
10-3. The Key Risk Is Duration
A prolonged regional risk premium can sustain upward pressure on oil, feeding into transport and production costs, consumer sentiment, and inflation expectations. Levels such as WTI USD 120 regain relevance primarily through the macro cost-shock channel rather than immediate equity pricing.
11. Federal Reserve and Policy Uncertainty: Complexity Has Increased
Political pressure, leadership transition considerations, and conflicting growth-inflation signals raise the risk of messaging inconsistency. This environment tends to increase volatility, particularly where valuation sensitivity to rates is high.
12. Investor Checklist
12-1. The Primary AI Question
Preference is shifting toward companies that demonstrate AI ROI via earnings and cash flow, not capex scale.
12-2. Differentiation Within Megacaps
Google, Meta, Microsoft, and Amazon may share broad AI exposure, but equity outcomes can diverge based on margin trajectory, capex discipline, and monetization speed.
12-3. Broaden the AI Infrastructure Lens
AI capex beneficiaries extend beyond semiconductors to:
- Power generation and grid equipment
- Cooling and thermal management
- Construction equipment
- Data-center real assets
- Networking
12-4. Monitor the Dual Constraint: Oil and Rates
Higher oil can re-ignite inflation pressure, weakening rate-cut expectations and increasing valuation stress for long-duration growth equities.
13. Under-Discussed Core Point: The Market Is Pricing AI Cash-Flow Concentration
The market is not broadly rewarding “AI exposure.” It is increasingly rewarding companies positioned to monopolize AI-driven cash flows through:
- Scale capital resources
- Infrastructure control
- Security and reliability trust
- Customer lock-in
- Regulatory and public-sector alignment
This links Google’s defense-related validation, cloud margin expansion, and the broader data-center infrastructure buildout (including power equipment beneficiaries such as Caterpillar) into a single framework relevant to rates, US equities, and global growth.
14. Conclusion: AI Monetization Is Dominating Over Geopolitical Headlines
While the session contained multiple macro and geopolitical drivers, relative equity performance was primarily determined by evidence of AI monetization.
- Google: demonstrated AI-linked profitability via cloud growth and margins
- Meta: strong earnings, but capex expansion raised monetization and discipline concerns
- Caterpillar: re-rated as a data-center and power infrastructure beneficiary
- Eli Lilly: reinforced leadership in obesity therapeutics with expanding platform potential
The market focus has shifted from “who can articulate the future” to “who is already monetizing it.”
< Summary >
Google strengthened on cloud growth and high margins, supporting the view that AI investment is translating into earnings.
Meta declined despite strong results due to higher AI capex guidance.
Caterpillar gained visibility as a secondary AI infrastructure beneficiary via data-center construction and backup power demand.
Eli Lilly reinforced a leadership position in obesity therapeutics through market share gains and strong underlying demand.
US macro data signaled slower growth alongside higher inflation, increasing stagflation concerns.
Iran’s hardline messaging sustains Middle East risk, with oil as the primary macro transmission channel.
The dominant market framework is concentrating premiums on companies that can demonstrate AI-driven monetization and cash-flow durability.
[Related Articles…]
- AI infrastructure capex beneficiaries: key names and themes to reassess
https://NextGenInsight.net?s=AI - Oil spikes and US equity volatility: key checkpoints for second-half positioning
https://NextGenInsight.net?s=oil
*Source: [ Maeil Business Newspaper ]
– 이란 하메네이 성명, ‘핵 포기 불가’ 입장ㅣ일라이릴리, 컨센서스 상회 실적 주가 ‘쑥’ㅣ발전기 매출 급증, 캐터필러 주가 상승ㅣ홍키자의 매일뉴욕