● Data Sovereignty Boost for Koreas Agriculture AI
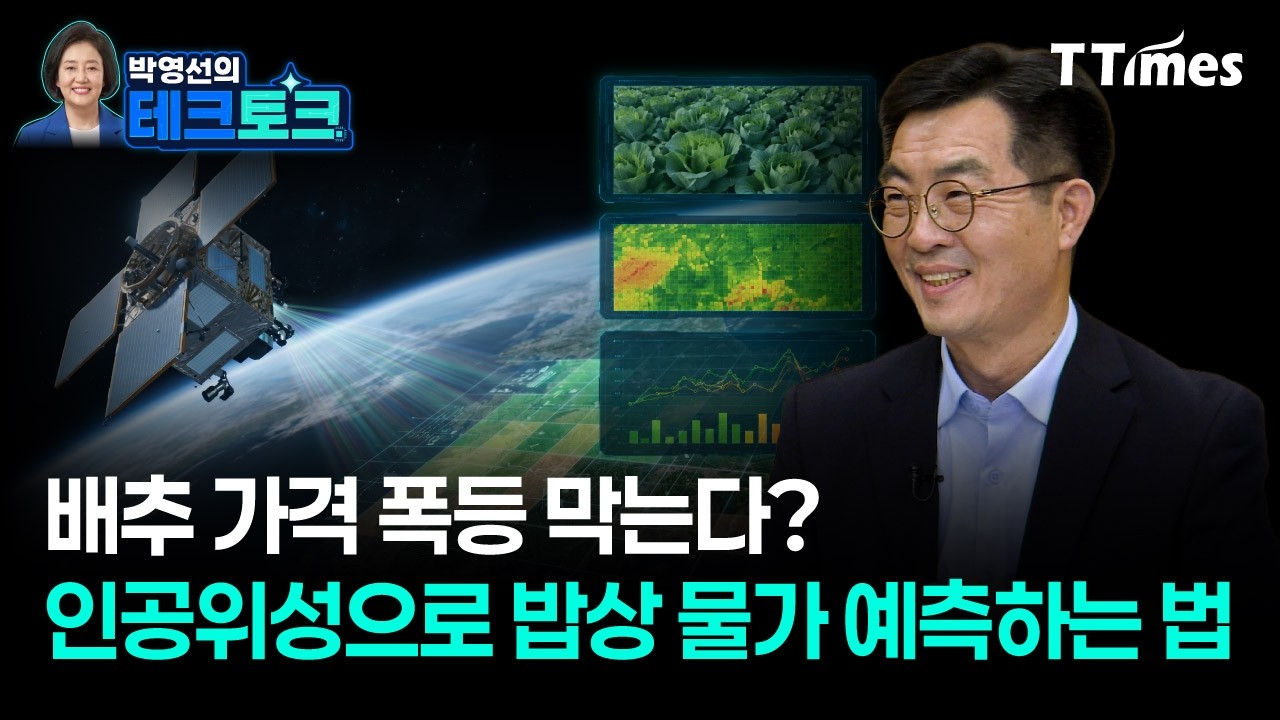
July Launch ‘Agriculture and Forestry Satellite’ Opens Data Sovereignty and Agricultural AI Transition: See Area, Crop Growth, and Disasters Every 3 Days
What Changes Right Now (Key Takeaways Readers Should Definitely Check)
✅ Early July (scheduled: 7/8) South Korea’s first agriculture and forestry satellite will be launched.
✅ From that moment on, the core point is simple. The possibility grows that agricultural information that relied on foreign satellite data will become collected and analyzed domestically, thereby realizing data sovereignty.
✅ From the perspective of the agricultural field, it’s close to “seeing the satellite like CCTV.”
— There’s a flow where you check paddy and field conditions regularly (in 3-day units), and expand step by step from text alerts to prescriptions (pesticide/type/timing/operation advice).
✅ Also, this satellite isn’t just a ‘photo’; it analyzes using vegetation indices and reflectance, connecting crop growth status and disaster damage estimates.
Content Summarized Like an Article/News: Break Down the Role of the Agriculture and Forestry Satellite into “Area-Growth-Disaster-Prediction”
1) Area Identification: First Pinpoint “How Much Was Planted”
The first use of agriculture and forestry satellites is estimating crop area (cultivation scale).
For example, questions like these become close to real-time.
— Did this year’s rice cultivation area increase or decrease compared to last year?
— Did crop conversions like soybeans/cabbage actually increase?
— If a certain crop increases, won’t shipment volume rise and prices fall?
In other words, it becomes the “starting point of prediction” that leads to cropping strategy → supply and demand → prices.
2) Growth Status: See “Is It Growing Well Now / Are There Problems?”
The second part is growth (whether crops are healthy / are underperforming).
It’s not just an image you look at with your eyes; the satellite analyzes reflectance values and vegetation indices through multiple cameras (visible light + near-infrared, etc.).
So it gains discrimination power even in cases where cabbages/crops look “similar” but are actually in different conditions.
3) Disaster Damage: Estimate Losses from Typhoons, Floods, Hail, etc., in Area Units
In farming, the impact of weather is so large that the third area is disaster monitoring (estimating damage area/range).
If crops are knocked down by typhoons or if flooding occurs due to heavy rainfall, it becomes important to determine the damaged area.
The flow here is that agriculture and forestry satellites can estimate these areas and help enable accurate service provision and support administrative/government decision-making.
4) Price & Supply Prediction: Look at the “Flow of Quantity at Harvest Time,” Not Just “Harvest Volume”
In the end, agriculture and forestry satellite data connects to “when and how much will come out.”
Example: For crops like cabbage/radish, crop classification becomes possible around 20 days after planting, and forecasts for harvest volume can continue based on growth trends.
Then it becomes easier to make decisions (contracts/adjustments) to mitigate price spikes or drops caused by crop surplus or shortage.
Agriculture and Forestry Satellite vs General Satellite: A Structure That Makes Judgments Using Vegetation Indices, Not “Photos”
The differentiation here is clear.
Satellites we usually think of tend to focus on “video you view like a picture.”
But agriculture and forestry satellites focus on reflectance-based analysis, such as NDVI (vegetation index).
1) National (e.g., land) satellites (such as urban/land vegetation change) focus on ‘visual information’
They have strengths in viewing the whole territory (road, building changes, and overall surface changes).
2) Agriculture and forestry satellites focus on ‘indicators for agricultural decision-making’
They analyze crop health and growth conditions by separating visible light and near-infrared, etc., and link “current condition → changes in a few days → work timing.”
Combination with Weather Forecasting: Deliver to Farms in 30m Units, Not 5km
The key point is that agriculture can’t be covered with “weather for which neighborhood” alone.
Weather Agency forecasts typically come down in 5km units, but when you look at it at the farm level, differences in temperature, precipitation, and wind become significant.
Flow Where Agriculture and Forestry Satellite Data Is Included
They explain that by combining Weather Agency data + topographic maps + data from small weather stations at agricultural technology centers, it becomes possible to provide 30m-unit farm forecasts.
And based on that, alerts like “It looks like it will rain at dawn, so prepare in advance” are delivered as text messages, leading into time-series management.
The Way of ‘Agricultural AI’ Already Verified in the Field: Text Alerts → Prescriptions → Consulting
1) CES Innovation Award Point: Not the video itself, but an ‘AI decision-making system’
The system led by the National Institute of Agricultural Sciences earned recognition for its innovativeness overseas in the context that it wasn’t based on the long-standing “video utilization” approach, but rather a structure that helps with work decision-making using AI.
2) Change in farmer reactions: From “lack of water” to “work prescriptions”
At first, it was just simple alerts.
— Something like “It seems there’s not enough water, so please add water.”
The next stage becomes more specific.
— “Since it’s a water shortage, you need to irrigate a few times.”
— A form where prescriptions are attached, like “Pests and diseases are coming, so what diagnosis → what action.”
3) Addressing the digital divide: ‘Persuasion’ depends on the expression method by half
There’s a story that elders tend to judge by looking at whether “their situation has improved,” more than the AI itself, so they attracted attention with comparison cases.
In other words, the final gate for adopting the technology isn’t model performance only—it’s also on-site communication.
Resolution & Cycle Design: The “Agricultural Sweet Spot” of 5m x 5m and a 3-Day Cycle
The technical choice for the agriculture and forestry satellite isn’t just bragging about specs; it’s aligning with the “speed of agricultural decision-making.”
1) Spatial resolution: 5m x 5m
They treat 5m x 5m as a single point (pixel unit) and analyze it.
2) Temporal resolution: Scanning in 3-day units across the Korean Peninsula
If you improve resolution further (e.g., 1m x 1m), the capture swath decreases, and as a result, you may end up with a longer observation cycle.
Since agriculture growth, pests/diseases, and disasters progress “over a few days,” there’s a judgment that being able to see again in 3-day units is ultimately important.
Relationship with Drones: “Both Are Needed,” So We Combine Them
Questions keep coming up like, “Why not just use drones?”
The conclusion is that “you can’t solve everything with satellites alone,” and the explanation is that drones naturally fit in as a precision complement.
1) Satellites: Wide coverage + 3-day cycle
They’re good for quickly building time series at the scale of the Korean Peninsula.
2) Drones: More detail over a smaller area
However, it’s difficult for drones to capture under identical conditions every time, and a longer cycle creates limits for time-series analysis.
3) Therefore, a combined strategy
When needed, using satellite analysis values and drone observation values “together” enables more precise viewing.
Crops/Scenarios Where AI Becomes Especially Difficult: The Limits of Narrow Cultivation Land and Crop Classification
AI doesn’t get everything perfectly matched.
According to the director’s explanation, there are broadly two difficult points.
1) In Korea, farmland is ‘split into small pieces,’ making classification harder
Other countries often cultivate on larger plots, but in Korea, fields are divided into very small units (like one-tap units), so even 5m x 5m pixels may not be enough to distinguish them well.
2) Even within the same crop group, there are cases where classification is ambiguous
Example: Cases where growth characteristics are similar or hard to distinguish, like millet/oats/barley, become challenges.
That’s where the idea emerges to use drones as well for supplementation.
Outlook: Expand to 47 Crop Types—Agricultural AI Global Competitiveness Is a ‘Blue Ocean’
1) Current state: Focused on rice and spring cabbage, starting with foreign data → expanding with its own data
The crops currently operated mention two types: rice (for rice) and spring cabbage.
Going forward, a plan is presented to expand by increasing satellite-based analysis up to 47 types.
2) Diagnosis of Korea’s competitiveness: About 83–85 points versus the U.S.; the Netherlands/Japan are higher, but the ‘entry speed’ is an opportunity
When judging technology level against advanced countries, Korea is viewed as mid-to-upper tier, with the Netherlands/Japan being higher.
However, there’s also an interpretation included that if the U.S. had difficulty applying agricultural AI due to intense competition, then Korea—where competition is relatively less intense—could be a blue ocean.
Connection to Food & Grain Supply/Demand: A Direction to Reduce ‘Sudden Plunges’ with Data
Agriculture and forestry satellites ultimately lead to talk about food security.
Especially in a structure of grain self-sufficiency/imports, if major changes occur, prices shake, but there’s a direction that systematic data management can mitigate sudden drops in the short term.
Key Numeric Flow
It’s different from the food self-sufficiency rate, but the frame is introduced by mentioning grain self-sufficiency rate (including the context of feed grains) and saying it needs to be managed at the level of national policy tasks.
If predictions become data-based, the chances grow for adjusting optimal production and supply/demand.
Physical AI (AI That Acts) and Agricultural Robots: Different from a “Factory Where Lighting and Paths Are Fixed”
Robots and AI are already being added to agriculture, but unlike factories, there are many environmental variables.
For example, apples have many variables—size, color, leaves, and damage—so you get problems where the robot has to follow perfectly.
So agriculture is hard to integrate physical AI, but there’s a viewpoint that as technology accumulates, the value of “AI that acts” can grow rapidly.
Solving the Digital Divide: Design Education by Splitting It into ‘Literacy by Audience’
The technology gap ultimately comes down to how education is designed.
So the National Institute of Agricultural Sciences explains that they conduct education by segmenting based on the current understanding level of the audience and the content needed.
1) For seniors: ‘Going to them + persuading with comparison observation’
They don’t just tell people to come to the classroom; they visit village community centers and persuade them with real photos/comparison examples.
2) For those in their 50s–60s: More detail, more focus on data and use
Even with the same content, the needed “tone” differs, so they adjust the educational content.
3) Individual farm data reluctance: “Separate management + delete information + permission for third-party use”
This part is very important.
Even if satellite data is owned by the state, there’s a concern that it can still connect to “my land/my information.”
So, according to the director’s explanation:
— Satellite data and personal information are managed separately
— When opening to the outside, delete personal information
— For third parties to use it, you must get farmers’ consent
In other words, it emphasizes a structure aiming to secure both data sovereignty and trust in personal information.
In This Article, the 5 Most Important Conclusions About “Things That Aren’t Often Said Elsewhere”
1) The deciding factor for agriculture and forestry satellites is ‘decision-making based on reflectance and vegetation indices,’ not ‘photos’
2) Choosing a 3-day cycle (time resolution) is because farming moves in “day-level intervals”
3) The roadmap beyond text alerts is key—developing into ‘prescriptions/work timing’
4) Drones are not competitors; they’re ‘precision complementary assets’ (satellite-drone synthesis strategy)
5) Data sovereignty doesn’t end with technology; it must go together with trust design like ‘separating/deleting personal information and obtaining permission for use’
Natural SEO Keyword Integration: Search Points of This Article
This topic is very likely to keep bringing in traffic in search with keywords related to agricultural AI, data sovereignty, agriculture and forestry satellites, vegetation indices, and supply/demand prediction.
[ Summary ]
The agriculture and forestry satellite planned for launch in early July is a turning point that can reduce dependency on foreign countries and strengthen agricultural data sovereignty.
This satellite connects to supply/demand prediction and mitigation of price fluctuations by analyzing crop area/growth/disaster damage every 3 days based on vegetation indices and reflectance—not photos.
By combining Weather Agency forecasts (5km) with topographic maps and small-scale weather station data, it provides farm forecasts in 30m units, and emphasizes the shift from text alerts to prescriptions and consulting.
Drones are used together as complementary assets for narrow cultivation plots/precise classification, and digital divide issues are reduced through education methods tailored to audiences and on-site persuasion (comparison observation).
Also, the most important point is to secure trust through a structure that separates/manage deletes satellite data and personal information, and obtains permission for third-party use.
[Related Articles…]
Toiline: Data Sovereignty and AI Agricultural Strategy
Vegetation Index: Why Satellite-Based Agricultural Prediction Is Possible
*Source: [ 티타임즈TV ]
– 농림 위성은 한국 농업을 어떻게 바꿀 수 있을까? (성제훈 국립농업과학원장)