● Tesla, FSD, Robotaxi, Shock, Rulebreak, Surge
The Real Meaning of Wall Street’s “Tesla FSD Level 4” — and Why Unsupervised Robotaxis Are Still Only 39 Units
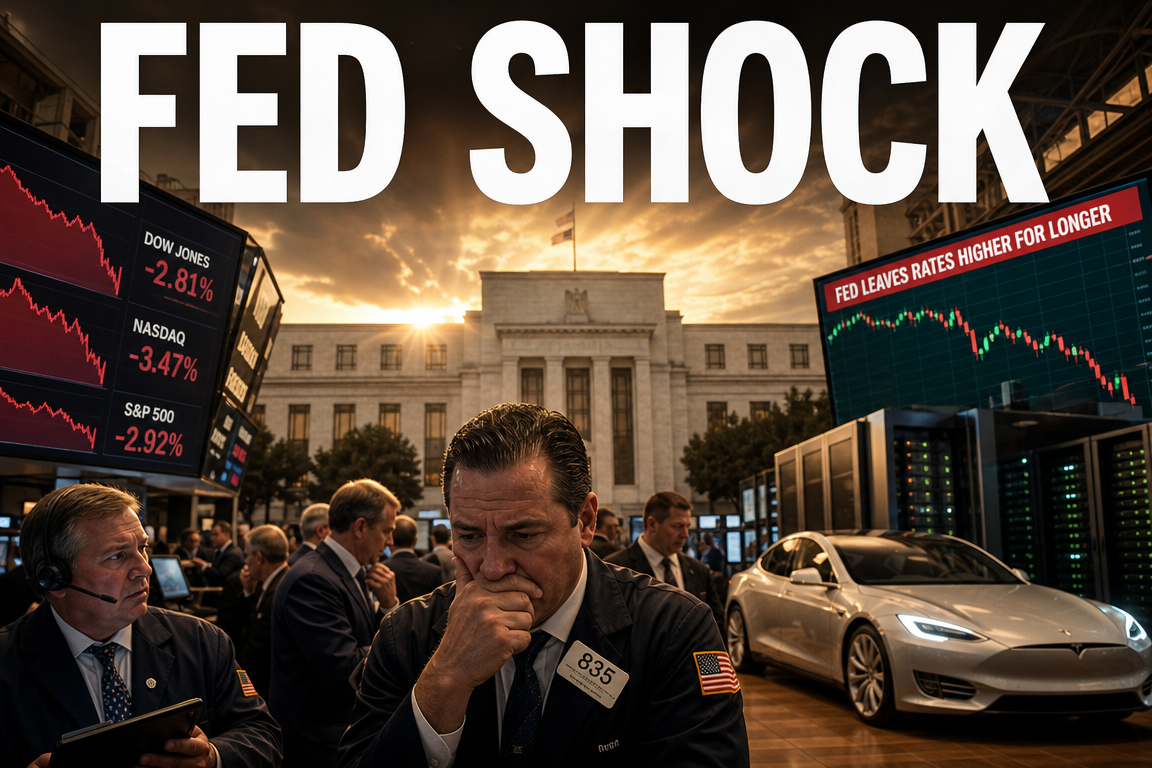
This development is not a simple Tesla share-price decline.
To interpret current trends across Tesla equity, autonomous driving, robotaxis, the AI sector, and the global macro backdrop, three elements must be assessed together:
- Why FSD approvals in Europe are accelerating
- Why a Wall Street analyst described Tesla as “effectively Level 4”
- Why fully unsupervised robotaxis remain limited to 39 vehicles
These items appear contradictory on the surface. The underlying explanation is that the “technology clock,” “regulatory clock,” and “commercialization clock” are moving at different speeds.
1. The Day’s Market Decline Was Not Tesla-Specific
Tesla closed at $381.5, down 3.8% (per the source).
- Nasdaq: -1.98%
- S&P 500: -1.62%
1-1. Primary Drivers: US CPI and Geopolitical Risk
The key catalyst was the US May CPI, reported at +4.2% YoY, reversing higher versus the prior reading.
Concurrent US–Iran tensions lifted oil prices, further reducing expectations for near-term rate cuts. In this setup, growth equities typically exhibit higher sensitivity, and Tesla traded within that macro risk-off regime.
1-2. Investor Takeaways
The decline is difficult to attribute solely to Tesla-specific fundamentals. The session reflected combined pressure from inflation concerns, rates, and energy/geopolitical risk. The practical focus shifts to where Tesla’s medium-term valuation may be re-rated.
2. Europe’s FSD Approvals: Not “One More Country,” but a Structural Shift
Belgium was added to the FSD-approved list on June 10 (US time), following Denmark on June 9—two approvals in two days.
Two months earlier, the Netherlands was the only approved European jurisdiction. The approved set is now:
- Netherlands
- Lithuania
- Estonia
- Denmark
- Belgium
This represents approximately 11% of EU member states.
2-1. Why This Matters
The significance is less about incremental country count and more about the European approval mechanism entering an acceleration phase.
2-2. Why the Pace Is Increasing: The Netherlands RDW First-Mover Effect
The Netherlands’ RDW appears to have served as the initial high-friction validation step. Once a leading regulator completes the first full review, subsequent jurisdictions can proceed via mutual recognition or a derivative review process.
In practice, later approvals resemble “review-and-sign” rather than a full zero-based assessment, enabling faster cadence.
2-3. Further Expansion Signals
Per the source:
- Sweden has approved public testing
- Latvia is progressing through documentation
A published “pending approvals” map from Tesla’s AI leadership reportedly included several major EU countries, supporting a domino-style interpretation rather than an isolated event.
2-4. Approval Does Not Equal Immediate Broad Deployment
Regulatory approval does not imply immediate activation across all vehicles:
- Additional local administrative steps may still be required
- Rollout may be concentrated on Hardware 4 vehicles
- A Europe-tuned OTA release (referenced as FSD v14 family) would likely be required
“Legal permission” and “mass user availability” remain separate steps.
3. Why European Approval Matters for Korea-Based Investors
This is not solely a Europe story.
3-1. Korean Regulation Typically Follows Precedent
Korea is more likely to reference established regulatory precedents (US, EU, Japan) than to create a fully independent framework at speed. As EU major jurisdictions formalize an FSD allowance framework, Korea’s marginal regulatory design burden may decline, improving feasibility for local permissions impacting Model 3 / Model Y FSD pathways.
3-2. Clues on Timing
Timing cannot be stated with certainty. However, as EU approvals broaden, Korea’s review process may accelerate. With broader Hardware 4 penetration and a growing evidence base from European deployments, Korea could operate as a “follow-on approver” rather than a first mover.
4. Why Wall Street Said Tesla Is “Effectively Level 4”
Piper Sandler analyst Alex Potter wrote that Tesla has “solved” the autonomy problem. While FSD is formally classified as Level 2, he argues performance under many conditions is approaching or reaching Level 4 in practical terms.
4-1. Level 2 vs Level 4
- Level 2: Driver assistance; the driver must continuously supervise and intervene immediately if required.
- Level 4: In defined domains and conditions, the vehicle can complete driving without human intervention.
4-2. Potter’s Three Core Inputs
4-2-1. Insurance Discounts
Tesla providing insurance discounts for FSD usage is interpreted as a signal derived from loss and accident probability data. If risk were higher, the incentive would be economically irrational.
4-2-2. Safety Data
The source references Netherlands-disclosed statistics indicating FSD is 3.5x+ safer than human drivers, and a North America figure of roughly one accident per 5.5 million miles with FSD engaged. If sustained, these would imply performance exceeding baseline human averages.
4-2-3. First-Hand Driving Experience
Potter cited long-distance use of FSD as materially shifting his view. While anecdotal relative to aggregate statistics, this combines with data and capital allocation into a cohesive market narrative.
4-3. Cybercab Investment Scale as Supporting Evidence
The analyst also cited Tesla’s aggressive capital deployment toward Cybercab/robotaxi programs as evidence of internal confidence regarding timeline. Large upfront spend is framed as less consistent with a 5–10 year horizon.
5. Operational Signals: ASS and Parking-Decision Capability
The source also referenced practical demonstrations.
5-1. Cybertruck ASS Deployment Signal
A Tesla Cybertruck account reportedly published an ASS clip showing the vehicle navigating a complex parking lot without occupants to meet the driver. Given Cybertruck’s distinct architecture (including steer-by-wire), this is positioned as evidence of broader model portability and neural-network generalization.
5-2. FSD v14: Complex Parking-Lot Decisions
A cited example describes the vehicle searching for parking, recognizing another vehicle’s entry, recalculating, reversing, and capturing a newly available spot near the entrance. This reflects real-time recomputation and decision revision beyond lane-keeping assistance.
6. Why Fully Unsupervised Robotaxis Are Still Only 39 Vehicles
This is the key reconciliation point.
Per the source:
- Cumulative registered robotaxi service vehicles: 721
- Austin: 104
- Dallas: 9
- Houston: 9
- (others implied)
- Fully unsupervised vehicles: 39
- Supervised (safety operator present): 682
6-1. The Headline Count Appears Contradictory
The large registered fleet can be misread as broad autonomy at scale. The unsupervised subset is the relevant denominator for true driverless operations.
6-2. Technical Capability vs Commercial Operation Are Different Stages
A system can function technically yet remain constrained in scaled commercial deployment due to:
- certification pathways
- operating rules
- maintenance and training
- insurance underwriting
- liability frameworks
This parallels aviation: a working airframe does not imply immediate global route deployment.
6-3. The “Three Clocks” Framework
6-3-1. Technology Clock
Model performance, FSD v14, ASS, and complex environment planning. This clock may be moving faster than expected.
6-3-2. Regulatory Clock
EU approvals, local road permissions, and unsupervised certification. This clock is slower than technology but appears to be accelerating in Europe.
6-3-3. Commercialization Clock
Revenue-generating, large-scale service with liability, insurance, and operational systems. This is typically the slowest clock.
The “39” figure is therefore more consistent with early-stage scaling and institutionalization than with outright technical failure.
7. Key Points in News Format: How to Read Tesla Now
7-1. Market
The move was primarily macro-driven (CPI, oil, geopolitics), pressuring growth equities broadly.
7-2. Technology
Some sell-side analysts are upgrading their practical interpretation of FSD, citing insurance actions, safety metrics, personal testing, parking-decision capability, and ASS progress.
7-3. Regulation
Belgium and Denmark approvals suggest EU permitting is entering a faster phase, aided by the Netherlands’ early regulatory work.
7-4. Business
Registered robotaxi fleets are increasing, but fully unsupervised operations remain limited. The binding constraints are increasingly regulatory, liability, insurance, and operating systems.
8. The Most Material Point Often Missed
The central change is that the primary bottleneck may be shifting from “whether the technology works” toward “how quickly regulation and operating frameworks unlock scale.”
Equity re-ratings often occur not at the moment of technical viability, but when regulatory clearance and scalable commercialization connect.
Key indicators to track:
- EU approval expansion pace
- Growth rate of the unsupervised fleet
- Institutionalization of insurance and liability structures
- Non-US expansion feasibility (including Korea)
9. Interpretation: “Proof” Is Becoming Less Important Than “Scaling”
The historical debate centered on feasibility: whether Tesla’s AI approach and camera-based strategy could work. The current flow suggests the market is increasingly focused on the speed of scaling and formalization.
Three near-term monitoring points:
- 9-1. Rate of increase in EU approved jurisdictions
- 9-2. Whether the 39 unsupervised count rises meaningfully over the next several months
- 9-3. Speed at which Asian regulators (including Korea) incorporate EU precedent
10. Conclusion
A consolidated framing:
- Technology appears close to functional maturity in many contexts, but large-scale monetization remains constrained by regulation and operating infrastructure.
- EU approvals indicate regulatory barriers may be easing.
- “Effective Level 4” language signals changing market perception of technical readiness.
- The 39 unsupervised robotaxis highlight that commercialization remains early-stage.
The core question is shifting from “Will it work?” to “Under what conditions, and how quickly, can it scale?”
< Summary >
- Tesla’s decline aligned with macro risk factors (CPI, oil, geopolitics) rather than a purely company-specific negative.
- European FSD approvals are accelerating (including Belgium and Denmark), supported by a Netherlands RDW first-mover regulatory effect.
- Some Wall Street commentary frames Tesla FSD as approaching practical Level 4, citing insurance actions, safety statistics, first-hand experience, and capex intensity.
- Fully unsupervised robotaxis remain limited to 39, implying commercialization constraints rather than purely technical constraints.
- Key bottlenecks: regulation, liability, insurance, and operating systems.
- Monitoring focus: EU approval velocity, unsupervised fleet growth rate, and regulatory diffusion beyond the US (including Korea).
[Related Articles…]
*Source: [ 오늘의 테슬라 뉴스 ]
– 월가 “FSD 레벨4 달성” 선언한 날, 로보택시는 39대뿐인 이유 — 세 가지 시계로 보는 $381 테슬라 지금 어떻게?
● Bond Shock, Rate Repricing, AI Cost Surge, Geopolitical Risk
The Structural Drivers Behind Repeated Sovereign Bond Sell-offs: Why the Current Episode May Persist Longer — The “Mid-Rate” Regime, U.S. Treasury Yields, AI Capex, and Geopolitical Risk
This episode should not be reduced to “yields rose.” The core issue is a structural repricing of the cost of capital.
This report consolidates the recurring causes of sovereign bond sell-offs, why U.S. Treasury yields have become harder to stabilize, why global macro and risk assets can weaken simultaneously, and how AI and the next industrial cycle can raise the effective floor for long-term rates.
Headline factors such as war, inflation, and central banks matter, but the more material shift is structural: expanding public debt, climate-transition financing, supply-chain reconfiguration, potential fragmentation in dollar-centric flows, and AI simultaneously improving productivity while intensifying capital demand.
1. Key Briefing: Why Sovereign Bond Sell-offs Keep Recurring
Recent sovereign bond sell-offs increasingly resemble a structural dynamic rather than a one-off event.
The mechanism is straightforward:
- Governments require more funding.
- Markets are less willing to finance that demand at prior low rates.
As sovereign issuance rises and marginal demand weakens, bond prices fall and yields rise.
This pattern is observable across major economies (United States, Japan, Korea, Europe). The U.S. Treasury market remains the global benchmark, so shocks are most visibly transmitted through U.S. long-end yields.
2. Core Point: Why Yields May Not Be “Safe” Even If Wars De-escalate
De-escalation reduces near-term risk premia, but post-conflict fiscal burdens often persist.
War functions not only as an oil-price shock, but as a structural driver of government borrowing:
- Replenishment of defense inventories
- Higher energy-security investment
- Larger allied burden-sharing and defense commitments
This increases sovereign issuance. The key question is whether there is sufficient price-insensitive demand to absorb supply as in prior decades.
Under fragmentation and geopolitical competition, U.S. Treasuries can be treated as strategic holdings rather than purely economic safe assets, weakening automatic absorption dynamics.
3. Direct Driver 1: Inflation Risk Does Not Decay Easily
Inflation risk remains a primary driver of higher yields:
- Middle East risk
- Energy-price volatility
- Supply-chain instability
If investors assess a material risk of re-acceleration in inflation, holding long-duration bonds at lower yields becomes less attractive, contributing to long-end selling pressure.
This reflects both inflation expectations and a higher term premium: investors require greater compensation for tying up capital over long horizons.
4. Direct Driver 2: Public Debt Is Expanding Too Rapidly
The more fundamental concern is persistent debt accumulation.
Post-crisis and post-pandemic fiscal expansion, combined with supply-chain shocks, war, and subsidy-driven industrial policy, has materially widened fiscal footprints. Forward-looking expenditure pressures include:
- Defense
- Social programs
- Industrial policy
- Energy transition
Markets increasingly price two risks:
- Long-run fiscal sustainability
- Potential reliance on inflation as an implicit debt-reduction mechanism
As these risks rise, investors demand higher yields.
5. Structural Background 1: Global Demand for U.S. Treasuries Is Less Reliable
Treasury yields are ultimately supply-demand outcomes.
Even with large issuance, yields can remain contained if global demand is strong and stable. That premise is weakening:
- Some reserve managers are adjusting dollar-asset allocations
- Portfolio decisions are increasingly influenced by geopolitical considerations
This reduces the marginal bid for Treasuries and increases sensitivity to auctions and positioning.
6. Structural Background 2: De-globalization and Supply-Chain Rebuilding Create a “High-Cost” Regime
The prior regime benefited from low-cost labor, optimized global specialization, and efficient logistics, supporting low inflation.
Current shifts prioritize resilience over efficiency:
- Onshoring and “friend-shoring”
- Strategic reconfiguration across semiconductors, batteries, energy, critical minerals, defense, and cloud infrastructure
This implies structurally higher costs and persistent inflation pressure, constraining the magnitude and durability of policy-rate cuts and raising the probability of a higher neutral rate.
7. Why the “Mid-Rate” Regime Is Central: The Difficulty of Returning to Ultra-Low Rates
The key framework is a mid-rate environment rather than a return to sustained ultra-low rates.
This is not primarily about central bank preference; it reflects a structural increase in capital demand and financing needs, raising the likelihood that the neutral rate shifts higher.
Four major forces:
- Large-scale public debt
- Climate-transition investment
- AI-driven technology and productivity capex cycle
- Defense spending linked to geopolitical risk
Each increases funding demand and supports a higher rate floor.
8. Climate Policy and Energy Transition: A Larger Upward Pressure on Rates Than Commonly Priced
Climate response has become a financing and fiscal challenge:
- Renewables
- Grid expansion
- Nuclear investment
- Battery and charging infrastructure
- Carbon abatement and industrial retrofits
- Urban and resilience infrastructure
These are multi-decade investments. Because many projects are difficult to fund solely via private markets, subsidies, policy lending, and public balance sheets are frequently involved—linking the transition directly to sovereign issuance and long-end rate pressure.
9. Why AI Can Push Rates Higher: Productivity Alone Is an Incomplete Frame
AI can raise productivity, improve margins, and potentially lift trend growth.
However, AI also drives substantial capital expenditure:
- Data centers
- Power generation and grid investment
- GPUs, HBM, advanced semiconductors
- Cooling systems
- Networking equipment
- Robotics and industrial automation
As physical AI and industrial robotics scale, factory automation, sensors, power management, and edge computing can accelerate capex further.
Result: AI is supportive for growth but can create downward rigidity in rates through increased capital demand.
10. How AI-Driven Returns on Capital Can Feed Into Inflation in Certain Phases
Successful AI diffusion can lift equity valuations and returns on capital.
This can translate into:
- Higher consumption via wealth effects
- Reinvestment and capacity expansion
Aggregate demand can re-accelerate, and select sectors may face wage and services inflation pressure. AI can be disinflationary in cost structure while also contributing to re-inflation dynamics through demand and investment channels. The linkage “AI up, rates down” is not mechanically valid.
11. Geopolitical Fragmentation: Why Dollar Flows, Supply Chains, and Defense Budgets Are Linked
Geopolitics is increasingly a core interest-rate variable because it reshapes cost structures and fiscal policy.
Prolonged great-power competition typically drives:
- Supply-chain localization or allied reconfiguration
- Reserve diversification and safe-asset portfolio shifts
- Higher defense spending and strategic-industry subsidies
These channels increase fiscal outlays and tend to be financed through expanded sovereign issuance.
12. The Shift Toward Drones and Asymmetric Capabilities
Modern conflict is increasingly shaped by:
- Drones and autonomy
- Precision systems
- Cyber capabilities
- Space-based surveillance infrastructure
Defense spending is therefore more intertwined with AI, semiconductors, communications, software, and batteries. This increases the probability that defense, AI infrastructure, semiconductors, and telecom equipment behave as a connected investment complex.
13. Why Equities Can Rise While Treasury Yields Also Rise
Traditional regimes often featured negative correlation between long rates and equity multiples.
In the current environment, equities and long yields can rise together because:
- AI and industrial policy support growth expectations and earnings narratives
- The same cycle increases capital demand and term premia, lifting long-end yields
This combination tends to produce higher volatility and sharper drawdowns during risk-off episodes, even within upward-trending equity markets.
14. Likely Recurring Market Pattern
A repeatable sequence is increasingly plausible:
- Shock catalyst (war, fiscal expansion, inflation concerns, weak auctions)
- Rapid rise in long-end yields
- Higher volatility across equities and risk assets
- Temporary stabilization via central bank communication or growth slowdown
- Renewed upward pressure as structural drivers persist
Markets may focus less on direction and more on a higher “level shift” in rates.
15. Investor Checklist: What to Monitor
A policy-cut narrative alone is insufficient. Key indicators include:
- U.S. fiscal deficit trajectory and Treasury issuance
- Auction metrics and foreign official/private demand signals
- Energy price trends (oil, natural gas)
- AI infrastructure capex cycle and power-demand growth
- Industrial policy intensity (semiconductors, defense)
- Long-end yields and term premium dynamics, not only the policy rate
Long-end stabilization matters most for corporate financing costs, valuation sensitivity, and housing/real estate credit conditions.
16. Implications for Households and Real-Economy Participants
A mid-rate regime directly impacts:
- Mortgage and rental-financing costs, which may remain elevated
- Corporate funding costs, potentially tightening hiring and wage policies
- Reduced fiscal flexibility, increasing selectivity in social and support programs
- Higher asset-price volatility even when longer-term trends remain constructive
Balance-sheet resilience becomes more important when the cost of money is structurally higher.
17. Underappreciated Point: This Is Not Only a Business-Cycle Move
The dominant shift is a transition from a low-rate, low-cost, highly globalized regime toward a mid-rate, higher-cost, more fragmented regime.
In this transition, rates can rise even on “good news”:
- Strong AI adoption
- Accelerated energy transition
- Supply-chain stabilization
The common factor is the scale of capital required. Part of the rate pressure may represent the financing cost of systemic transition rather than a pure recession signal.
18. Conclusion: The Era of “Free Money” Has Likely Ended; Liquidity Quality Matters More
Liquidity is not disappearing; it is becoming more expensive and more selective.
Governments face ongoing spending needs, industries are undergoing large transitions, and AI, energy, and defense compete for capital. Asset markets may still offer opportunities, but flows are more likely to concentrate in areas with clearer:
- Earnings durability
- Cash-flow visibility
- Policy support
- Strategic positioning
Repeated sovereign bond sell-offs should be interpreted as a warning signal from the macro transition, not a bond-market-only event.
19. Five Key Questions to Track
- Is public debt across major economies sustainable under realistic growth and rate assumptions?
- How large can climate and energy-transition costs become, and over what timeline?
- Does the AI capex boom raise the cost of capital more than it raises productivity in the medium term?
- How materially can geopolitical risk alter demand for dollar assets?
- Is a higher neutral rate a temporary phase or an emerging benchmark?
20. One-Line Operational Summary
Sovereign bond sell-offs are recurring not only due to war, but because debt expansion, climate investment, AI capex, and geopolitical fragmentation jointly raise the price of money; the key variable is less “whether rates are cut” and more “whether economies and markets can absorb a higher rate level.”
< Summary >
Repeated sovereign bond sell-offs reflect structural change rather than isolated shocks. Expanding public debt, climate-transition financing, AI infrastructure investment, supply-chain reconfiguration, and higher defense spending jointly increase capital demand. As a result, U.S. Treasury yields and global long-term rates may remain resistant to sustained declines as the global economy transitions from a low-rate regime to a mid-rate regime. AI supports growth but can raise the rate floor through capital intensity. Future episodes are likely to recur as volatility cycles; investors should monitor long-end yields alongside fiscal dynamics.
[Related Articles…]
- U.S. Treasury Supply, Auctions, and the Term Premium: What Moves Long-End Yields
- AI Infrastructure Capex and Power Demand: Implications for Rates and Equity Duration
*Source: [ 경제 읽어주는 남자(김광석TV) ]
– 국채 발작이 반복되는 이유 | 김광석의 북리뷰_머니쇼크 [3편]