● Nasdaq-Risk-Reversal
The Real Driver of a Nasdaq Reversal Is Not an AI Bubble: Recession Signals from Bonds, Oil, and Diesel
The key issue in the current Nasdaq correction is not the magnitude of the decline in AI stocks.
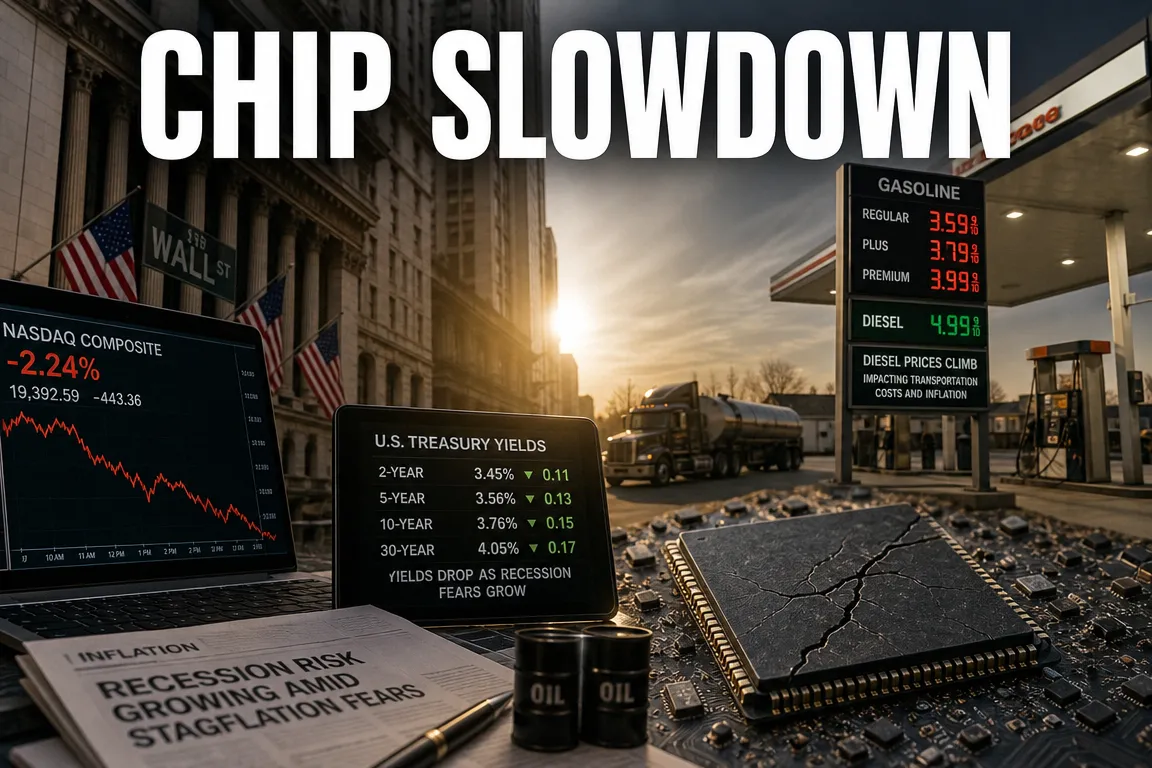
More important factors include the reasons behind falling U.S. Treasury yields, the divergence between crude oil and gasoline prices, and the impact of rising diesel prices on inflation and consumption.
Combined with the dead-cat bounce and technical support levels observed in Nasdaq futures, these indicators may help determine whether the market is experiencing a routine correction in AI semiconductor stocks or beginning to price in recession and stagflation risks.
The source does not clearly identify the recording date, index product, chart interval, or official pricing data.
The following analysis therefore summarizes the market interpretation presented in the source rather than treating specific prices as current facts.
1. Why the Nasdaq Decline Should Not Immediately Be Viewed as an AI Bubble Collapse
Key development: AI-related stocks are declining, but price weakness alone is insufficient to conclude that the AI bubble has collapsed.
A bubble-collapse thesis would require evidence of fundamental deterioration, not merely lower share prices.
Relevant indicators include data-center project cancellations, reduced AI capital expenditure by cloud providers, declining GPU orders, rising semiconductor inventories, price cuts, and deteriorating operating margins.
The source argues that AI companies are undergoing valuation repricing amid weaker investor sentiment rather than an immediate collapse in earnings.
If share prices decline despite solid results, the market may be discounting slower future growth or changes in required returns.
AI semiconductor companies, including Nvidia, have benefited from both expanding demand and elevated pricing and margins caused by supply shortages.
As Chinese semiconductor manufacturers and global competitors expand production capacity, shortages may ease and pricing competition may intensify.
Under this scenario, the AI industry could continue to grow while semiconductor companies experience lower excess returns and valuation multiples.
The distinction is between the end of AI industry growth and a correction in AI equity valuations.
An industry can expand while its stocks decline, and earnings can rise while still falling short of market expectations.
2. Why the Recession Outlook Matters More Than the AI Bubble Debate
Key development: If the technology-sector correction weakens consumption and corporate investment, the market narrative may shift from an AI bubble to a U.S. recession.
The U.S. economy has a relatively strong connection between financial markets and real economic activity.
A prolonged equity-market decline can reduce household wealth and weaken consumer confidence through the wealth effect.
Lower corporate valuations can also tighten financing conditions, leading companies to become more cautious about investment and hiring.
A correction initially driven by valuation concerns can therefore contribute to an actual slowdown if it develops into tighter credit, weaker consumption, and lower business investment.
At that stage, pressure may spread from AI stocks to semiconductors, industrials, transportation, consumer companies, and small-cap equities.
Investors should evaluate employment, consumption, credit spreads, capital expenditure, and leading economic indicators rather than focusing only on daily moves in AI stocks.
3. Falling Treasury Yields Are Not Always Positive for Equities
Key development: Investors must distinguish between yields falling because inflation is easing and yields falling because recession concerns are driving demand for government bonds.
Bond prices and yields generally move in opposite directions.
When investors purchase U.S. Treasuries, bond prices typically rise and yields fall.
Lower yields reduce the discount rate applied to growth stocks and are usually supportive of the Nasdaq.
However, the interpretation changes when yields decline because investors are seeking safety amid recession concerns.
In that environment, lower yields may signal weaker growth and earnings expectations rather than improved liquidity conditions.
The following factors should be considered when interpreting declining Treasury yields:
-
Determine whether only the 10-year yield is declining or whether the 2-year yield is also falling.
-
Assess whether yield-curve normalization reflects stronger growth expectations or a sharp decline in short-term yields.
-
Monitor whether corporate credit spreads over Treasuries are widening.
-
Examine whether gold, the U.S. Dollar Index, and volatility measures are rising simultaneously.
-
Determine whether expectations for Federal Reserve rate cuts reflect lower inflation or economic deterioration.
Bonds and gold should not be treated as universally safe assets.
Both can experience significant short-term volatility due to market positioning, liquidity conditions, sentiment, and leveraged liquidations.
They are more accurately described as assets that may attract relative inflows during risk-averse periods.
4. Why U.S. Gasoline Prices May Lag Rising Crude Oil Prices
Key development: When crude oil and retail gasoline prices move at different rates, investors should examine demand, inventories, refining margins, and regional supply conditions.
The source interprets rising crude oil prices alongside relatively stable U.S. gasoline prices as a possible sign of weaker mobility and consumer demand.
If consumers reduce driving and travel, weaker gasoline demand may prevent the full increase in crude oil prices from passing through to retail prices.
However, weak consumption is not the only possible explanation.
Retail gasoline prices also reflect refinery utilization, inventories, refining margins, transportation costs, taxes, seasonal fuel specifications, and local competition.
Crude oil may rise temporarily because of geopolitical risk while gasoline prices remain constrained by sufficient inventories or weak demand.
Conversely, gasoline prices can rise even when crude oil is stable if refinery outages, hurricanes, or seasonal fuel transitions disrupt supply.
To determine whether the divergence signals an economic slowdown, investors should review U.S. Energy Information Administration data on gasoline inventories, product supplied, refinery utilization, and average retail prices.
5. Diesel Prices and Freight Costs May Be More Important
Key development: If diesel and other middle-distillate prices rise faster than gasoline, corporate transportation costs and product prices may increase before households experience the full impact.
The United States has extensive territory and relies heavily on trucking, making diesel prices an important driver of producer prices and distribution costs.
When diesel prices rise, transportation companies often increase fuel surcharges. These costs may then pass through manufacturers and retailers to consumers.
Agricultural machinery, construction equipment, rail transport, and some industrial facilities are also exposed to middle-distillate prices.
Aircraft primarily use jet fuel rather than conventional diesel, while large vessels use marine fuel oil or marine gas oil.
These fuels remain linked through crude refining and middle-distillate markets and may rise alongside diesel during geopolitical disruptions.
Potential reasons for diesel outperforming gasoline include:
-
Low refined-product inventories or refinery disruptions.
-
Relatively strong trucking and industrial demand.
-
Higher jet-fuel and military logistics demand caused by war or geopolitical conflict.
-
Stronger exports tightening domestic U.S. middle-distillate supply.
-
Seasonal heating-oil demand competing with diesel supply.
6. Risks When Gasoline Is Stable but Diesel Is Rising
Key development: Weak consumer mobility combined with rising corporate logistics costs can produce slower growth and higher product prices.
Stable gasoline prices reduce household energy expenses and are generally supportive of consumption.
However, if stability reflects weaker travel and consumer activity, the broader economic signal may be negative.
At the same time, rising diesel prices increase transportation and production costs for businesses.
When consumption is weak but input costs remain elevated, margins contract and the earnings gap widens between companies with pricing power and those without it.
If this pattern persists, markets may begin to price in stagflation risk.
Stagflation occurs when economic growth slows while supply-driven inflation remains persistent.
Under these conditions, central banks may be unable to reduce interest rates rapidly despite weakening growth.
This can create a more difficult equity-market environment than a conventional recession.
7. How a Recession Could Affect AI Semiconductors
Key development: Semiconductors are both a technology industry and a highly cyclical sector.
During an economic slowdown, companies may delay investments in servers, personal computers, smartphones, vehicles, and industrial equipment.
Although AI data-center investment has strong long-term growth potential, its near-term pace depends on financing conditions and the capital-expenditure plans of cloud providers.
Because semiconductor production responds to demand with a lag, weaker demand can lead to rising inventories and falling prices.
Investors should therefore evaluate order backlogs, inventory days, average selling prices, customer concentration, and capital-expenditure trends in addition to revenue growth.
China’s semiconductor localization efforts and pricing competition may also affect long-term industry margins.
Even if Chinese chips cannot immediately replace leading-edge GPUs, increased supply of commodity chips and selected AI accelerators could alter global semiconductor pricing.
8. Short-Term Warnings from the Nasdaq Chart
Key development: The source warns that the rebound failed to invalidate the existing bearish pattern and was followed by a large bearish engulfing candle.
A dead-cat bounce does not refer to a single weak rebound session.
It describes a rapid technical rebound within a broader downtrend that fails to break key resistance and is followed by renewed selling.
The source describes a large bearish candle engulfing a rebound formed by several bullish candles.
This bearish engulfing pattern may indicate that buying momentum has faded and sellers have regained control.
However, no candlestick pattern guarantees a decline in the following session.
Technical analysis is a probability-based framework derived from historical patterns, not a definitive forecast of future prices.
9. Key Nasdaq Price Levels Identified in the Source
The source identifies approximately 30,050 as a major resistance level during the rebound.
It also presents approximately 29,000 as a key threshold. A break below that level could expose the 28,400-28,200 area.
The 28,400-28,200 range is identified as a potential lower support zone where phased accumulation could be considered.
However, the source does not specify whether these figures refer to the Nasdaq-100 cash index, E-mini Nasdaq-100 futures, or Micro E-mini futures.
The chart interval and contract month are also unclear, so these levels should not be applied directly to current markets.
Investors should first confirm the ticker, contract month, chart interval, and real-time price of the instrument being traded.
10. Considerations When Reviewing Futures Charts
On TD-affiliated U.S. trading platforms, E-mini S&P 500 futures are generally displayed under /ES, while E-mini Nasdaq-100 futures are displayed under /NQ.
Relevant futures charts are also available through TradingView and MarketWatch, although quotations may be real-time or delayed depending on exchange-data subscriptions.
Futures prices on free platforms such as Yahoo Finance may also be delayed or differ from executable prices because of data-provider terms and market hours.
Short-term traders should verify whether quotations are real-time, the length of any delay, and whether prices reflect regular or overnight trading sessions.
11. Why Small-Cap Purchases Require Greater Caution
When market stress broadens into recession concerns, small-cap companies may face greater downside risk than large technology companies.
Smaller companies often have higher borrowing costs, narrower customer bases, and less liquidity to absorb an economic slowdown.
Even if Treasury yields decline, widening corporate credit spreads may prevent small businesses from benefiting from lower financing costs.
Investors should avoid purchasing small-cap stocks solely because prices have fallen when major indices have not established support.
A lower price does not necessarily indicate undervaluation.
If earnings expectations and balance-sheet conditions deteriorate faster than the share price, further downside may remain.
12. The Most Important Issues Often Overlooked in Market Coverage
First, the primary issue is not the AI bubble debate but a potential shift in the market narrative.
If declining yields are interpreted as a recession signal rather than a technology-sector tailwind, the same economic data may generate the opposite market response.
Second, relative prices among refined products may provide more useful information than crude oil alone.
Investors should compare gasoline, diesel, jet fuel, and refining margins to distinguish household demand conditions from industrial cost pressures.
Third, rising diesel prices may pressure corporate margins before appearing fully in consumer inflation.
If companies initially absorb higher transportation costs, the impact may emerge later through earnings downgrades or price increases.
Fourth, strong current earnings do not make a share-price decline irrational.
Equity markets discount future growth, margin sustainability, interest rates, and changes in expectations rather than current results alone.
Fifth, predetermined entry conditions are more important than specific chart levels.
Phased purchases based on support tests, stabilizing volume, higher lows, and recovered resistance levels generally provide better risk control than undisciplined averaging down.
13. Economic and Market Monitoring Checklist
-
Identify the drivers of changes in U.S. 2-year and 10-year Treasury yields.
-
Monitor whether high-yield corporate credit spreads are widening.
-
Review gasoline and diesel inventories, refinery utilization, and refining margins.
-
Compare U.S. vehicle activity with retail sales and consumer-confidence data.
-
Track trends in initial unemployment claims and nonfarm payrolls.
-
Review AI data-center investment and cloud-provider capital-expenditure guidance.
-
Monitor semiconductor inventory days and average selling prices.
-
Assess whether a Nasdaq rebound breaks major resistance with stronger trading volume.
< Summary >
Current evidence is insufficient to classify the Nasdaq correction as the collapse of an AI bubble.
The more important issue is whether declining Treasury yields reflect lower inflation or increasing recession concerns.
If crude oil rises while gasoline remains stable and diesel strengthens, investors should assess whether weaker consumer demand and higher logistics costs are occurring simultaneously.
If sustained, this combination could increase stagflation risk by pairing slower growth with persistent cost inflation.
AI semiconductors retain long-term growth potential, but a recession could pressure capital expenditure, inventories, earnings, and valuation multiples.
The source identifies a failed dead-cat bounce and potential further downside, but the quoted levels require confirmation because the underlying product and chart interval are unspecified.
Rather than attempting to predict the market bottom, investors should define exclusion zones and objective conditions for phased purchases.
This material is provided for market analysis and informational purposes only and does not constitute a recommendation to buy or sell any security or financial instrument.
[Related Articles…]
*Source: [ 미국주식은 훌륭하다-미국주식대장 ]
– 진짜 문제는 따로 있거든요. 나스닥의 반전은 지금부터 입니다. 꼭 보세요.